http://www.jscdss.com Vol.4 No.6 December 2017: 8-14 Article history:
Accepted 02 December 2017 Published online 02 December 2017
Journal of Soft Computing and Decision
Support Systems
A Predictive Method for Mesothelioma Disease Classification Using Naïve
Bayes Classifier
Mehrbakhsh Nilashi a,b,*, Morteza Zamani Roudbaraki b, Mohammadreza Farahmand c
a
Faculty of Computing, Universiti Technologi Malaysia, Johor, Malaysia b
Department of Computer Engineering, Lahijan Branch, Islamic Azad University, Lahijan, Iran c
Department of Computer Science, Abarkouh Branch, Islamic Azad University, Abarkouh, Iran
* Corresponding author email address: [email protected]
Abstract
Malignant Mesothelioma (MM) is a rare but highly aggressive tumour. The aim of this study is to improve the classification accuracy of MM disease by developing an intelligence system using machine learning techniques. Our method is developed through clustering, noise removal and classification approaches. Accordingly, we use Expectation Maximization (EM) and Naive Bayes (NB) for clustering and classification tasks, respectively. Experimental results on a malignant pleural mesothelioma disease dataset show that propos ed method remarkably improves the accuracy of mesothelioma’s disease prediction. The hybrid intelligent system can assist medical practitioners in the healthcare practice as a decision support system.
Keywords: Malignant Mesothelioma disease diagnosis, Clustering, Naïve Bayes, Machine learning
1. Introduction
Malignant Mesothelioma (MM) is an aggressive cancer of the serous membranes with a poor prognosis (Gemba et al., 2013; Spugnini et al., 2006). MM is a fatal tumor originating from the mesothelial tissue. There are two major localizations of MM: the pleura and peritoneum. The pleural form of malignant mesothelioma is the most common type accounting for more than 70% of all mesothelioma cases (Suzuki, 1981). Exposure to asbestos is a risk factor independent of tumor localization. Due to the association with asbestos exposure this tumor is often the result of industrial practices (Lanphear and Buncher, 1992; Marinaccio et al., 2007). According to the recent studies, BRCA1-associated protein-1 (BAP1) germline gene mutations have been identified and associated with a cancer syndrome that includes Malignant Pleural Mmesothelioma (MPM), ocular or cutaneous melanoma, and other cancers (Iacono et al., 2015; Testa et al., 2011; Cheung et al., 2013). MM is associated with poor patient survival due to difficulties in diagnosis and treatment options currently available (Sekido, 2008). This disease is largely unresponsive to traditional cancer treatments such as chemotherapy or radiation (Spugnini et al., 2006). It has caused 15,000–20,000 deaths annually worldwide (Zervos et al., 2008; Er et al., 2015). The development of a mesothelioma is a lengthy process, the tumor appearing 25-60 years after asbestos exposure. There is no definitive standard of care for this disease and it has been shown that individual modalities such as chemotherapy, radiotherapy
and surgery have been failed to prolong survival (Gemba et al., 2013).
Machine learning deals with the development of technologies which allow machines to learn (Crown, 2015). The challenge is to create algorithms that can take a group of patterns (on a broader range, the existing knowledge) and automatically make new inferences from the initial information, with or without human intervention.
From the machine learning perspective, classification is the problem of identifying a set of observations into several categories, basing on the training result of a subset of observations whose belonging category is known. The unsupervised learning is defined as cluster analysis. It is also called clustering. Clustering is a process of putting a set of observations into several reasonable groups according to certain measure of similarity within each group (Nilashi et al., 2015). The clustering problem has been addressed in many diseases diagnosis systems. This reflects its broad appeal and usefulness as one of the steps in exploratory health data analysis.
There is a vast sea of different techniques and algorithms used in data mining especially for supervised machine learning techniques, therefore, selecting appropriate techniques is an important task in developing the disease diagnosis systems with a reasonable accuracy. In addition, many methods and algorithms have been developed for diseases diagnosis by machine learning techniques (Nilashi et al., 2018; Nilashi et al., 2017a; Nilashi et al., 2017b; Nilashi et al., 2017c; Nilashi et al., 2017d; Nilashi et al., 2017e; Nilashi et al., 2016a; Nilashi et
al., 2016b; Akben et al., 2016; Karthikeyan, 2016; Li et al., 2015; Er et al., 2015; Hruschka and Ebecken, 2006; Chen, 2014; Polat, 2012; Marcano-Cedeño, 2011; Onan, 2015; Karabatak, 2015; Bhardwaj and Tiwari, 2015; Sheikhpour et al., 2015; Hariharan et al., 2014; Babu and Suresh, 2013; Shahmoradi et al., 2016; Maghooli et al., 2016; Ahmadi Far et al., 2016). From the literature on Mesothelioma’s disease diagnosis, we found that at the moment there are no implementations of Gaussian mixture model with Expectation Maximization (EM) and Naive Bayes methods for distinguishing between presence and absence of Mesothelioma’s disease in patients. To the best knowledge of the authors, there is no implementation of classification, clustering and noise removal methods for Mesothelioma’s disease diagnosis form a real-world dataset. This research accordingly tries to develop a Mesothelioma’s disease diagnosis intelligent system based on these methods. Overall, in comparison with research efforts found in the literature, in this research:
EM is used for data clustering. The clustering problem has been addressed in many diseases diagnosis systems (Nilashi et al., Hruschka and Ebecken, 2006; Chen, 2014; Polat, 2012; Nilashi et al., 2017). This reflects its broad appeal and usefulness as one of the steps in exploratory health data analysis. In this study, EM clustering is used as an unsupervised classification method to cluster the data of experimental dataset into similar groups.
NB is used for data classification. NB is widely employed in diagnosis of diseases for their efficiency and robustness. It is a promising classification approach which has been used in many researches on diseases classification.
By combination of EM and NB, a hybrid intelligent system is proposed to improve the predictive accuracy of Mesothelioma’s disease.
Our study at hand is organized as follows: In Section 2, the research methodology and all techniques incorporated to the proposed method are explained. In Section 3, the evaluations of methods are presented. In Section 4, we present the method evaluation. Finally, we conclude our work in Section 5.
2. Method
In
the present study, EM and NB methods are used. These methodologies are addressed in the following sections. The general framework of proposed model is shown in Fig. 1. In this study, EM clustering is used as an unsupervised classification method to cluster the data of experimental dataset into similar groups. We propose to rely on NB to learn the classification models. In the first step, the data is pre-processed (1). In the second step, EM clustering processing steps are performed to cluster the data (2). Next, classification models are learned by NB for each cluster (3).In order to evaluate the proposed method, we have performed several experiments on a real-word dataset of Mesothelioma’s disease. The dataset was retrieved from Data Mining Repository of the University of California, Irvine (UCI). This dataset includes the patient’s hospital reports (three hundred and twenty-four Mesothelioma patient data) from Dicle University, Faculty of Medicine’s (Er et al., 2015). All sample of the experimental dataset have have thirty-four attributes. These attributes have been considered more effective than other factors by doctor’s guidance are: {age}, {gender}, {city}, {asbestos exposure}, {type of MM}, {duration of asbestos exposure}, {diagnosis method}, {keep side}, {cytology}, {duration of symptoms}, {dyspnoea}, {ache on chest}, {weakness}, {habit of cigarette}, {performance status}, {white Blood}, {cell count (WBC)}, {hemoglobin (HGB)}, {platelet count (PLT)}, {sedimentation}, {blood lactic dehydrogenise (LDH)}, {Alkaline phosphatise (ALP)}, {total protein}, {albumin}, {glucose}, {pleural lactic dehydrogenise}, {pleural protein}, {pleural albumin}, {pleural glucose}, {dead or not, pleural effusion}, {pleural thickness on tomography}, {pleural level of acidity (pH)}, {C-reactive protein (CRP)}, {class of diagnosis}.
Fig. 1.
Proposed model for the Mesothelioma’s disease
diagnosis
2.1 EM Clustering
One of the commonly used model-based clustering approaches is mixture approach Expectation Maximization
Data Pre-Processing
Clustering Using EM
Mesothelioma’s Disease
Dataset
Naive Bayes Classifier
S
(EM) algorithm was first time officially proposed by Dempster et al. (1977). Later Wu (1983) has corrected a flawed convergence analysis in the method. The EM algorithm is widely used (Nilashi et al., 2017f; Nilashi et al., 2016c; Nilashi et al., 2016d; Nilashi et al., 2016e) because of its simplicity, easy implementation and its efficient iterative procedure in computing the Maximum Likelihood (ML) (Jung et al., 2014).
Since it is not easy to maximize the log-likelihood directly, EM algorithm maximizes the expectation of complete log-likelihood instead. The complete data in EM algorithm are considered to be (x, z). z is the missing data indicating the mixture component origin label of each observation. z = (z1, . . . , zn) where zi = k when xi belongs to the component
k. The complete log-likelihood takes the form:
1 1
( , | ) K K iklog ( k k( ; k)
k k
CLZ X
z f x (1)EM algorithm starts from the initial parameters 0 , then computes the Expectation step (E-step) and the Maximization step (M-step) iteratively:
E-step: In this step, the expected value of the complete log-likelihood function is calculated. The calculation is with respect to the conditional distribution of z given x under the current estimate of the parameters
:
( )
( , q ) [ ]
Q E P (2)
log( ( , | )
P CL Z X (3)
i.e. Calculate the posterior probabilities ( )q ik
t of xi belonging
to the kth component:
( ) ( )
( )
( ) ( )
( ; )
( ; )
q q
q k k k
ik q q
l l l
l f x t
f x
(4)M-step: In this step, the parameter (q1) is found that maximizes the expectation:
(q1) arg maxQ( | ( )q )
(5)
2.2 Naïve Bayes Classifier
NB is a learning technique (classifier) based on Bayes’ theorem (Bermejo et al., 2014). It has been a useful technique for large datasets as it has no complicated iterative parameter estimation. In addition, this technique has been particularly suited when the dimensionality of the input data is high. NB uses the probabilities of each attribute of dataset belonging to each class of data to make
a classification task. Normal, Gamma, Poisson and Lognormal density functions make it possible the NB be modelled in several ways. The NB performs the classification task on data in two steps:
Training Step: In this step, using the planning investigates, the framework evaluates the parameters of probability dissemination; tolerating qualities are prohibitively free given the class.
Prediction Venture: In this step, for any unseen test illustration, the framework figures the back probability of that variety fitting within each class. The technique then arranges the test specimen concurring the biggest back likelihood.
3. Results of methods
The experimental results of the proposed method on a real-world dataset are explained in this section. Here, the results of applying all incorporated methods in the proposed system are discussed.
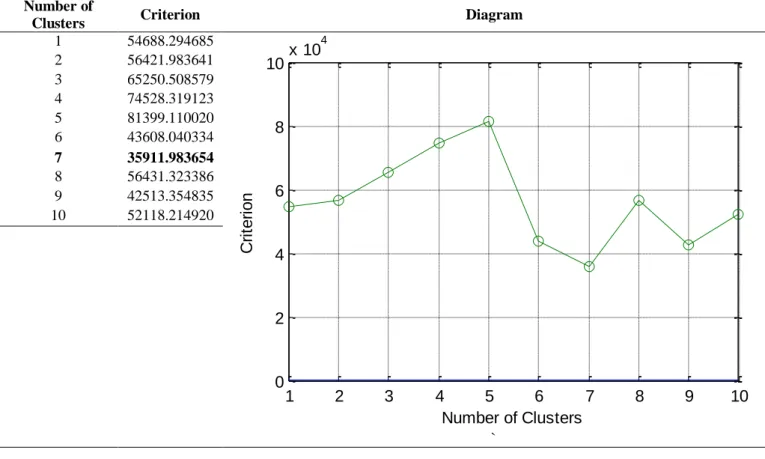
In this research, EM algorithm is applied on experimental dataset. As far we know, in any clustering algorithm, the right number selection of the clusters is an important task. The selection of number needs to be performed to provide the best quality for clustering. In EM algorithm, the maximization of likelihood is important for the Gaussian mixture model. Akaike Information Criterion (AIC), as a model selection approach, can be used for the maximization of likelihood (Pelleg and Moore, 2000). Accordingly, for the dataset used in this study, we have applied resubstitution AIC to select the value optimal number of cluster in EM algorithm. Additionally, 10-fold cross validation was applied in the clustering procedure to obtain unbiased result. Hence, as we used resubstitution AIC estimate to choose the value optimal number of cluster, we need to test the number of clusters from n=1 to
n=m, in which for n>m, the criterion value be always increased. As can be seen in Fig. 2, we found the minimum criterion value for n<10 and, accordingly, we decided
m=10 for obtaining optimal criterion value.
Number of
Clusters Criterion Diagram
1 54688.294685
`
2 56421.983641
3 65250.508579
4 74528.319123
5 81399.110020
6 43608.040334
7 35911.983654
8 56431.323386
9 42513.354835
10 52118.214920
Fig. 2. Best cluster using EM algorithm for Mesothelioma dataset
Fig. 3.
Clusters generated EM
After clustering task using EM, we applied NB on each cluster for classification task. The results are shown in Table 2. By the use of NB, we could obtain linear models in the clusters. Obtaining the linear models from the data could help us to compare our method with other linear methods. From the results of applying NB on all clusters, we can form the
decision functions for prediction task. For example, using the result of Table 1, in the first cluster we can develop the following decision functions for Healthy and Mesothelioma classes as shown in the following equations.
F(Mesothelioma, X)= -269.013+59.00000×asbestos exposure+...+0.201444× C-reactive protein (CRP) (6) F(Healthy, X)= -282.496+61.68181×asbestos exposure+...+0.154421× C-reactive protein (CRP) (7)
1 2 3 4 5 6 7 8 9 10
0 2 4 6 8 10x 10
4
Number of Clusters
C
ri
te
ri
o
S
Table 1
The results of Naive Bayes classifier on the first cluster of EM
Descriptors Healthy (Class) Mesothelioma (Class)
Intercept -282.496 -269.013
Asbestos exposure 61.68181 59.00000
Type of MM 0.000000 0.000000
Duration of asbestos exposure 0.190384 0.191128
Diagnosis method 0.000000 0.000000
Keep side 2.061740 2.941851
Cytology 1.638349 0.738229
Duration of symptoms 0.184166 0.178367
Dyspnoea 5.001427 4.798003
Ache on chest 2.231384 2.633310
Weakness 2.717623 2.993324
Habit of cigarette 0.820114 0.611066
Performance status 61.68181 59.00000
White blood 0.000746 0.000700
Cell count (WBC) 0.844608 0.787525
Hemoglobin (HGB) 1.517897 1.612176
Platelet count (PLT) 0.021113 0.017186
Sedimentation 0.103172 0.110304
Blood lactic dehydrogenise (LDH) 0.067453 0.068434
Alkaline phosphatise (ALP) 0.294541 0.278804
Total protein 13.80328 13.09070
Albumin 15.25753 15.29556
Glucose 0.042885 0.037588
Pleural lactic dehydrogenise 0.022872 0.021982
Pleural protein 0.481883 0.489446
Pleural albumin 0.818182 0.918406
Pleural glucose 1.177546 1.152190
Dead or not 59.00000 60.59459
Pleural effusion 1.665542 2.235809
Pleural thickness on tomography 1.215950 1.004480
Pleural level of acidity (ph) 0.834563 1.378844
C-reactive protein (CRP) 0.154421 0.201444
4. Performance evaluation of method
This section provides the experimental results of Mesothelioma’s disease classification with NB using Mesothelioma dataset. In addition, comparison experiments with other methods in the literature are performed.
The models of classification were trained under a 4 GHz processor PC and Microsoft Windows 7 running MATLAB 7.10 (R2010a). To show the predictive accuracy of the proposed methods, we use AUC (Area Under Curve) of ROC (Receiver Operating Characteristic) chart. ROC is a graphical display that provide the measure of classification accuracy of the model using sensitivity and specificity (Yu et al., 2010). For predicting events, Sensitivity in ROC can be used as a measure of accuracy which can be calculated by dividing the true positive over total actual positive. For predicting nonevents, Specificity is can be used as a measure of accuracy which can be calculated by dividing true negative over the total actual negative of a classifier for a range of cutoffs.
We compare the accuracy of our proposed method with the classification accuracy of the methods Support Vector Machine (SVM), Linear Discriminant Analysis (LDA), and K-Nearest Neighbors (KNN) for Mesothelioma dataset.
The performance of the classifiers (AUC values) that were compared with our method (EM-NB) is shown in Table 2. From the results shown in this table, our proposed method proves to have a better accuracy (93.21%) in relation to the other classification systems. Compared to SVM (87.53%), LDA (83.81%), CART (81.19%) and KNN (76.34%), our classification, clustering and noise removal techniques help to improve the classification accuracy of Mesothelioma’s disease by more than 5.68%, 9.4%, 12.02% and 16.87%, respectively. This shows the effectiveness of incorporating the clustering technique for the classification accuracy of Mesothelioma’s disease.
Table 2
Comparison of proposed method with other classifiers for Mesothelioma dataset
Method Accuracy
KNN 76.34%
CART 81.19%
LDA 83.81%
SVM 87.53%
5.
Conclusionand future work
In this paper, we investigated the use of NB and EM for accuracy improvement of Mesothelioma’s disease classification using. We applied EM clustering algorithm to cluster the experimental Mesothelioma’s disease dataset and NB for classification of disease types. In order to analyse the effectiveness of the proposed method and validate the system, several experiments were conducted on Mesothelioma dataset. The dataset was taken from Data Mining Repository of the University of California, Irvine (UCI). The results indicated that the method which combines clustering and NB obtain better classification accuracy in relation to the other classifiers. All of the approaches used in this study may also be applicable to other classification problems within the medical domain. However, there is still plenty of work in conducting researches algorithms using clustering and classification for Mesothelioma disease diagnosis in order to exploit all their potential and usefulness. In the future work, more attention should be paid to the datasets for disease classification using the incremental machine learning approaches and consider other clustering techniques and combine with the NB for disease classification. Also, future study may evaluate the proposed method on additional datasets and in particular on large datasets to show the effectiveness of the method on computation time of large data.
References
Ahmadi Far, A. (2016). A New Method for Breast Cancer Diagnosis Using Neural Network and Genetic Algorithms. Journal of Soft Computing and Decision Support Systems, 3(5), 47-49.
Akben, S. B., Tuncel, D., & Alkan, A. (2016). Classification of multi-channel EEG signals for migraine detection. Biomedical Research, 27(3). Babu G. S., & Suresh S. (2013). Parkinson’s disease
prediction using gene expression–A projection based learning meta-cognitive neural classifier approach. Expert Systems with Applications, 40(5), 1519-1529. Bermejo, P., Gámez, J. A., & Puerta, J. M. (2014).
Speeding up incremental wrapper feature subset selection with Naive Bayes classifier. Knowledge-Based Systems, 55, 140-147.
Bhardwaj, A., & Tiwari, A. (2015). Breast cancer diagnosis using genetically optimized neural network model. Expert Systems with Applications, 42(10), 4611-4620. Chen, C. H. (2014). A hybrid intelligent model of
analyzing clinical breast cancer data using clustering techniques with feature selection. Applied Soft Computing, 20, 4-14.
Cheung, M., Talarchek, J., Schindeler, K., Saraiva, E., Penney, L. S., Ludman, M., & Testa, J. R. (2013). Further evidence for germline BAP1 mutations
predisposing to melanoma and malignant
mesothelioma. Cancer genetics, 206(5), 206-210.
Crown, W. H. (2015). Potential application of machine learning in health outcomes research and some statistical cautions. Value in Health, 18(2), 137-140. Dempster, A. P., Laird, N. M., & Rubin, D. B. (1977).
Maximum likelihood from incomplete data via the EM algorithm. Journal of the royal statistical society. Series B (methodological), 1-38.
Er, O., Tanrikulu, A. Ç., & Abakay, A. (2015). Use of artificial intelligence techniques for diagnosis of
malignant pleural mesothelioma. Dicle Tıp
Dergisi, 42(1).
Gemba, K., Fujimoto, N., Aoe, K., Kato, K., Takeshima, Y., Inai, K., & Kishimoto, T. (2013). Treatment and survival analyses of malignant mesothelioma in Japan. Acta Oncologica, 52(4), 803-808.
Hariharan M., Polat K., & Sindhu R. (2014). A new hybrid intelligent system for accurate detection of Parkinson's disease. Computer methods and programs in biomedicine, 113(3), 904-913.
Hruschka, E. R., & Ebecken, N. F. (2006). Extracting rules from multilayer perceptrons in classification problems: a clustering-based approach.Neurocomputing, 70(1), 384-397.
Iacono, M. L., Monica, V., Righi, L., Grosso, F., Libener, R., Vatrano, S., ... & Papotti, M. (2015). Targeted next-generation sequencing of cancer genes in advanced stage malignant pleural mesothelioma: a retrospective study. Journal of thoracic oncology, 10(3), 492-499. Jung, Y. G., Kang, M. S., & Heo, J. (2014). Clustering
performance comparison using K-means and
expectation maximization algorithms. Biotechnology & Biotechnological Equipment, 28(sup1), S44-S48. Karabatak, M. (2015). A new classifier for breast cancer
detection based on Naïve Bayesian. Measurement, 72, 32-36.
Lanphear, B. P., & Buncher, C. R. (1992). Latent period for malignant mesothelioma of occupational origin. Journal of Occupational and Environmental Medicine, 34(7), 718-721.
Li, T., Deng, Q., Li, Y., Zhang, J., Sun, Y., & Gu, X. (2015). Data mining based on statistical analysis of Chinese Traditional Setting-up exercise on healthy undergraduate students. Biomedical Research, 26(1). Maghooli, K., Langarizadeh, M., Shahmoradi, L.,
Habibi-koolaee, M., Jebraeily, M., & Bouraghi, H. (2016). Differential Diagnosis of Erythmato-Squamous Diseases Using Classification and Regression Tree. Acta Informatica Medica, 24(5), 338.
Marcano-Cedeño, A., Quintanilla-Domínguez, J., & Andina, D. (2011). WBCD breast cancer database classification applying artificial metaplasticity neural network. Expert Systems with Applications, 38(8), 9573-9579.
S
Moore, B. C. (1981). Principal component analysis in linear systems: Controllability, observability, and model reduction. Automatic Control, IEEE Transactions on, 26(1), 17-32.
Nilashi, M. (2016e). An Overview of Data Mining Techniques in Recommender Systems. Journal of Soft Computing and Decision Support Systems, 3(6), 16-44. Nilashi, M., Ahmadi, H., Shahmoradi, L., Mardani, A., Ibrahim, O., & Yadegaridehkordi, E. (2017e). Knowledge Discovery and Diseases Prediction: A
Comparative Study of Machine Learning
Techniques. Journal of Soft Computing and Decision Support Systems, 4(5), 8-16.
Nilashi, M., Ahmadi, H., Shahmoradi, L., Salahshour, M., & Ibrahim, O. (2017c). A Soft Computing Method for Mesothelioma Disease Classification. Journal of Soft Computing and Decision Support Systems, 4(1), 16-18. Nilashi, M., bin Ibrahim, O., Ahmadi, H., & Shahmoradi,
L. (2017b). An Analytical Method for Diseases
Prediction Using Machine Learning
Techniques. Computers & Chemical Engineering, 106, 212-223
Nilashi, M., Dalvi, M., Ibrahim, O., Fard, K. B., Mardani, A., & Zakuan, N. (2017f). A Soft Computing Method for the Prediction of Energy Performance of Residential Buildings. Measurement, 109, 268-280.
Nilashi, M., Esfahani, M. D., Roudbaraki, M. Z., Ramayah, T., & Ibrahim, O. (2016d). A multi-criteria collaborative filtering recommender system using clustering and regression techniques. Journal of Soft Computing and Decision Support Systems, 3(5), 24-30. Nilashi, M., Ibrahim, O. B., Mardani, A., Ahani, A., &
Jusoh, A. (2016b). A soft computing approach for diabetes disease classification. Health Informatics Journal, 1460458216675500.
Nilashi, M., Ibrahim, O., & Ahani, A. (2016a). Accuracy Improvement for Predicting Parkinson’s Disease Progression. Scientific Reports, 6.
Nilashi, M., Ibrahim, O., Ahmadi, H., & Shahmoradi, L. (2017a). A Knowledge-Based System for Breast Cancer Classification Using Fuzzy Logic Method. Telematics and Informatics. 3(5), 133–144
Nilashi, M., Ibrahim, O., Ahmadi, H., Shahmoradi, L., & Farahmand, M. (2018). A hybrid intelligent system for the prediction of Parkinson's Disease progression using machine learning techniques. Biocybernetics and Biomedical Engineering, 38(1), 1-15.
Nilashi, M., Ibrahim, O., Dalvi, M., Ahmadi, H., & Shahmoradi, L. (2017d). Accuracy Improvement for Diabetes Disease Classification: A Case on a Public
Medical Dataset. Fuzzy Information and
Engineering, 9(3), 345-357.
Nilashi, M., Salahshour, M., Ibrahim, O., Mardani, A., Esfahani, M. D., & Zakuan, N. (2016c). A New Method for Collaborative Filtering Recommender Systems: The
Case of Yahoo! Movies and TripAdvisor
Datasets. Journal of Soft Computing and Decision Support Systems, 3(5), 44-46.
Pelleg, D., & Moore, A. W. (2000, June). X-means: Extending K-means with Efficient Estimation of the Number of Clusters. In ICML (pp. 727-734).
Polat, K. (2012). Classification of Parkinson's disease using feature weighting method on the basis of fuzzy C-means clustering. International Journal of Systems Science, 43(4), 597-609.
Sekido, Y. (2008). Molecular biology of malignant mesothelioma.Environmental health and preventive medicine, 13(2), 65-70.
Shahmoradi, L., Langarizadeh, M., Pourmand, G., & Borhani, A. (2016). Comparing Three Data Mining Methods to Predict Kidney Transplant Survival. Acta Informatica Medica, 24(5), 242.
Sheikhpour, R., Sarram, M. A., & Sheikhpour, R. (2015).
Particle swarm optimization for bandwidth
determination and feature selection of kernel density estimation based classifiers in diagnosis of breast cancer. Applied Soft Computing.
Spugnini, E. P., Bosari, S., Citro, G., Lorenzon, I., Cognetti, F., & Baldi, A. (2006). Human malignant mesothelioma: molecular mechanisms of pathogenesis and progression. The international journal of biochemistry & cell biology, 38(12), 2000-2004. Suzuki, Y. (1981). Pathology of human malignant
mesothelioma. Semin Oncol, 8(3), 268-282.
Testa, J. R., Cheung, M., Pei, J., Below, J. E., Tan, Y., Sementino, E., ... & Hesdorffer, M. (2011). Germline
BAP1 mutations predispose to malignant
mesothelioma. Nature genetics, 43(10), 1022-1025. Wu, C. J. (1983). On the convergence properties of the EM
algorithm. The Annals of statistics, 95-103.
Yu, W., Liu, T., Valdez, R., Gwinn, M., & Khoury, M. J. (2010). Application of support vector machine modeling for prediction of common diseases: the case of diabetes and pre-diabetes. BMC Medical Informatics and Decision Making, 10(1), 16.