Computer-Aided Diagnosis of Mammographic Masses Detection Of
Ascendable Images Features
1
Potala Ramanamma,2K.Dhilli
1
M.Tech-DECS,2Asst.Professor In Dept. Electronics & Communication Engineering.
1,2Avanthi Institute Of Engineering And Technology
Makavarapalem-Tamaram, Visakhapatnam Dist.
Abstract:
In any case, the vast majority of them miss the mark concerning adaptability in the recovery arrange, and their analytic precision is, accordingly, restricted. To beat this disadvantage, we propose a versatile technique for recovery and conclusion of mammographic masses specifically, for an inquiry
mammographic zone of interest (ROI), scale-in variation include transform(SIFT)features are removed and sought in a vocabulary tree, which stores all the quantized highlights of already analysed mammographic ROIs. Furthermore, to completely apply the discriminative energy of SIFT highlights, logical data in the vocabulary tree is utilized to refine
the weights of tree hubs.
Index Terms—Breast masses, computer-aided diagnosis (CAD), content-based image retrieval (CBIR), mammography.
Introduction
For years, breast cancer remains the second leading cause of cancer-related death among women [1]. Nevertheless, early diagnosis could improve the chances of recovery dramatically: the five-year relative survival rate rises from 24% when breast cancer is diagnosed at distant stage to 99% if it is diagnosed at localized stage [2]. Currently, among all the imaging techniques for breast examination, mammography is the most effective and the only widely accepted method, and it is recognized as a gold standard for breast cancer detection by the American Cancer Society (ACS) [1]the major indicators of breast cancer are masses and micro calcifications. Generally speaking,the detection of
mammographic masses is even more challenging than that of micro calcifications, since masses have
large variation in shape, margin, size,and are often in distinguish able from surrounding tissue[3], [4]. Moreover, even experienced radiologists have substantial interobserver and intra observer variability in their interpretation of mammograms [5]. Besides, they are often over whelmed by the enormous mammogram volume generated in wide spread screening [6]. Consequently, a considerable portion of retrospectively visible masses is missed by radiologists, and biopsies are frequently conducted on normal tissues [7]. Due to the clinical significance
and great challenge of mammo graphic mass detection, numerous computer-aided diagnosis (CAD) methods have been proposed to facilitate this procedure since the 1960s [8]. A majority of these approaches first segment a query mammogram into
several regions, then extract certain features from each region, and finally, classify these regions as
mass or normal tissue using the extracted features and pertained classifiers [3], [4], [6], [9],
[10].Mammograms are expected to be an ideal application of CBIR techniques [17], [18], since they depict a limited number of objects and have standard interpretation schemes, such as the breast imaging reporting and data system (BI-RADS)].
Name a ROI in the inquiry case, at that point contrast it and database ROIs separated from already analyzed cases, andfinally, restore the most comparable cases
no division is required. Third, they give more clinical proof to help the diagnos is Thorough examinations are led on this information set,demonstrating the efficacy of the introduced approach.
Related Work:
The recovery precision and effectiveness of a CBIR strategy depend vigorously on the embraced visual component. A decent component ought to acquire an exchange off between vigor to intra class fluctuation and discriminability to interclass distinction, and productivity of estimation and correlation. Visual highlights may portray different properties of either an entire picture or a neighborhood picture district, which are normally known as nearby highlights and worldwide highlights. Much of the time used properties incorporate shading, surface, shape, and spatial relationship. Among the various highlights, a neighborhood include named SIFT emerges credited to its incredible heartiness and discriminative power. High-dimensional neighborhood highlights, for example, SIFT are frequently quantized for quick recovery. A quantized neighborhood include is allude edoasa "visualword," which is a simple of "word" in content recovery, and a picture is portrayed by a "sack of words" (BoW). A BoW can be additionally spoken to as a histogram, which is viewed as a worldwide element amid ordering and likeness measure. The previous decade has seen numerous CBIR-based mammographic CAD techniques. For example, format coordinating is used to recover comparable mammographic ROIs, which are then used to decide if the inquiry contains a mass. This approach is quickened by limiting format coordinating to those database ROIs that offer comparable entropy esteems with the question ROI. With a specific end goal to find comparative
mammographic masses, highlights identified with surface, shape, and edge sharpness are embraced in , force, surface, and shape highlights are melded. For better visual likeness, clients are incited to rate the edge hypothesis of question ROI, and the framework just inquiries from database ROIs with comparative theory levels. This examination is additionally enhanced by expelling inadequately compelling ROIs from the database. A few works attempt to find
attributes, for example, shape, edge, and pathology. For instance, power, shape, and surface highlights are consolidated utilizing versatile weights, and client collaboration is abused to improve the recovery set. Shape and surface highlights from two perspectives [cranio-caudal (CC) and medio sidelong sideways (MLO)] are intertwined, and the recovered masses are then used to comment on the inquiry mass. A mass ROI is first curvelet changed, and afterward, described by its negligible curvelet subband conveyance. To find comparative microcalcification
groups that are steady with human recognition, a closeness learning plan is proposed to foresee radiologists' perceptions. Highlights identified with force, surface, shape, and granulometric measures are utilized to recover mammograms with comparable tissue sythesis. As of late, Liuetal. present dashing-based adaptable picture recovery to determination of mammographic masses. Specifically, grapple
diagram hashing (AGH) is utilized to pack two highlights, histogram of SIFT BoW and a worldwide element named GIST into minimized paired codes, and similitude seek is performed in Hamming space.
Proposed:
In this area, wefirst present our mammographic ROI
recovery structure in light of vocabulary tree, at that point introduce the refinement on the weights of tree
hubs, andfinally, depict how to settle on an analytic
choice utilizing the recovery set. The outline of our approach is appeared in Fig. 1.Mammogram Retrieval with a Vocabulary Tree Our approach expands upon a prominent CBIR system that lists nearby picture highlights utilizing vocabulary tree and transformedfiles. The nearby component we pick
here is SIFT. Briefly speaking, SIFT highlights are
extricated in four stages. In the first place, scale-invariant key focuses are identified byfinding nearby
extre primary the DoG space. Second, the precise area and size of each key point are resolved utilizing model fitting, and those key focuses with low
encompassing district is isolated into 4×4 sub locales, a 8-canister histogram of angle introductions in respect to the prevailing introduction is registered for every subregion, and all the 16 histograms are connected to shape a 128-D include vector. The a for said technique is outlined so that the removed SIFT highlights are invariant to interpretation, revolution, scale, a considerable scope of affine bending,
perspective/light change,and clamor expansion. Filter is additionally exceptionally discriminative, i.e., a solitary element can be effectively coordinated from a vast database of highlights. The remarkable heartiness and discriminative power sling SIFT and its varieties to the highest point of nearby component execution rankings [27]. Normally, the SIFT family are broadly embraced by various general picture.
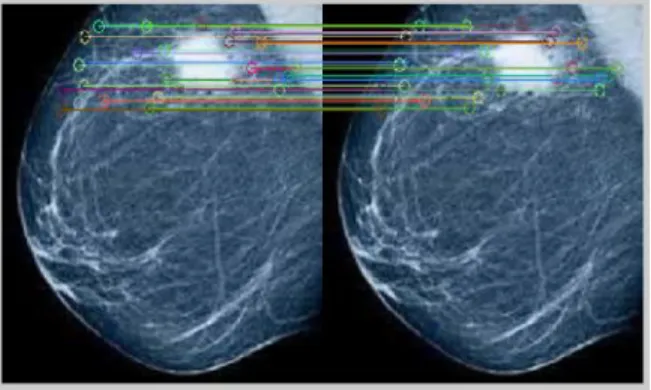
Fig. 2. Matching SIFT features using exhaustive search
In image retrieval, a straight forward way to match SIFT features would be exhaustive search. Specifically, aquery SIFT eature is matched with all
the database features, and the database feature with minimum Euclidean distance is identified as the best
match
S(q,d)= (1)
To prune false matches, the second closest database feature is also found, and the ratio of the second-shortest distance to second-shortest distance, referred to as
“uniqueness,” can be calculated.
Sp ( , )= (2)
Correct matches are expected to have higher uniqueness. An example is given in Fig.2, which also demonstrates the remarkable robustness and discriminability of SIFT features.
How ever, exhaustive search of SIFT feature is extremely time consuming there fore it cannot be conducted in large-scale retrieval. To over come this problem, we adopt vocabulary tree and invertedfiles
to quantize and index SIFT features
w(v)=idf(v) = log (3)
In this frame work, a large set of SIFT features extracted from a separate database are used to train a vocabulary tree through hierarchical k-means clustering. The process is illustrated in Fig. 3. Specifically, k-means algorithm is first run on the
entire training data, defining k clusters and their
centers. It is then recursively applied to all the clusters, splitting each cluster into k sub clusters. After L recursions, a vocabulary tree of depth L and branch factor k is built. Each tree node corresponds to a cluster center, and is commonly referred to as
“visual word
After the retrieval stage, aquery mammographic ROI is classified according to its best matched database
ROI suing majority logic. Currently, our aimis to distinguish between mass and normal tissue. Malignant and benign masses are not discriminated, since they could be visually in distinguishable and need to be diagnosed through other methods such as biopsy. Formally speaking, let {di}K i=1 denote the top K similar database ROIs for q, each di has a class tag c(di)∈{⊕ ,},with the label ⊕ for mass and for normal tissue. Q is classified by a weighted majority
vote of{di}K
Results:
First of all, retrieval precision is evaluated, which is defined as the percentage of retrieved database ROIs
Fig.3.Visually enhanced mammogram
Fig.3 for visual assessment. The outcomes demonstrate that our techniques, particularly VocTree + Adapt Weight, outperform the thought about methodologies. Point by point comes about demonstrate that numerous wrong recoveries are because of the visual comparability between threatening masses and typical ROIs with brilliant centers and hypothesized edges. It is likewise outstanding that recovery precisions for typical areas are by and large higher than those for masses. A conceivable reason is that the database has more typical ROIs than masses; in this way it is simpler for an ordinary inquiry ROI to find comparable database
ROIs. Second, classification exactness is estimated,
which alludes to the level of question ROIs that are effectively classified. The classification correctnesses
at top K = 1, 5, and 20 recoveries are accounted for in Table II. By and by, our techniques reliably out play out the other two methodologies. What's more, the classification exactness is surprisingly better than the
recovery accuracy, since insignificant recoveries would not cause a misclassification as long as they
remain a minority of the recovery set. Particularly, VocTree + AdaptWeight accomplishes classification
precision as high as 90.8% at K = 5, which is quite tasteful.
Every one of the analyses prompt a few conclusions. 1) NMI acquires the worste sults among all the tried
isn't appropriate to coordinate two whole ROIs without extricating certain highlights from invariant key focuses. 2) Our strategy is better than BoW.
Conclusion:
Mammography has assumed a key part in the early determination of bosom malignancy. To encourage mammographic masses location, various CAD strategies are produced, and a developing number of them start to use CBIR methods. Contrasted and classifier-based methodologies, CBIR-based techniques can distinguish masses of unprecedented appearance or size, sidestep the dark mass limit issue, give more clinical proof, and enhance PACS frameworks. In any case, absence of versatility remains a noteworthy disadvantage of current CBIR-based CAD strategies and sets a point of confinement on the irretrieval exactness an offer as demonstrative precision.
Future end eavours will be dedicated to enhance recovery exactness. One conceivable arrangement is to use a few visual highlights. Specifically, force,
surface, and shape highlights can supplement the embraced SIFT include. The majority of the horse worldwide highlights and can be listed utilizing hash tables to accomplish sub straight comparability seek. With a specific end goal to join various highlights, existing strategies either link them to frame another element, or total individual recovery sets as indicated by likeness/distancescores or positions. How ever,these approaches utilize fixed or client defined
parameters, e.g., weight of each element in likeness count. Subsequently, they can't totally incorporate the qualities of corresponding highlights, which may function admirably for various types of inquiries. To conquer this issue, we can utilize highlight combination system, for example, chart combination that adaptively merges.Individual recovery sets through a connection investigation on an intertwined diagram. Furthermore, the proposed technique can be connected to other restorative spaces, for example, recovery and finding of knobs in lung CT pictures.
REFERENCES:
[2] N. Howlader, A. M. Noone, M. Krapcho, J. Garshell, N. Neyman, S. F. Altekruse, C. L. Kosary, M. Yu, J. Ruhl, Z. Tatalovich, H. Cho, A.Mariotto,D.R.Lewis,H.S.Chen,E.J.Feuer,andK.A.C ronin,SEER CancerStatisticsReview,1975-2010.NationalCancerInstitute,Bethesda, MD, USA, 2013.
[3] H.-D. Cheng,X.-J. Shi, R.Min, L.-M.Hu,X.-P.Cai, and H.-N.Du, “Approaches for automated detection
and classification of masses in mammograms,”
Pattern Recog., vol. 39, no. 4, pp.646–668, 2006.
[4] A.Oliver, J.Freixenet, J.Martı, E. Perez, J. Pont, E. R. E. Denton, and R. Zwiggelaar, “A review of
automatic mass detection and segmentation in mammographic images,” Med. Image Anal., vol.14,
no.2, pp.87–110,2010.
[5] P.Skaane, K.Engedal, and A.Skjennald, “Inter
observer variation in the inter pretation of breast
imaging,”Act a Radiol.,vol.38,no.4,pp.497–502,1997.
[6] R.M.Rangayyan, F.J.Ayres, and J.E.Leo Desautels, “A review of computer-aided diagnos is of
breast cancer:Toward the detection of subtle signs,”
J.Franklin Inst., vol.344, pp.312–348, 2007.
[7] R.L.Birdwell, D.M.Ikeda, K.F.O’Shaughnessy, and E.A.Sickles, “Mammographic characteristics of
115 missed cancers later detected with screening mammography and the potential utility of
computer-aided detection,” Radiology, vol. 219, no. 1, pp. 192–
202, 2001.
[8] F.Winsberg, M.Elkin, J.Macy, V.Bordaz, and
W.Weymouth, “Detection of radiographic
abnormalities in mammograms by means of optical
scanning and computer analysis,” Radiology, vol. 89,
no. 2, pp. 211–215, 1967.
[9] J. Tang, R. M. Rangayyan, J. Xu, I. El Naqa, and
Y. Yang, “Computer aided detection and diagnos is
of breast cancer with mammography: Recent
advances,” IEEE Trans. Inf. Technol. Biomed.,vol.13,no.2,pp.236–251, Mar. 2009.
[10] K.Ganesan, U.R.Acharya, C.K.Chua, L.C.Min, K.T.Abraham, and K.-H.Ng, “Computer-aided breast cancer detection using mammograms: A