Wired and Wireless Computer Network Performance Evaluation
Using OMNeT++ Simulation Environment
I
Dhobale J V,
IIDr. Kalyankar N V,
IIIDr. Khamitkar S D
IAssist. Professor, Shri. D B P C O M, Manur, Nashik (MH) IIPrincipal,Yeshwant College Nanded (MH)
IIIReader & Director, School of computational sciences, SRTMU, Nanded
I. Introduction
The Application areas of wired and wireless computer networks are different. The performance of the both these networks are investigated on the basis of common parameters to know how both these networks behave. The performance of the Network
configurations is measured using simulation environment. We
preferred OMNeT++ Version 4.2 (Objective Modular Network Testbed ) object oriented modular discrete event network simulation framework with INET framework for OMNeT++ with 2.2.0-ae90ecd release. OMNeT++ is primarily used to simulate the communication networks and other distributed systems. It is used for academic as well as Industrial research purposes. OMNeT++
runs on Windows, Mac & Linux Operating Systems. Here are
the features of OMNeT++ which makes it different from other simulation environment:
OMNeT++ is designed to support network simulation on a 1.
large scale. Modular structure. 2.
The design of NED (Network Description). 3.
GUI Interface with Graphical Editor. 4.
Separation of Model and Experiments.
5.
Simple Module Programming Model.
6.
Design of the Simulation Library.
7.
Parallel Simulation Support.
8.
Real-Time Simulation, Network Emulation.
9.
Animation and Tracing Facility. 10.
Visualization of Dynamic Behaviour. 11.
Enriched Result Analysis Mechanism 12.
INET consists of several simulation application models. We use Nclients network application with basic HTTP network setup from INET as wired network and Wireless Host to Host
network application with 802.11b Mac protocol in combination
is evaluated in terms of Server Throughput. Throughput from the
server is measured through ThruputFrom module while throughput to the server is evaluated through ThruputTo module. Throughput is number of bits transferred per second from server to the client or vice versa.
II. Related Work
Research paper Performance Analysis of DiffServ based Quality of Service in a Multimedia Wired Network and VPN effect using OPNET. In current paper Researchers presented simulation and performance analysis of Quality of Service (QoS) based on two major queuing disciplines i.e. Priority Queuing (PQ) and Weighted Fair Queuing (WFQ). Theanalysis was done in terms of delay and its variants for four different services; Voice over IP, Video Conferencing, Database and FTP based on packet identification under Differentiated Services Code Point (DSCP). The simulation results show that WFQ is a better discipline than PQ as lesser queuing delay and jitter were observed in WFQ for low priority services (FTP and Database). These metrics were found having same values in both PQ and WFQ for high priority services (Voice and Video). Therefore, low priority services also get their weighted share of bandwidth in the network when QoS is applied with WFQ
discipline in the presence of high priority services like interactive
voice and live streaming video. Voice and video traffic were further examined through simulation and discussion on ‘Traffic Drop’, Buffer Usage’ and ‘Packet Delay Variation’ metrics by varying router’s buffer size.
Research paper Performance Evaluation of Wireless Controller Area Network (WCAN) Using Token Frame Scheme proposed a
new wireless protocol so-called wireless controller area network is
introduced. WCAN is an adaptation of its wired cousin, controller area network protocol. The proposed WCAN uses token frame
scheme in providing channel access to nodes in the system. This
Abstract
With this research paper we are investigating the performance of wired and wireless computer networks using OMNeT++ Simulation environment. The performance of the Network is evaluated on the basis of Throughput. To investigate the problem we use OMNeT++ network simulation framework along with Nclient application module as wired simulation network and Wireless Host to Host application module as Wireless simulation network from INET framework. Both these modules support client server environment with variable number of clients. We have kept data packet size constant i.e 1000bytes for both networks.
Keywords
bounded latency environment. The proposed WCAN protocol has been developed and simulated by means of QUalNet simulator.
The performances of this proposed protocol are evaluated from the
perspective of throughput, end-to-end delay and packet delivery ration, and are compared against the IEEE 802.11 protocol. Simulation result shows that the proposed WCAN outperforms
IEEE 802.11 based protocol by 62.5% in terms of throughput with
increasing network size. Also, it shows an improvement of 6%
compared to IEEE 802.11 standard at a higher data rate.
III. Research Methodology
To investigate the performance evaluation of wired and wireless
networks we use OMNeT++ Simulation environment framework. We run all these simulations on Windows 7.0 Professional platform on Laptop with AMD Athlon (tm) II P320 Dual-Core Processor 2.10 GHz with 3.00GB RAM and 32-bir Operating System. Wired network simulation experiment is setup with Nclient application
form INET. There are three basic setup provided under Nclients
in INET those TelenetApp, File transfer and basicHTTP module. Out of these we choose basicHTTP module with TCPBasicCliApp and TCPGenericSrvApp modules. TelenetApp generates very low traffic.
Fig. 1: Nclients.Ned: Client Server experimental setup configuration
To measure the performance of the present network we use
thruputMeter modules. This module is placed between TCP and TCPApp layer. We required two modules to collect result for incoming and outgoing traffic to the server. Our client and server are the StandardHost modules provided in the INET. We have modified the StandardHost with thruputMeter. Modified structure of standardHost along with thruputMeter is show in figure 2 below.
Fig. 2: StandardHost with thruputMeter module between tcp &
tcpApp
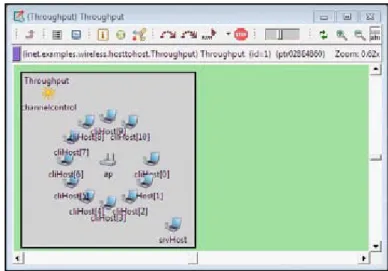
Wireless network Simulation experiment is setup with Wireless – Host to Host application from INET. We setup up our wireless Host to Host network configuration in circular mobility configuration
with 1mps mobility speed. The host and the access point transmitter
powers are configured so that every host hears all the others
Fig. 3: Wireless - Host to Host Network configuration with 11-clients Host, 1-Access point & a server Host setup.
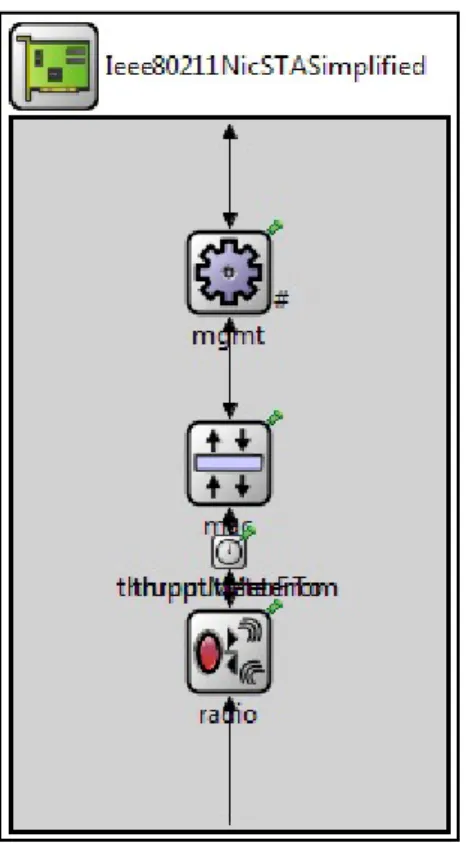
It consists of 802.11b MAC protocol in combination with the Ieee80211Radio module as the physical layer. It clubbed to form
Ieee80211NicSTASimplified module in INET. We modified this
module by adding two throughput meters to measure in and out throughput value between mac and radio modules. Throughput
from Server host is measured using throughputFrom and throughput
to the server host is measured using throughputTo module. The
Fig. 4 : Ieee80211NicSTASimplified with two throughput
meter.
The results of the experiments are collected in excel file from the default .ans file. .ans file in OMNeT++ gives two types of
results vector and scalar. Vector results are recording of time series data and scalar results are supposed to record a single value per
simulation run. We have considered scalar result as avg. thruput for our analysis purpose, Throughput of both thruputMeter i.e. thruputFrom & thruputTo related to the server.
To evaluate the performance of both these networks we considered two parameters:
Datarate (bitrate in wirelsee networks). 1.
Number of clients per server. 2.
We collect the readings of the simulation experiment by two
ways:
We Kept datarate/bitrate constant and changed the number
1.
of clients on the server and average throughput scalar values
are collected for respective experiments.
For specific number of clients setup on a server we change
2.
the datarate/bitrate and collect the scalar average throughput
values.
Unless and until specified all the parameters of INI and NED files for both experimental setups are kept at defaults. Throughput values of the server are collected by changing datarate/bitrate value from 10Mbps to 100Mbps with the interval of 10Mbps,
same way throughput of the server is also collected by changing
IV. Result Analysis
The result of the experiments are collected in excel file. We have collected Throughput results of server host at 10, 20, 30, 40, 50, 60, 70, 80, 90 & 100Mbps datarate/bitrate. With 1, 2, 3, ....,13,14,15
clients with server. Average throughput values from the serve and to the server given by two throughput meters for the set network
configurations are considered to measure the performance of
networks.
Throughput is the average number of bits transferred per second.
Packet size for all the experimental setup is kept constant i.e.
1000bytes.
At specific datarate/bitrate by changing number of clients hosts
from 1 to 15 numbers we took readings of server throughput i.e.
throughputfrom – outgoing throughput values from the server and
throughputto- incoming throughput values to the server. These reading are collected at 10Mbps to 100Mbps with the interval of 10Mbps.
The results of the experiments are analysed with respect to datarate/
bitrate and number of clients to the server.
A. With Constant Datarate/Bitrate
When we change number of clients with server at specific datarate from 1 client to 15 clients for both the network setups, we found
that throughput from the server for wired network is increasing with increase in the number of clients from 1 number to 14 number
of clients per server except number of clients with 6, 8, 12 &
15 where it shows downfall trend in the throughput from the server.
Fig 5: Graph showing throughput from server at 10MBPS for
is same for all the datarate interval experiments i.e. 10MBPS, 20MBPS, 30MBPS,..., 100MBPS.
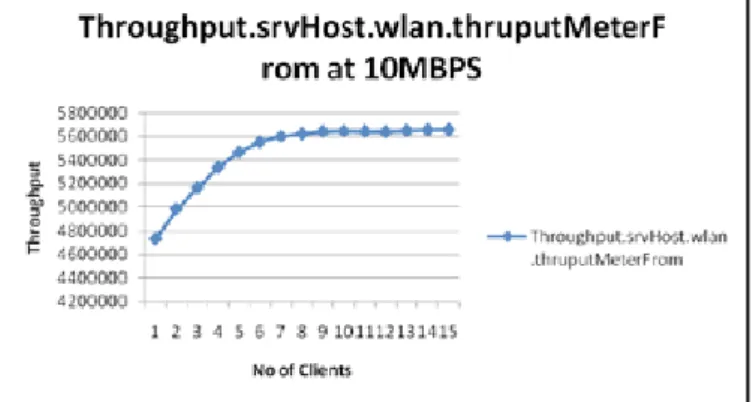
Similarly when we analysed the throughput from server host pattern of wireless network at specific bitrate we found that
throughput from server host is increasing with increase in the
number of client hosts at 10MBPS and 20MBPS;
Fig 7: Graph showing throughput from server host at 10MBPS for Wireless Host to Host network.
At 30MBPS it increase with increase in the number of client hosts
till 8 number of client hosts and from number of client hosts 9 onwards till 15 client hosts it shows very low throughput from the server.
Fig. 8: Graph showing throughput from server host at 30MBPS for Wireless Host to Host network.
Throughput Reading of the wireless Host to Host network at 40MBPS, 50MBPS, ... till 100MBPS shows that throughput from
the server is high with very less number of client hosts i.e. 2 to 3 client hosts with server host and it shows very low throughput from server for increased number of client hosts.
Fig. 9: Graph showing throughput from server host at 100MBPS for Wireless Host to Host network.
After analysis of throughput to the server pattern for wired and
wireless network at specific datarate/bitrate with variable number
of clients per sever we found totally opposite behaviour in the wired and wireless networks:
For Nclients wired network throughput to the server is increasing steadily with increase in the number of clients per server at all the datarate intervals.
Fig 10: Graph showing throughput to the server at 10MBPS for
Nclient wired network
For Wireless Host to Host network throughput to the server hosts
is decreasing steadily with increasing inn the number of client hosts with the server host at all the bitrate intervals.
Fig 11: Graph showing throughput to the server host at 100MBPS for Wireless Host to Host network.
B. With Constant Number of Clients
Now we analyse the trend of throughput for specific number clients with server by changing datarate/bitarte.
Analysis shows that throughput from the server for specific
number of clients is increasing with increase in the datarate for wired networks.
Fig 12: Graph showing throughput from the server with 1 client per server for Nclient wired network.
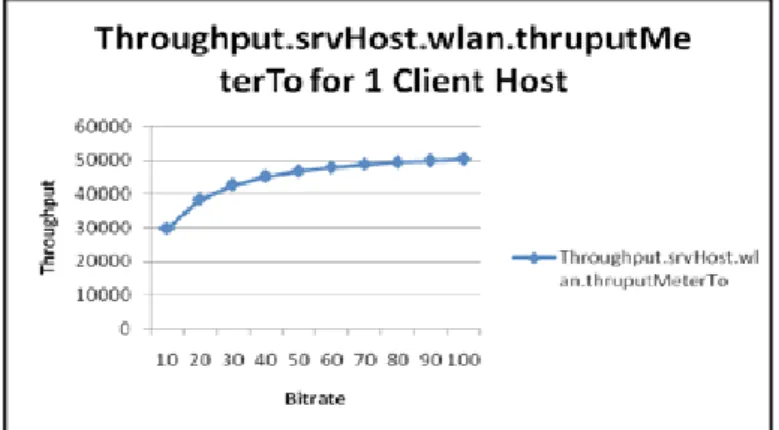
Wireless Host to Host to network throughput from the server host for specific number of client host with the server host is
increasing with increase in the bitrate for number of client hosts 1 and 2 with server host;
Fig 13: Graph showing throughput from server host with 1 client
host for Wireless Host to Host network.
For number of client hosts 3 to 15 with server hosts, the throughput from the server pattern for wireless Host to Host network is high
with less number of bitrate and it gives low throughput from the serve with increase in the bitrate.
Fig 14: Graph showing throughput from server host with 15 client
hosts for Wireless Host to Host network.
Throughput to the server for specific number of clients for wired network is increasing with increase in the datarate, this trend is
common for all number of clients with server.
Fig 16: Graph showing throughput to the server host with 1 client
host for Wireless Host to Host network.
V. Conclusions
By analysing the throughput values of the simulation experiment
for both wired and wireless network we came to know that The throughput pattern behaviour of both the networks are different
for evaluated parameters except throughput patter to the server
with constant number of clients.
VI. AcknowledgEment
We are thankful to all the staff of School of Computational Sciences, SRTMU, Nanded for providing us the necessary guidance and
facility to carry out present research.
References
[1] Muhammad Aamir, Mustafa Zaidi and Husnain Mansoon, “Performance Analysis of DiffServ based Quality of Service in a Multimedia Wired Network and VPN effect using OPNET”. International Journal of Computer Science Issues, Vol. 9, Issue 3, No 2, May 2012.
[2] Wei Lun Ng, Chee Kyun Ng, Borhanuddin Mohd Ali, Nor Kamariah Noordin, “Performance Evaluation of Wireless Controller Area Network (WCAN) Using Token Frame Scheme”. Wireless Pers Commun (2013) 72: 1847-1873. [3] Mr. Dhobale J V, Dr. Kalyankar N V, Dr. Khamitkar S D,
“Computer Network Performance Evaluation based on Datarate and Number of Clients per server using OMNeT++ Simulation”. Global Journal of Computer Science and Technology, Volume 14 issue 3 June-2014.
[4] Mr. Dhobale J V, Dr. Kalyankar N V, Dr. Khamitkar S D, “Wireless-Host to Host Network Performance evlaution based on bitrate and Number of Host with server using OMNeT++ Simulation Environment”. Indian Stream Reserach Journal, June-2014 (2230-7850) accepted.
[5] Esma Yildirim – Tevfik Kosar, “End-to-end data flow parallelism for throughput optimization in High Speed Networks,” J Grid Computing (2012) 10:395-418.
[9] INET Framework for OMNeT++ Manual
Author’s Profile
Dr. Kalyankar N. V.: Principal, Yeshwant Mahavidyalaya, Nanded. Author is recognised Ph.D. guide of SRTMU, Nanded in the subject of Computer Science and Physics. He is having 69 Research Paper publications in various international journals along with 2 books. He has chaired number of International and national conferences during his 33 years of services. His area of interest is Networking, Cyber security & Image Processing. He is Fellow and member of various International and National Research organizations.
Dr. Khamitkar S. D.: Reader & Director, School of Computational Sciences, Swami Ramanand Teerth Marathwada University, Nanded. Author is Renowned Ph.D. guide in the subject of Computer Science. He is having 14 years of PG teaching experience and has 16 international Research publications under his belt. Currently he is guiding 11 Research Scholars for Ph. D. Programme. His area of interest is Networking & Image Processing. Author has chaired various national and International conferences and also Research and academic committees at SRTM University, Nanded.
Mr. Dhobale J. V.: Assistant Professor, Shri. Dhondu Baliram Pawar College of Management & Research Scholar Swami Ramanad Teerth Marathawada University Nanded. Author has completed his M.Sc. (Computer Applications) in 2001 and started his carrier as Lecturer. In 2010 he has completed his MBA degree with Marketing Specialization. He is having 13 years of UG & PG teaching experience. During his tenure of services he has published 15 national and international Research papers in the area of Computers science and Management. Currently he is pursuing Ph. D. degree from SRTM University, Nanded. His area of interest is Computer Networks.