RESPONSE OF RIVER COASTAL MARGINS TO HUMAN INDUCED VARIATIONS IN SEDIMENT SUPPLY AND ACCELERATED SEA-LEVEL RISE
Anna Marta Jalowska
A dissertation submitted to the faculty of the University of North Carolina at Chapel Hill in partial fulfillment of the requirements for the degree of Doctor of Philosophy
in the Department of Marine Sciences.
Chapel Hill 2016
Approved by: Brent A. McKee Antonio B. Rodriguez
Jaye Cable Richard Miller
© 2016
ABSTRACT
Anna M. Jalowska: Response of River Coastal Margins to Human Induced Variations in Sediment Supply and Accelerated Sea-Level Rise
(Under the direction of Brent A. McKee and Antonio B. Rodriguez)
My dissertation emphasizes that human-induced modifications to riverine sediment budget and changes in the rate of sea-level rise strongly influence bayhead-delta evolution. The response of bayhead deltas to these alterations is difficult to predict, but important to understand because they can lead to submergence and erosion of deltaic environments and loss of important habitat. Floodplains and the bayhead delta of the Lower Roanoke River, NC have the largest, most pristine bottomland hardwood forest ecosystem remaining in the mid-Atlantic region. The majority of this ecosystem is currently at 0 m above sea level (MASL) and is very vulnerable to sea-level rise and changes in sediment supply. The Lower Roanoke River has been impacted by human activities (land clearing followed by river damming), and climate change. Using
multidisciplinary tools, I was able to reconstruct the geological history of the Roanoke Delta (core descriptions and radiocarbon and 210Pb geochronologies), and define sources, fates and pathways of suspended sediments in the floodplains and delta environments on seasonal
(radionuclide based sediment fingerprinting) and decadal to monthly (210Pb geochronology) time scales.
sediments until the 17th century. During the 1600s, when the first European settlers began to clear forest and farm the drainage basin, the delta rapidly accreted and the interdistributary bay filled with legacy sediment from increased agricultural runoff. The regression was also
facilitated by the low rates of sea-level rise until ca 1860AD. The second episode of bayhead-delta retreat started during the 19th century and continues today. Improved agricultural practices and dam construction decreased the amount of sediment delivered to the bayhead delta.
Additionally, the rate of sea-level rise increased to 0.21 cm/yr at that time. Under these
conditions, the delta entered an erosional phase and during 1954–2012, the rate of delta loss was 2469 m2/yr. Decreases in sediment supply and more frequent inundations associated with the sea-level rise, led to a dramatic change in the function of delta plains. My research shows that at a 0 MASL elevation, the frequency and extent of flooding control erosion and deposition in the delta plain, and lead to loss of their ability to retain sediments. Hence, delta plains, regarded to be sediment sinks and sites of long-term sediment storage, become a source of sediment to the upper delta, as sea level rises and the delta retreats. This mechanism exposes a unique
distribution of sediments in eroding deltas. In contrast to the previous paradigm emphasizing a unidirectional seaward dispersal of eroded deltaic sediments during transgression, my research illustrates that a landward-directed sediment migration pathway could occur, allowing
ACKNOWLEDGEMENTS
I would like to express my special appreciation and thanks to my advisors Dr. Brent McKee and Dr. Antonio Rodriguez, you have been tremendous mentors for me. I would like to thank you for encouraging my research and for allowing me to grow as a research scientist. Your advice on both research as well as on my career have been priceless. I would also like to thank my committee members: Dr. Jaye Cable, Dr. Richard Miller Dr. Brian White, and Dr. J. Patrick Laceby, for your time, brilliant comments and suggestions. I would especially like to thank my colleagues: John Biddle, Emily Elliot, Sherif Ghobrial, John Gunnell, Kristen Jarman, Robin Mattheus, Samuel Perkins, Ethan Theuerkauf, Patricia Rodriguez and the awesome
undergraduate students I had a pleasure to mentor: Christiana Ade, Anna Atencio, Wayne Capps, Olivia Henley, Shelby Marshall, Katie McCabe, Gráinne O'Grady, Joseph Roberts, Lauren Speare, Alexander Stephan, and Danielle Wingler for your help with lab and field work.
TABLE OF CONTENTS
LIST OF TABLES ... xii
LIST OF FIGURES ... xiii
LIST OF ABBREVIATIONS ... xvii
INTRODUCTION ... 1
CHAPTER 1: RESPONSES OF THE ROANOKE BAYHEAD DELTA TO VARIATIONS IN SEA LEVEL RISE AND SEDIMENT SUPPLY DURING THE HOLOCENE AND ANTHROPOCENE ... 4
1.1 Abstract ... 4
1.2 Introduction ... 5
1.3 Study Area ... 7
1.3.1. Geologic Settings. ... 8
1.3.2. Roanoke River. ... 10
1.3.3. Roanoke Bayhead Delta. ... 11
1.3.4. Anthropogenic Footprint. ... 12
1.4 Methods... 13
1.4.1 Cores. ... 13
1.4.2. Grain Size... 14
1.4.3. Radiocarbon dating. ... 14
1.4.4. 210Pb geochronology. ... 17
1.4.6. Maps and aerial photography. ... 17
1.5 Results and Interpretation. ... 18
1.5.1 Depositional Environments. ... 18
1.5.2. Stratigraphy ... 25
1.5.3 210Pb geochronology ... 27
1.5.4 Historical Shoreline Changes. ... 30
1.6. Discussuion ... 31
1.6.1. Holocene Delta Evolution. ... 31
1.6.2. Recent Anthropocene Delta Evolution. ... 33
1.7. Conclusions ... 35
CHAPTER 2: CONTROLS ON DEPOSITIONAL AND EROSIONAL EVENTS IN THE MODERN DELTA PLAIN OF RETREATING BAYHEAD DELTA ... 37
2.1 Abstract ... 37
2.2 Introduction ... 38
2.3 Background ... 40
2.3.1 Study Area. ... 40
2.3.2 Site description... 42
2.4 Methodology ... 45
2.4.1 Elevation. ... 45
2.4.2 Sample collection and radionuclide analyses. ... 45
2.4.3 Inventories and Sediment Accumulation. ... 47
2.4.4 Feldspar Clay Marker Horizons. ... 50
2.4.5 Weather and Water Level Data. ... 50
2.4.7 Cartographic information. ... 52
2.5 Results ... 52
2.5.1 Elevation. ... 52
2.5.2 Inundations and wind data. ... 53
2.5.3 Total Suspended Matter (TSM). ... 57
2.5.4 Mass Accumulation. ... 58
2.5.5 Feldspar. ... 63
2.5.6 Relationship between accretion and erosion events and length of inundations. ... 64
2.5.7 Relationship between accretion and erosion events and seasonality. ... 66
2.6 Discussion ... 67
2.6.1 Variations in sediment deposition and erosion. ... 67
2.6.2 Hydrologic and atmospheric drivers of depositional and erosional events. 69 2.7 Conclusions ... 70
CHAPTER 3: TRACING SUSPENDED RIVER SEDIMENT INDICATES THAT RECYCLING OF THE DELTAIC SEDIMENTS IS AN IMPORTANT PROCESS DURING TRANSGRESSION ... 72
3.1 Abstract ... 72
3.2 Introduction ... 73
3.3 Background ... 76
3.3.1 Study Area. ... 76
3.3.2 Sediment fingerprinting approach... 80
3.4 Methodology and Sampling ... 82
3.4.1 GIS Analyses, Stream Data and Total Suspended Sediment. ... 82
3.4.3 Grain-size Distribution and Side Scan Sonar Data. ... 86
3.4.4 Radionuclide Analyses... 87
3.4.5 Mixing Model. ... 87
3.5 Results ... 89
3.5.1 GIS analyses, Stream Data and Total Suspended. ... 89
3.5.2 Grain-size distribution and in-channel sedimentation. ... 91
3.5.3 Sediment Fingerprinting. ... 92
3.6 Discussion ... 97
3.7 Conclusions ... 101
APPENDIX ... 103
LIST OF TABLES
Table 1. Radiocarbon dates. ... 15
Table 2. Excess 210Pb inventories and sedimentation rates. ... 28
Table 3. Relationships between inundations and depositional and erosional events ... 65
Table 4. Mean accumulation rates during the study period at each station. ... 68
Table 5. Land use in the Lower Roanoke River. ... 82
Table 6. Discharges, water level data and correlation with dam releases during sampling period. ... 83
Table 7. Sample location information including number of total suspended sediment concentration samples and channel width. ... 84
Table 8. Results of Mann-Whitney U-test. ... 94
LIST OF FIGURES
Figure 1. A. North Carolina geological provinces. B. Extent of the Roanoke Bayhead Delta (BHD) from Broad Creek - the first distributary channel- to the shoreline in Albemarle Sound. C. Elevation map of the study area and station locations. D. Bald cypress trees stranded in
Albemarle Sound. ... 8 Figure 2. Paleogeographic reconstructions of Eastern Albemarle Sound based on Culver et al. (2008). A. Flooded paleo-Roanoke Valley became an open embayment 5,000 years ago. B. Closing of the embayment via tidal inlet constriction and shallowing initiated ca. 1,000 years. C. The Roanoke Inlet was 2 meters deep in 1775AD, continued to shallow in 1822AD and closed by 1833AD. ... 9 Figure 3. Roanoke River discharge measured at Roanoke Rapids, NC (USGS 02080500). Since construction of the first dam (1947-1953), discharge has not exceeded 1000 m3/s (marked with a red line). The frequency of the 600 m3/s flow (blue line) increased six times since dam
construction. ... 13 Figure 4. Crossection of the study area in the Eastmost River, presenting stratigraphy,
depositional environments and flooding surfaces. Asterisks mark depths of radiocarbon-dated material expressed as averaged calibrated dates (95.4% probability) radiocarbon dates in
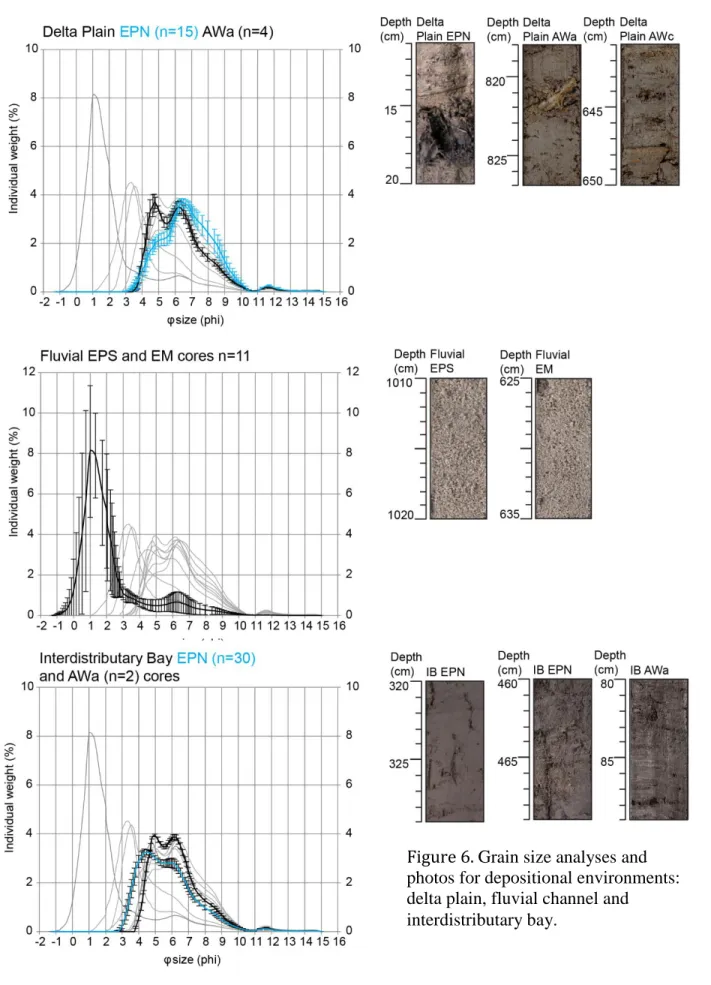
parenthesis. ... 19 Figure 5. Grain-size distribution with depth in core EPN shows a sharp transition between finer delta plain and coarser interdistributary bay units. Photos show the distribution of legacy sediments and contact between delta plain and interdistributary bay in core EPN. Grain-size distribution with depth in core AWc shows the upper sand bed and silty prodelta unit. Photos of core AWc show beds and laminae of red legacy sediment delivered to the prodelta during high-discharge events. Lower core photos show contacts between different sedimentary units
(abbreviations explained in Figure 4). ... 21 Figure 6. Grain size analyses and photos for depositional environments: delta plain, fluvial channel and interdistributary bay. ... 23 Figure 7. Grain size analyses and photos for depositional environments: prodelta, subaqueous point bar and modern erosional surface. ... 24 Figure 8. Holocene sea level points for North Carolina. Rates of sea-level rise and fall are
Survey, 1860; United States Coast Survey et al., 1864), from 1954 and 2012 aerial photography in blue (U.S. Geological Survey (USGS), 1954) and in black (U.S. Department of Agriculture (USDA), 2012), respectively. Position of submerged tree stumps imaged with the side-scan sonar
(inset) are marked with black dots on the map. ... 33
Figure 11. Conceptual model illustrating evolution of the bayhead delta in context with Albemarle Sound. A. Late Pleistocene, Early Holocene Paleo-Roanoke Valley during the Last Glacial Maximum ca. 18 kyr BP (in dark blue). In the study area, floodplain inundation only occurred during overbanking events. B. Holocene ca 4 kyr BC flooding of the study area and formation of the interdistributary bay. C. Early Anthropocene increase in sediment supply associated with land-use change, islands trapped sediment facilitating accretion. The delta reached its maximum extent ~1860AD. D. Recent Anthropocene Improved agriculture practices and installation of a series of impoundments in the watershed resulted in decreased sediment supply followed by erosion and bayhead delta back-stepping since late 1800’AD. The evolution of Albemarle Sound based on Culver et al., (2008), paleo-Roanoke channel in A based on Erlich,(1980)). ... 35
Figure 12. Roanoke Bayhead Delta and Sampling Stations. ... 41
Figure 13. Location of sampling station A. ... 43
Figure 14. Location of sampling station B. ... 44
Figure 15. Location of sampling station C. ... 44
Figure 16. 7Be fluxes by storm total precipitation from studies reporting event-based collections in the proximity to study area: coastal North Carolina (Canuel et al., 1990), northeastern Maryland (Karwan et al., 2014), Chesapeake Bay area (Kim et al., 2000), Oak Ridge, Tennessee (Olsen et al., 1985) and Norfolk, Virginia (Olsen et al., 1985; Todd et al., 1989) and from a Stillpond, MD (Kim et al., 2000). ... 49
Figure 17. Elevation of sampling stations. ... 52
Figure 18. Plots present inundation time series at each station with water level above 0 cm. ... 53
Figure 19. Total number of inundations per sampling site, and number of floods shorter and longer than 3 days. ... 54
Figure 20. Seasonal variations of inundation magnitudes (cm)at each station, with derived means and standard deviations (SD) provided under each plot. Spring: March, April, May (MAM), summer: June, July, August (JJA), fall: September, October, November (SON) and winter (DJF). ... 55
Figure 22. Total suspended matter concentrations at each station during the sampling period (mg/L). ... 57 Figure 23. Relationship between water level and concentration of the suspended sediment in the water column. ... 58 Figure 24. Seasonal mean suspended sediment concentrations at each site. ... 59 Figure 25. Mass accumulation in g/cm2 at sampling site A based on 7Be and 210Pb inventories. 60 Figure 26. Mass accumulation in g/cm2 at sampling site B based on 7Be and 210Pb inventories. 62 Figure 27. Mass accumulation in g/cm2 at sampling site B based on 7Be and 210Pb inventories. 63 Figure 28. Accretion of sediments on top of the feldspar horizon at stations A, B and C. ... 64 Figure 29. Total depositional and erosional evets at each site per season. ... 66 Figure 30. A. Lower Roanoke Basin elevation map with USGS monitoring stations B. Map of the land use in the Lower Roanoke basin with sampling locations. The insets show the location of the catchment within the United States. ... 77 Figure 31. River suspended sediment discharge during two periods, circa 1910 and circa 1980 showing the decrease in sediment loads associated with dam placement (based on (Meade et al., 1990)). ... 80 Figure 32. Sources of sediment to suspended load. ... 86 Figure 33. Upper panel: Suspended sediment concentrations presented as mean (solid line) and minimum and maximum values (dashed lines) at the station in the sampling period 2/20/2009 to 11/16/13.The open circles represent mean sediment concentrations from EPA STORET for period 02/20/1997 - 11/28/2007. Lower panel: Slope of the Lower Roanoke River. ... 90 Figure 34. Hydrographs at four stations, compared with discharges from the Roanoke Rapids Dam. Correlation coefficients (r) are provided in a left upper corner of each panel. ... 91 Figure 35. Grain size data of the channel bed and gullies by river km. Transition between Lower Roanoke River and bayhead delta is highlighted with a dashed line. Above the plot are examples of the bedforms characteristic for the Lower Roanoke River above the transition and for the fine-grained, flat channel bed in the bayhead delta. ... 93 Figure 36. 210Pb
LIST OF ABBREVIATIONS
BHD- Bayhead Delta
INTRODUCTION
Bayhead deltas located at the interface between terrestrial and marine processes, are becoming more susceptible to sea-level rise and human activities. In response to natural and anthropogenic alterations, these dynamic sedimentary systems function through a series of feedback loops. Responses of the bayhead deltas vary over a range of spatial and temporal scales, controlled by a rate of sea-level rise and sediment supply, and may be observed as geomorphological changes preserved within the sedimentary record. Our understanding of the deltas modern and historical response to natural and anthropogenic changes is crucial to the future sustainability of valuable coastal ecosystems.
This dissertation broadly addresses sedimentation, and sediment dynamics in the Roanoke River bayhead delta with a focus on the linkages between sedimentary process in the River main trunk and bayhead delta floodplains. Lower Roanoke River, NC, extends 220 km from the fall line to the bayhead delta front in Albemarle Sound. This theses places the emphasis on how these vulnerable coastal systems respond to natural changes (e.g. climatic, sea level, episodic storms) and anthropogenic alterations to the system (e.g. land clearance, damming), and how these changes impact sediment dynamics, that eventually are preserved within the geologic record.
flooded and formed interdistributary bay. The interdistributary bay was slowly filling up with sediments, the rate of sea-level rise slowed down, the sedimentation rates were keeping up until the mid-1600s AD. Deforestation associated with the initiation of agriculture by settlers in the drainage basin and poor management of runoff introduced a large quantity of sediment into the river. Since 1643 AD, sediment deliveries greatly overwhelmed the low rate of sea-level rise at the time, resulting in rapid progradation of the bayhead delta. In mid 1800s AD rates of sea-level rise increased and at the same time agricultural practices improved reducing sediment loads. During that time a second retreat event in the bayhead delta started. Modern delta plain is at sea level and its low accretion rate cannot keep up with accelerating sea-level rise. The construction of impoundments, completed in 1963 AD, likely magnified erosion of the delta by retaining sediment behind the dams and causing a drastic decrease in sediment supply to the delta.
Second chapter presents the results of analyses of flooding frequency and
depositional/erosional events in the floodplains of the Roanoke River bayhead delta. It confirms that delta in current state is not sustainable, and deltaic plains located in the lower and middle parts of the delta cannot keep up with sea-level rise. The processes governing the sediment dynamics show great variability and complexity. Upper parts of the delta have an optimal elevation, sediment concertation and inundation frequency and extend to outpace the sea-level rise. This chapter also reveals that during depositional and erosional events in the delta plain, sediments are being replaced with materials eroded from subaqueous, older parts of the delta.
Third chapter reveals modern sediment distribution in Lower Roanoke River with a focus on the bayhead delta. Placement of dams resulted in almost complete disconnection of the Lower Roanoke River from the upper watershed. The dams effectively restricted the suspended
CHAPTER 1: RESPONSES OF THE ROANOKE BAYHEAD DELTA TO VARIATIONS IN SEA LEVEL RISE AND SEDIMENT SUPPLY DURING THE
HOLOCENE AND ANTHROPOCENE 1
1.1 Abstract
The response of bayhead deltas to changes in the rate of sea-level rise and sediment supply is difficult to predict, but important to understand because these changes can lead to submergence and erosion of deltaic sediments and loss of important habitat. Here, we show that the Roanoke bayhead delta in North Carolina, USA experienced two episodes of retreat during the past 6000 years based on core descriptions and radiocarbon and 210Pb geochronologies. The first event occurred around 3700 BC as sedimentation could not keep up with the rate of sea-level rise and a prominent flooding surface separating delta plain, below, from interdistributary bay, above, formed. Afterwards, sedimentation rates were keeping up with the low rates of sea-level rise until the mid-1600’s AD, when the first European settlers began to clear forest and farm the drainage basin. During that time, the delta rapidly accreted and the interdistributary bay filled with legacy sediment from increased agricultural runoff. Regression was also facilitated by the low rates of sea-level rise at that time (-0.01 to 0.047 cm/yr). The second episode of bayhead-delta retreat initiated during the 19th century and continues today. Improved agricultural
practices and dam construction decreased the amount of sediment delivered to the bayhead delta.
Additionally, the rate of sea-level rise increased to 0.21 cm/yr at that time. Under these
conditions, the delta entered an erosional phase and during 1954-2012 the rate of delta loss was 2469m2/yr and that loss is easily recognized by cypress trees stranded in adjacent Albemarle Sound. This study emphasizes that human-induced modifications to the sediment budget and changes in the rate of sea-level rise strongly influence bayhead-delta evolution.
1.2 Introduction
Bayhead deltas exist where rivers discharge into drowned-river-mouth estuaries, and are common features of wave-dominated estuaries (Dalrymple et al., 1992), (Figure 1a). Secluded from the ocean environment, bayhead deltas are natural harbors. Many major ports and port cities, including the Port of Houston, TX, San Jose, CA, Sydney, Australia, Rotterdam,
Netherlands, Venice, Italy and Canton, China are located adjacent to, or on bayhead deltas. The protruding-open shelf deltas are affected (in both constructive and destructive manner) by waves, currents hurricanes and monsoons, while located in low-energy environments bay-head deltas respond more dramatically to anthropogenic modifications than to natural forces (Giosan and Goodbred, 2007; Pulich and White, 1991). Human activities within urban corridors have
are biogeochemically active sites on daily to decadal time scales contributing to global nutrient and carbon cycles (Hanson et al., 1993; Hupp et al., 2015; Noe and Hupp, 2009; White et al., 2002). Bayhead deltas host distinct, highly diverse ecosystems including swamp forest,
hardwood bottomlands, and other wetlands (Hupp et al., 2009b; Pringle et al., 2000), and provide valuable ecosystem services related to water quality, stormwater catchment, and wildlife habitat. The global value of ecosystem services provided by natural bayhead-delta wetlands is $2.5 to 2.8 million/km2/yr (in 2007 dollars) (Costanza et al., 2014; DeGravelles, 2010).
Bayhead deltas are very sensitive to changes in sedimentation and accommodation, thus, human alterations within watersheds greatly affect bayhead delta evolution (Nichols et al., 1986). Increased erosion in the watershed associated with deforestation, or land-use change, increases sediment supply (Hupp et al., 2009b; Mattheus et al., 2009; Ver et al., 1999), while construction of impoundments effectively restrict sediment delivery to the river mouth (Jaffe et al., 2007; Meade, 1982). Previous studies report bayhead deltas retreat rapidly (backstep) in response to a small increase in the rate of sea-level rise (Rodriguez et al., 2010), but the rate of retreat can also decrease as sediment supply increases or when transgression is confined by an abrupt increase of valley gradient at tributary junctions (Simms and Rodriguez, 2014). Current, conservative projections for a sea-level rise in this century range between 26 and 98 cm (IPCC, 2014), thus, it is crucial to understand the response of the bayhead-delta coastline to accelerating sea-level rise and to model impacts on coastal communities.
delta. In addition, we examine the impacts of the first European settlements in Virginia and North Carolina on bayhead delta evolution, followed by 20th century anthropogenic stressors, including the construction of impoundments.
1.3 Study Area
Albemarle Sound and the Roanoke Bayhead Delta at its head are located in Northeastern North Carolina (Figure 1a). The estuary is a part of a slowly subsiding - up to 0.1 cm/yr (Kemp et al., 2011), Albemarle Embayment sedimentary basin (Riggs, 2011). Albemarle Sound is 92 km long and its depth ranges between 0.45 to 14 m along its margin and axis, respectively. The Sound is isolated from the Atlantic Ocean by the Northern Outer Banks barrier-island chain. Exchange with the ocean and Pamlico Sound, to the south, is limited by a narrow passage located in the southeast at Croatan and Roanoke sounds (Figure 1a). This configuration results in
astronomical tides being negligible in the western part of the Sound near the Roanoke Bayhead Delta (Figures 1b and c). In 1860, the United States Coast Survey published the first bathymetric survey of Albemarle Sound with a note “There are no regular lunar tides in Albemarle Sound, the rise and fall of the water is influenced altogether by the wind and the state of the rivers emptying into it. At the western end of the Sound, the water is depressed by northerly and westerly winds, and elevated by those in the south and east” (United States Coast Survey, 1860). Subsequent studies confirmed that wind is the most important force circulating water and
to1.5 m above MSL in the Sound (Riggs and Ames, 2003). The much higher winds associated with tropical depressions and hurricanes can elevate water level at the mouth of the Roanoke River up to 2 m (for example during Hurricane Irene, August 27, 2011 water level was 1.98 m (USGS station number 0208114150), above its mean elevation ~0.0 meters NAVD 88 . The salinity of the Albemarle Sound varies from the 5-15 ppt in the east to 0.5-5 ppt in the middle and < 0.5 ppt in its west end, at the mouth of the Roanoke River (NOAA SEA Division, 1998).
Figure 1. A. North Carolina geological provinces. B. Extent of the Roanoke Bayhead Delta (BHD) from Broad Creek - the first distributary channel- to the shoreline in Albemarle Sound. C. Elevation map of the study area and station locations. D. Bald cypress trees stranded in
Albemarle Sound.
1.3.1. Geologic Settings.
modern open-ocean shoreline (the Outer Banks), formed around that time (Lankford and Rogers, 1969; Riggs, 2011). During the Sangamon sea-level highstand, the Roanoke River Valley was inundated approximately 200 km inland from the current delta-front position (Parham et al., 2007; Riggs, 2011). During the subsequent fall in relative sea level that culminated in the last glacial maximum ca. 22,000-19,000 years ago (Yokoyama et al., 2000), the Roanoke River started to erode an 11-m deep, large valley, at the Sangamon Shoreline, as it adjusted to a new equilibrium profile (Riggs, 2011). During the last deglaciation, marine flooding caused
transgression of the coastline and formation of modern Albemarle Sound as the Roanoke paleo-valley inundated. Previous studies showed that around 5,000 years BP, in the vicinity of the modern barrier islands, there was an open-marine embayment with estuarine conditions directly to the west in Albemarle Sound (Culver et al., 2008; Mallinson et al., 2005; Mattheus and Rodriguez, 2011) (Figure 2).
The Outer Banks (Kitty Hawk) formed around 3,000 years BP and a large tidal-inlet near Kitty Hawk, positioned over the valley axis, began to close ca. 1,000 years ago restricting ocean exchange to a few smaller inlets (Culver et al., 2008) (Figure 2). Exchange between Albemarle Sound and the open ocean ceased by 1833AD, when the Roanoke Inlet closed and the circulation of the estuary changed from astronomical-tide dominated to wind-tide dominated (Culver et al., 2008; Dunbar, 1958; Fisher, 1962) (Figure 2).
1.3.2. Roanoke River.
The Roanoke River originates in the Valley and Ridge province of the Appalachian Mountains in Virginia, has a total drainage area of 25,123 km2 and empties into the west end of the Albemarle Sound at an average annual rate of 252 m3/s (Giese et al., 1979; Molina, 2002) (Figure 1a). The Roanoke River flows through three geologic provinces of Virginia and North Carolina including, the Appalachian Mountains, Piedmont Plateau, and the Coastal Plain, before forming a bayhead delta near the Suffolk scarp (Brill, 1996; Oaks and DuBar, 1974) (Figure 1a). The provinces have distinct lithologies and weathering products. Most pronounced are the orange and red clay utisols produced by weathering of the igneous and metamorphic rocks of the Piedmont Plateau (Riggs and Ames, 2003).
gradient, an extensive, up to 9-km wide, floodplain exists from 80 km below the fall line to the bayhead delta.
1.3.3. Roanoke Bayhead Delta.
The subaerial Roanoke bayhead delta is about 86 km2, extending from Broad Creek- the first distributary channel- to the shoreline in Albemarle Sound (Figure1b). The delta is currently at ~0.0 m NAVD 88 (Figures 1b and c). The U.S. Army Corps of Engineers has been dredging the main-stem channel of the Roanoke River, modifying its morphology for navigational purposes, since 1871 and it was last dredged in 1964. Dredge spoils were deposited east of the River mouth in upper Albemarle Sound (Erlich, 1980).
The Eastmost River, a meandering distributary channel that separates Rice and
Goodmans Islands (Figure 1c), was chosen as access for sampling the delta plain because it has not been impacted by dredging. The channel of the Eastmost River decreases in depth toward the Sound, from about 12 m to < 1 m at the mouth bar. Cross-channel morphology around meanders is asymmetrical, similar to meandering streams located on floodplains.
and Ames, 2003). Evidence of this former delta-front shoreline remains as cypress trees stranded in the Sound (Bellis et al., 1975) (Figure 1c).
1.3.4. Anthropogenic Footprint.
The first European settlement in North America in the early 1600’sAD impacted the Roanoke River Watershed and Albemarle Sound. After the late 1600’s, heavy deforestation and poor agricultural practices led to a large release of sediment to the river, which accumulated along the floodplains and banks (Jacobson and Coleman, 1986; Trimble, 1974; Wolman, 1967). This legacy-sediment layer is at least 5 m thick along upstream reaches of the Lower Roanoke floodplain, and decreases downstream (Hupp et al., 2015).
Industrial development, placement of impoundments and better agricultural practices in the Roanoke watershed during the nineteenth century decreased the sediment loads entering Albemarle Sound. After a major hurricane made landfall in August 1940, causing excessive flooding to farmlands and property along the river, the US Army Corps of Engineers (USACE), constructed the John H. Kerr Dam (1947-1953). Following the completion of that dam, Virginia Railway and Power Company (currently Dominion), constructed two other dams further
increased over 6 times after the dam was installed (Richter et al., 1996) (Figure 3).Eliminating high-magnitude flows decreased the hydrological capacity of the river and connectivity between the upper and lower parts of
the river. Consequently, sediment discharge to the Lower Roanoke was reduced by 86 to 99% (Meade et al., 1990; Simmons, 1988). The
remaining sources of sediment to the delta and Albemarle Sound include the Lower Roanoke watershed and reworking of the river banks, channels and floodplains, which are filled with legacy sediment. Despite increasing turbidity downstream (Hupp et al., 2009a) and sediment accumulation in floodplain backswamps (up to 0.59 cm/y) (EPA et al., 2008; Hupp et al., 2015; Schenk et al., 2010) a loss of the delta shoreline has been observed (Riggs et al., 2008) indicating that sediments are not being dispersed to the proximal portion of Albemarle Sound.
1.4 Methods
1.4.1 Cores.
A 3.3 km long transect of five cores was collected across the lower part of the Roanoke Bayhead delta from the delta plain to the prodelta (Figure 1c). Each core location was occupied twice. Initially, we collected 7.6 cm diameter vibracores at the sites, but always encountered tree logs and roots that limited penetration depths to between 132 cm and 634 cm. To increase
sampling depths, we reoccupied the sites using a different coring method, and collected 5.4 cm Figure 3. Roanoke River discharge measured at
Roanoke Rapids, NC (USGS 02080500). Since
diameter, 122 cm long cores at discreet depths using the Geoprobe Macro-Core™ tool. The core barrel was plugged while it was driven to the sampling depth with a gas-powered jackhammer. At the sampling depth, which ranged from 730 cm to 1100 cm, the plug was removed and the barrel was driven an additional 122 cm to collect the core. Cores EPS and EPN were taken along the Eastmost River at a meander on the border of Rice Island. Core EPS was located south of the meander on the subaqueous point bar and core EPN was located inland on the delta plain. Core EM was taken at the channel-mouth bar of the Eastmost River (delta front). From upper
Albemarle Sound the proximal and distal prodelta was sampled in core AWa and AWc, respectively. The cores were transported to the lab then split, photographed, described and subsampled for grain-size analyses and radiocarbon dating. Interpretation of the depositional environments was based on lithologic data (Figure 4, 5).
1.4.2. Grain Size.
402 subsamples of cores EM (6), EPN (314), EPS (23), AWa (9) and AWc (50) were analyzed for grain size using a CILAS 1180 to measure particle sizes from 0.04 μm to 2500 μm in 100 size classes by laser diffraction. The sub-samples are representative of the different stratigraphic units sampled in the cores (Figs. 5, 6a and 6b).
1.4.3. Radiocarbon dating.
radiocarbon results for isotopic fractionation. The conventional radiocarbon dates were
calibrated with Oxcal 4.1 (Ramsey, 2009) using the IntCal 13 and Marine 13 calibration curves (Reimer et al., 2013) and reported as BC (Before Christ) and AD (Anno Domini). The calibrated (95.4% probability) age intervals were averaged with an error reflecting the standard deviation, which is similar to the methodology presented in (Horton et al., 2009) and (Kemp et al., 2011), and has been used to place radiocarbon dates from cores in context of sea-level rise. Averaged radiocarbon dates were rounded to the nearest decade, and used to determine the timing of the events and to calculate sedimentation rates. In core EPN, historical records support using the maximum date from the age interval instead of the average date. Data interpretations were performed with the assumption that the radiocarbon dates of the sampled organic material reflect the time of deposition.
Table 1. Radiocarbon dates. Core Name Depositional Environment AWc Prodelta EM
Delta Front EPN Delta Plain EPS Delta Plain
LAT/ LON
35.95365/-76.7021
35.94141/-77 35.93253/-76.7183
35.93096/-77 Sample Depth
(cm)
699 625 101 845
14C age 3570 ± 30 280 ± 30* 340 ± 20 190 ± 30 *
Calibrated age range (95.4%)
2022 – 1781 BC 1498 – 1795 AD 1470 – 1643 AD 1648 – 1950 AD Date for
sedimentation rates
1900±120 BC
(Mean at 95.4%)
1650±150 AD
(Mean at 95.4%)
1643 AD** (Highest at 95.4%)
1648 AD*** (Lowest at 95.4%) Sample Depth
(cm)
802 715 123 962
14C age 3700 ± 40
2210 ± 35 575 ± 20 4530 ± 40
Calibrated age range (95.4%)
Date for sedimentation rates
2090±120 BC
(Mean at 95.4%)
280 ± 100 BC
(Mean at 95.4%)
1360±50 AD
(Mean at 95.4%)
3230 ± 130 BC
(Mean at 95.4%) Sample Depth
(cm) 882 777
211
14C age 4930 ± 40 4110 ± 40
1350 ± 20 Calibrated age
range (95.4%)
3786 – 3645 BC 2871 – 2505 BC 646 – 686 AD Date for
sedimentation rates
3720±70 BC
(Mean at 95.4%)
2690±180 BC
(Mean at 95.4%)
670 ±20 AD
(Mean at 95.4%) Sample Depth
(cm)
1096 835 435
14C age 6030 ± 40 5120 ± 35 2800 ±20
Calibrated age range (95.4%)
5034 – 4806 BC 3991 – 3797 BC 1006 – 904 BC Date for
sedimentation rates
4920±110 BC
(Mean at 95.4%)
3890±100 BC
(Mean at 95.4%)
950±50 BC
(Mean at 95.4%) Sample Depth
(cm)
933 467
14C age 5420 ± 35 2880 ±20
Calibrated age range (95.4%)
4357 – 4071 BC 1124 – 996 BC Date for
sedimentation rates
4210±140 BC
(Mean at 95.4%)
1060±60 BC
(Mean at 95.4%) Sample Depth
(cm)
581
14C age 3180 ± 20
Calibrated age range (95.4%)
1499 - 1421BC Date for
sedimentation rates
1460±40 BC
(Mean at 95.4%)
* Radiocarbon date beyond range of calibration curve (Reimer et al., 2013)
** Historical records support using the maximum date from the age interval instead of the average date.
1.4.4. 210Pb geochronology.
Cores AWc, AWa, EM, EPN and EPS were subsampled in 1 or 2 cm intervals. The bulk sediment was freeze dried and dry mass recorded. 210Pb activities were determined via isotope-dilution alpha spectrometry for 210Po, granddaughter isotope of 210Pb, acknowledging that 210Po and 210Pb are in secular equilibrium with each other (Flynn, 1968; El-Daoushy et al., 1991; Matthews et al., 2007; de Vleeschouwer et al., 2010). To calculate excess 210Pb, the supported (226Ra) activity was subtracted from the total 210Pb value (Appleby and Oldfield, 1992). Supported (226Ra) activity was measured via gamma spectrometry. Freeze-dried and
homogenized samples were packed into plastic petri dishes and sealed for over 19 days to allow sample equilibration with 222Rn. Gamma counting was conducted on well and planer germanium detectors, calibrated with certified natural reference standard IAEA-300. 226Ra was measured indirectly, by calculating emission of it daughters 214Pb (at 295 and 351 keV) and 214Bi (at 609.3 keV) (Benninger and Wells, 1993).
1.4.5. Side scan sonar.
To reconnoiter the subaqueous geomorphology, side-scan sonar data were collected, from the prodelta using an Edgetech 4200 dual-frequency (120/410 kHz) system. Data were collected using 410 kHz, at a 50-m range and in a discontinuous grid pattern. Data were processed by applying a time-varying gain and mosaicked using Chesapeake Technology Inc. SonarWiz software. Interpretations were verified in the field with diver observations.
1.4.6. Maps and aerial photography.
(Lewis and Carey, 1818), 1822 (Fielding and Kneass, 1822) and 1833 (Brazier et al., 1833) were examined to reconstruct morphologic changes associated with the closing of the Roanoke Inlet. To reconstruct the maximum extent of the bayhead delta and its shoreline movements, we used historical bathymetric charts from 1860 (United States Coast Survey, 1860) and 1864 (United States Coast Survey et al., 1864). All map images were georeferenced using a spline
transformation method and 15-27 referencing points per map in ArcMap software (ESRI
(Environmental Systems Resource Institute), 2015). Georeferencing of the historical map images caused significant distortion that prevented quantitative analyses, however the maps provided sufficient information for qualitative assessment of morphologic change in the study area. Modern aerial photographs from 1954 (U.S. Geological Survey (USGS), 1954) and 2012 (U.S. Department of Agriculture (USDA), 2012) were used to calculate modern land loss and rate of shoreline retreat using ArcGIS software (ESRI (Environmental Systems Resource Institute), 2015).
1.5 Results and Interpretation.
1.5.1 Depositional Environments.
The depositional environments sampled in the cores include: delta plain, fluvial channel, interdistributary bay, delta front, prodelta and subaqueous point bar (Figure 4). Lithologic descriptions of the cores were used to differentiate the environments and develop a stratigraphy. The characteristics used in describing the sediments were color, grain-size, sedimentary
2013). A radiocarbon date from the bottom of the orange-stained units in cores EPN and EPS (Table 1) correspond with the time of the first settlements in the 17th century, when intensive deforestation and agriculture accelerated erosion within the Roanoke watershed.
Figure 4. Crossection of the study area in the Eastmost River, presenting stratigraphy,
Figure 5. Grain-size distribution with depth in core EPN shows a sharp transition between finer delta plain and coarser interdistributary bay units. Photos show the distribution of legacy sediments and contact between delta plain and interdistributary bay in core EPN. Grain-size distribution with depth in core AWc shows the upper sand bed and silty prodelta unit. Photos of core AWc show beds and laminae of red legacy sediment delivered to the prodelta during high-discharge events. Lower core photos show contacts between different sedimentary units (abbreviations explained in Figure 4).
Delta plain The top 112 cm of core EPN , collected from the delta plain, sampled orange-stained grading to dark brown at depth, carbonaceous sediment, with large pieces of woody material including roots and tree branches, and smaller pieces of decomposing leaves (Figures 4, 5). The sediment is moderately sorted and has a bimodal grain-size distribution with peaks at φ 4.7 (coarse silt) and φ 6.2 (fine silt), with a small percentage of clay (mean grain size of φ 4.6-6.7) (Figure 6a). Organic material dated at the base of the unit is from 1643AD (Table 1). A nearly identical unit, the only difference being its dark brown color, was sampled at depth in cores EM, AWa and AWc and was interpreted as an older delta plain unit (Figures 4, 6a). Organic material from the older delta plain unit was radiocarbon dated at 1096 cm depth in core AWc as 4920±110BC, at 933 cm depth in core EM as 4210±140BC, and at 882 cm in core AWc as 3720±70BC (Table 1).
Subaqueous point bar Core EPS, collected adjacent to the Eastmost River Channel, sampled an 845 cm thick, orange clayey silt unit with laminae of medium-grained sand, and organic material. The unit has a bimodal grain-size distribution with a primary mode of coarse silt and a secondary mode of fine silt (Figure 6b). Organic material sampled from the base of the unit was dated at 190 ± 30 BP, which is too recent to assign a single calibrated date to it.
Fluvial Channel Cores EPS and EM, collected adjacent to the Eastmost River Channel, sampled a poorly sorted fine to coarse sand (mean 1.0 to 2.4 phi) at their base from 875-1150 cm and 800-920 cm, respectively (Figure 6a). Core EPS was collected 1 m from the channel thalweg and core EM was collected from the mouth. Erich (1980) also sampled fluvial channel deposits as moderately to poorly sorted sand in 16 cores in our study area at depths 2.7- 11.9 m and the unit is likely continuous below the entire bayhead delta. Organic material sampled from the fluvial unit at 962 cm in core EPS and 835 cm in core EM was dated as 3230±130BC and 3890±100BC, respectively (Table 1).
Figure 6. Grain size analyses and photos for depositional environments: delta plain, fluvial channel and
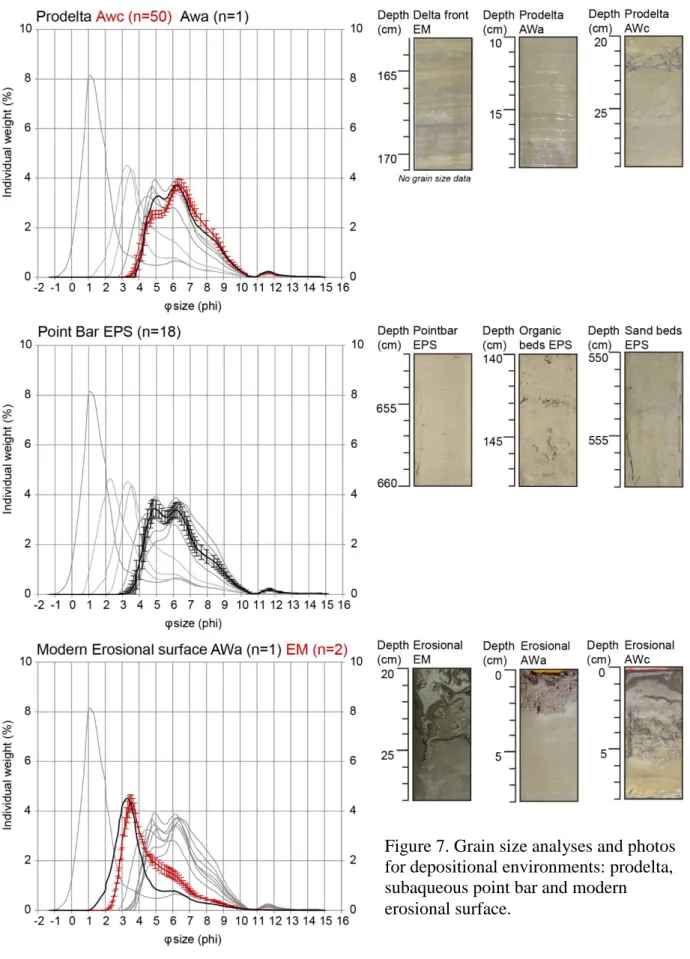
Delta front Core EM, taken from the mouth-bar of the Eastmost River, sampled orange and gray fining upward clayey silt from 212 to 36 cm. The unit shows beds of orange-stained legacy mud (5 cm -12 cm thick), beds and laminae of organic matter (0.3 cm- 1.5 cm thick) and sand laminae (0.2- 0.4 cm thick) (Figures 4, 5). At the bottom of the unit are burrows filled with fine sand. The modern mouth bar at the top of the core has sampled fine sand 0-36 cm.
Prodelta Cores AWa and AWc, collected from upper Albemarle Sound, sampled orange and gray fining upward poorly sorted clayey silt (Figures 4, 5). The grain-size distribution is bimodal with a primary mode of coarse silt and a secondary mode of fine silt. The mean grain size ranges from 4.8-6.9 phi, which are the smallest particle sizes sampled from the delta (Figure 6b). The unit contains discrete beds and laminae of gray clayey silt and laminae of organics and fine-grained sand. The unit thickens seaward to 110 cm sampled in core AWc (Figures 4, 5).
1.5.2. Stratigraphy
underlying interdistributary bay unit, was sampled in all of the cores. In core EPN, a 1-cm thick sand bed marks the contact with delta plain sediment that extends to the surface and forms the modern delta plain landscape (Figure 4). That environmental change occurred between
1360±50AD and 1643AD (Table 1) based on dates below and above the sand bed, respectively. The regressive stratigraphic succession of interdistributary bay below delta plain (EPN) and mouth bar (core EM) environments, and presence of fluvial channel below the point bar deposits (EPS), indicates a change in depositional regime to rapid sedimentation. The time of increased sedimentation coincides with falling relative sea level (Figure 7) (Kemp et al., 2011), which likely contributed to the regression. Farther into Albemarle Sound, prodelta clayey silt was deposited above the interdistributary bay mud in cores AWa and AWc (Figure 4).
The interbedded orange and gray color changes of the prodelta unit likely indicate variations in river discharge with the orange legacy sediment delivered to the prodelta during high discharge events. In core AWc, a 1-2 cm thick sand bed was sampled at the contact between the interdistributary bay and prodelta, but no radiocarbon dates were collected above or below this transgressive surface. Based on the presence of legacy sediment, the environmental change must have occurred after the first European settlements in the Roanoke watershed. A dark gray fine-grained sand bed (2-40 cm in thickness) was sampled at the top of cores EM, AWa, and AWc, and interpreted as a lag deposit associated with modern erosion of the delta front.
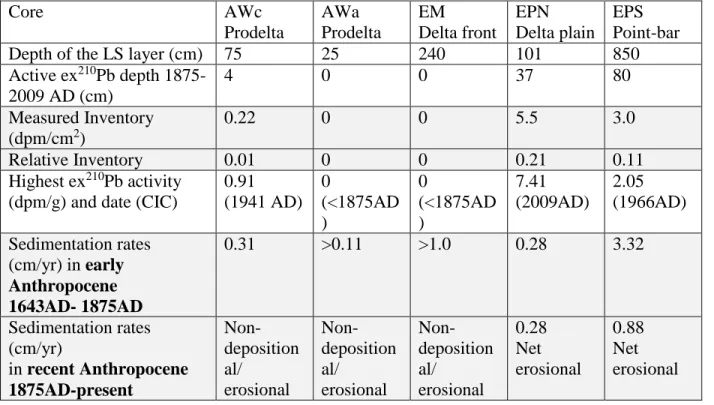
1.5.3 210Pb geochronology
(MI 2.5 dpm/cm2). The inventories for these two sites also suggest that both sites are net erosional.
Table 2. Excess 210Pb inventories and sedimentation rates.
Core AWc
Prodelta AWa Prodelta EM Delta front EPN Delta plain EPS Point-bar
Depth of the LS layer (cm) 75 25 240 101 850
Active ex210Pb depth 1875-2009 AD (cm)
4 0 0 37 80
Measured Inventory (dpm/cm2)
0.22 0 0 5.5 3.0
Relative Inventory 0.01 0 0 0.21 0.11
Highest ex210Pb activity (dpm/g) and date (CIC)
0.91 (1941 AD) 0 (<1875AD ) 0 (<1875AD ) 7.41 (2009AD) 2.05 (1966AD) Sedimentation rates
(cm/yr) in early Anthropocene
1643AD- 1875AD
0.31 >0.11 >1.0 0.28 3.32
Sedimentation rates (cm/yr)
in recent Anthropocene 1875AD-present Non-deposition al/ erosional Non-deposition al/ erosional Non-deposition al/ erosional 0.28 Net erosional 0.88 Net erosional
The net sedimentation rates (cm/yr) of the legacy sediment were derived for two periods and are expressed as a change in depth through time (cm/yr). The first period (early
Anthropocene), from 1643AD to 1875AD, and the second period (recent Anthropocene) from 1875AD until present. For the purpose of this study, we use AD 1500 as the beginning of the Anthropocene following a timeline proposed by Braje and Erlandson, (2014), as this was “the beginning of the Columbian Exchange, which created vast faunal, floral, ecological, and cultural changes globally”. The date of 1643AD, in the early Anthropocene period, is a maximum
concentration measured in the Roanoke Delta (7.41 dpm/g), decay corrected 6 half-lives (133.4 years), down to the supported level (excess activity of 0.1 dpm/g), and marks the bottom of the excess 210Pb active layer. Sedimentation rates derived for the early Anthropocene are the highest at EPS (3.32 cm/yr), 0.28 cm/yr at EPN and 0.31 cm/yr at AWc. Since cores EM and AWa have no active excess 210Pb layer, age of the top of the cores could not be derived, and thus the sedimentation rates for both cores presented in table 2 are underestimated.
The sedimentation rate for the recent Anthropocene was derived from the base of the excess 210Pb active layer (1875AD) to the top of the core. Cores with an excess 210Pb active layer had significantly different maximum excess 210Pb activities in the top layer. The highest activity was 7.41 dpm/g, measured in core EPN, with cores EPS and AWc yielding lower activities of 2 dpm/g and 0.91 dpm/g, respectively (Table 2). In core EPN, sedimentation rates were the same for both early and recent Anthropocene (0.28 cm/yr). Lower activities in the top layer of cores EPS and AWc are consistent with the low MI and RI values and non-depositional/erosional nature of these two sites. In order to calculate the age of the top layers in cores EPS and AWc, a constant initial concentration dating model (CIC) (Goldberg, 1963; Krishnaswamy et al., 1971; Sanchez-Cabeza and Ruiz-Fernández, 2012) was implemented, assuming an initial concentration of 7.41 dpm/g (the highest recorded concentration in top layer of the EPN core). For cores EPS and AWc, the top layers were deposited in 1966AD and 1941AD, respectively (Table 2), and both sites are currently non-depositional. At core EPS during the recent Anthropocene, the sedimentation rate was almost four times smaller (3.32 cm/yr) than during the early
Figure 9. Accumulation Rates in the Roanoke Bay-head Delta. Accumulations expressed in colors: green for an early Holocene delta plain (0.18 cm/yr), grey for the interdistributary bay (0.03-0.05 cm/yr), and yellow for legacy sediments (0.28-10.03 cm/yr).
1.5.4 Historical Shoreline Changes.
Changes in the morphology of the delta front were constrained from historical maps (1860, 1864, 1954, and 2012) and the side-scan sonar data (Figure 9). The side-scan sonar
delta front retreat (Figure 9). Based on analyses of aerial photographs, between 1954 and 2012, the modern shoreline retreat rate was ~2469 m2/yr.
1.6. Discussion
1.6.1. Holocene Delta Evolution.
Between 4920±110BC and 3720±70 BC, the paleo-Roanoke delta extended into modern Albemarle Sound and an extensive vegetated delta plain existed in the study area (Figure 10a). This delta plain unit, sampled in cores EM, AWa, and AWc, accreted at a rate of 0.18 cm/yr (Figure 8). Sea-level during that time was rising at rate of 0.261 cm/yr (Horton et al., 2009) (Figures 7, 8), which caused an increase in accommodation and landward movement of the paleo-Roanoke River mouth (Figure 10b). The study area started transitioning to an
interdistributary bay environment sometime after 3700 BC, marked by the erosional surface overlaying the delta plain in core AWc (Figure 4). Sand and organic material was likely supplied to the interdistributary bay episodically during flood events that overtopped channel levees and sediment mixing occurred during intervening times by benthic organisms. In core EM the delta plain is overlain by fluvial deposits (Figure 4, 5). This sequence suggests that the river channel changed its position and eroded the top of the paleo delta plain unit at the core location.
Sedimentation rates within the interdistributary bay unit were similar to the rate of sea-level rise, 0.03-0.05 cm/yr. The interdistributary bay unit is crowned with a 1-cm thick sand layer that marks a change in depositional regime to higher sedimentation associated with the deposition of legacy sediment during the early Anthropocene (Figure 4, 5).
1.6.2. Early Anthropocene Delta Evolution (1643AD to 1875AD).
introduced to the lower Roanoke delta in the late 17th century after the first Europeans settled in the watershed and cleared forest for agriculture. During that time until the 19th century, sea-level was stable or falling (Kemp et al., 2011) (Figure 7). With a high sediment supply and a stable sea level, an extensive bayhead delta plain formed and extended into upper Albemarle Sound.
Between 1643AD and 1875AD, the orange-stained legacy sediment prodelta in core AWc was accreting at a rate of 0.31 cm/yr (Table 2). The legacy prodelta sediment unit sampled in core AWa is located between tree stumps, suggesting a patchy distribution of prodelta clays at this proximal prodelta location. The entire prodelta unit at AWa was deposited prior 1875AD at the rate of 0.11 cm/yr or higher (Table 2). In core EM, collected from the channel mouth bar, there is no excess 210Pb present in the legacy sediment unit, thus the entire layer was deposited prior 1875AD at rate of 1.03 cm/yr or higher (Table 2). In the Early Anthropocene, sediments in the delta plain at the EPN core location accumulated at a rate of 0.28 cm/yr (Table 2) and are higher compared to the sedimentation rates in the Holocene delta plain unit that accreted at rate of 0.18 cm/yr (Figure 8). The highest sedimentation rates of 3.32 cm/yr were found in the subaqueous point bar core EPS (Figure 8, Table 2) and are similar to the rates reported for the same time period by Hupp et al., (2015) for the levees up river from the study area (2.3-4 cm/yr).
Sedimentation rates are higher in core EPS than in core EPN due to the more continuous supply of sediment to the subaqueous point bar as opposed to the subaerial delta plain. A line of
Figure 10. Reconstruction of the Roanoke bayhead delta shoreline during the early and recent Anthropocene based on historical maps from 1860 and 1864 in orange (United States Coast Survey, 1860; United States Coast Survey et al., 1864), from 1954 and 2012 aerial photography in blue (U.S. Geological Survey (USGS), 1954) and in black (U.S. Department of Agriculture (USDA), 2012), respectively. Position of submerged tree stumps imaged with the side-scan sonar (inset) are marked with black dots on the map.
1.6.2. Recent Anthropocene Delta Evolution.
indicative of the erosional state of the prodelta and delta front. The 210Pb data confirm that those sites have been non-depositional/erosional since before 1875AD. Sedimentation rates in the delta plain during the recent Anthropocene, based on the depth of the excess 210Pb active layer and the top of the core, were 0.28 cm/yr, similar to sedimentation rates measured for the early
Anthropocene. However, even though the measured excess 210Pb inventories in the delta plain (EPN) are the highest recorded in the study area (MI=5.5 dpm/cm2), the RI value is very low (0.21), suggesting that today the delta plain at this site is net non-depositional/erosional. Geochemical data also show a shift towards lower sedimentation rates during the recent
Figure 11. Conceptual model illustrating evolution of the bayhead delta in context with Albemarle Sound. A. Late Pleistocene, Early Holocene Paleo-Roanoke Valley during the Last Glacial Maximum ca. 18 kyr BP (in dark blue). In the study area, floodplain inundation only occurred during overbanking events. B. Holocene ca 4 kyr BC flooding of the study area and formation of the interdistributary bay. C. Early Anthropocene increase in sediment supply associated with land-use change, islands trapped sediment facilitating accretion. The delta reached its maximum extent ~1860AD. D. Recent Anthropocene Improved agriculture practices and installation of a series of impoundments in the watershed resulted in decreased sediment supply followed by erosion and bayhead delta back-stepping since late 1800’AD. The evolution of Albemarle Sound based on Culver et al., (2008), paleo-Roanoke channel in A based on Erlich, (1980)).
1.7. Conclusions
keeping up with the low rates of sea-level rise until 1600-1700AD. With the arrival of the first colonists in the Roanoke watershed the natural sediment load of the river was disrupted. Deforestation associated with the initiation of agriculture by settlers in the drainage basin and poor management of runoff introduced a large quantity of sediment into the river. Since 1643AD, sediment deliveries greatly overwhelmed the low rate of sea-level rise at the time, resulting in rapid accretion of the bayhead delta. At that time, the interdistributary bay filled with over two meters of delta plain sediment. 200 years later, rates of sea-level rise increased and agricultural practices improved, increasing sediment accommodation and decreasing the amount of sediment delivered to the mouth of the Roanoke River. These two changes led to the initiation of bayhead delta retreat and land-loss. The construction of impoundments, completed in
1963AD, likely magnified erosion of the delta by retaining sediment behind the dams and causing a drastic decrease in sediment supply to the delta. At present, the delta plain is at sea level and its low accretion rate cannot keep up with accelerating sea-level rise. This study stresses that bayhead deltas are highly sensitive to changes in sediment supply, the rate of sea-level rise and human-induced modifications to the sediment budget. Findings presented here should be taken under consideration in management efforts to conserve bayhead deltas, globally. With current predictions of accelerated sea-level rise, bayhead deltas are subject to
CHAPTER 2: CONTROLS ON DEPOSITIONAL AND EROSIONAL EVENTS IN THE MODERN DELTA PLAIN OF RETREATING BAYHEAD DELTA
2.1 Abstract
rates of sea-level rise only where key factors to deltaic sustainability (elevation, suspended sediment concentrations and inundation frequency) are optimal.
2.2 Introduction
Delta plains and lowland floodplains are vegetated, subaerial parts of the deltaic systems and are the location of valuable wetland habitats. Depending on local geomorphology,
hydrology, and dominant marine forcing, deltaic plains are occupied with wetlands of different characteristics: fresh and salt-water marshes, mangroves or swamps.
The role of river deltas, floodplains and lowlands has clearly been identified as an important component of global biogeochemical cycles (Kremer et al., 2005; Mckee, 2003). Previous studies showed that particulate materials and associated carbon may spend a significant part of their time stored within the deltas, channel bed, floodplains, gullies and ditches (Lecce et al., 2006; McKee, 1998). When in transport, particulate material undergoes a variety of physical, chemical and biological transformations before reaching the ocean (Dagg, 2004). These
processes maybe altered by anthropogenic changes (Bianchi and Mead, 2009; Jalowska et al., 2015; Kondolf et al., 2014; Mattheus et al., 2009; Syvitski, 2008).
Day et al., 1995; Giosan, 2014; Snedden et al., 2007) causing delta’s degradation. Deltas are also vulnerable to sea-level rise. The sea level on the coast of North Carolina has been rising, and since 1900 it has risen ca. 0.4 m (Kemp et al., 2011). With rising sea level, coastal environments are expected to experience more flooding of lowlands and a greater lateral extent of storm impacts (Kopp et al., 2016). Current rate of sea-level rise in North Carolina is 0.3-0.4 cm/year.
Deltaic environments are considered net depositional; many previous studies have
documented both loss of sediment from erosion, transport and rapid episodic deposition (Aller et al., 2008; Gomez et al., 1999, 1998; Phillips, 1992; Trimble, 1983; Walsh and Nittrouer, 2004). However the role of river delta environments is changing dramatically from burial to erosional settings and may act as sources of particulate material in response to accelerating sea level rise and sediment cutoff, caused by the placement of dams (Jalowska et al., 2015).
Previous studies looked into the physical drivers governing aggradation and erosion in modern deltaic plains. Bellucci (2007) found a strong relationship between inundation frequency and sediment aggregation in the marshes of Po river delta plain. Another study in North Carolina marshes found insignificant correlations between inundation frequency and deposition
(Lagomasino et al., 2013). This study stressed that the dynamics of marsh deposition in wind-dominated environments are complex, involving relationships between wind patterns, water levels, and marsh geomorphology. In both cases, delta plain inundations were governed by water fluctuations in adjacent lagoon/estuary.
environments (Battin et al., 2009; Bianchi and Mead, 2009; Zehetner et al., 2009). However, deltaic plains experience more frequent inundations, and may respond to changes within the watershed on different time scales than alluvial floodplains.
Purpose of this study is to investigate sediment dynamics in the transgressive delta plains, and time scales of depositional and erosional events. This project, an extensive 5 year study using geochemical and hydrological tools, addressed the question of what governs sediment dynamic during delta retreat, with a special focus to sea-level rise, sediment supply and flooding events.
2.3 Background
2.3.1 Study Area.
Roanoke River bayhead delta is located in the western part of Albemarle Sound. The Roanoke River originates in the Valley and Ridge province of the Appalachian Mountains in Virginia, has a total drainage area of 25,123 km2 and empties into the west end of the Albemarle Sound at an average annual rate of 252m3/s (Giese et al., 1979; Molina, 2002)(Figure 12). Before entering the Sound, the Roanoke River forms a bayhead delta. The subaerial Roanoke Bayhead Delta is about 86 km2, extending from Broad Creek – the first distributary channel – to the shoreline in Albemarle Sound (Figure 12). The delta hosts a Cypress Gum Swamp habitat of national significance (Hupp et al., 2008).
The Roanoke River Valley and Albemarle Sound were impacted by the first European settlement in North America in the late 1600’s AD. Heavy deforestation and poor agriculture practices led to the release of a significant amount of sediment to the river (Jacobson and
main trunk of the river was dredged by the U.S. Army Corps of Engineers for navigational purposes, and dredge spoils were deposited east of the River mouth in upper Albemarle Sound (Erlich, 1980).
Figure 12. Roanoke Bayhead Delta and Sampling Stations.
channels and floodplains seaward from the dam as the only source of sediments to the BHD (Jalowska et al., submitted.; Schenk and Hupp, 2008). Furthermore the dam placement resulted in eliminating maximum and minimum flows, leaving a medium flow a dominant one (Jalowska et al., 2012; Richter et al., 1996). Depending on the magnitude and duration of water releases from the dam, the counteracting energy generated by the seiche can be carried as up to Williamston, 70 km up the river (Jalowska et al., 2015; Luettich et al., 2002). The water level within the bayhead delta is controlled by the water movement in Albemarle Sound, and the connectivity with dam releases is negligible (Jalowska et al., submitted). The delta is currently at 0.0m NAVD 88 (Figure 12). National Elevation Data show lack of banks downstream which enables connectivity with the floodplains and anabranch channels. Depending on river flow dynamics this may result in particulate accumulation onto or removal from the floodplain. As a consequence, delta plain may also become a source of particles previously stored for a long time (Jalowska et al., submitted). Previous studies reported sedimentation in distal parts of the bayhead delta at the rate of 0.2-0.8 cm/year (EPA, 2010; Schenk and Hupp, 2008) while front of the delta is retreating and shifts from depositional to non-depositional or erosional state. The process is associated with sea-level rise and a decrease in sediment supply associated with improved agricultural practices and damming (Jalowska et al., 2015).
2.3.2 Site description.
Three sampling sites were chosen to represent a gradient in the deltaic plain environment and to accommodate accessibility (Figure 12).
Sampling site A (Figure 13) is located in Broad Creek, a distributary channel and
channels and backswamps. Site A is located in the floodplain at the junction of the anabranch channel with the distributary channel, approximately 10 meters from the river channel. Subaqueous parts of the river bank were composed of the unconsolidated mud. Subaerial sections were fortified with knees of the cypress roots and covered with perennial vegetation, mostly grasses and aquatic plants.
Figure 13. Location of sampling station A.
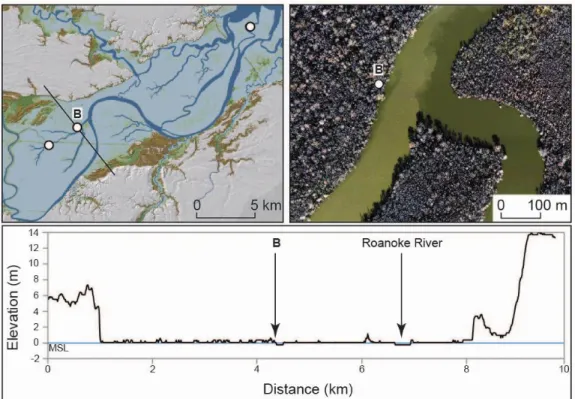
Sampling site B (Figure 14) was located in the floodplain of the Broad Creek at the junction of distributary channels, closer to the Roanoke River main trunk. The sampling site was located behind a natural, vegetated levee, approximately 5 meters from the river bank, in a hollow filled with unconsolidated mud. The sampling site was surrounded by vegetation
Figure 14. Location of sampling station B.
Sampling site C was located in the floodplain of the Roanoke distributary channel- Eastmost River on the Rice Island (Figure 15). The Eastmost River is a meandering distributary channel that separates Rice and Goodmans Islands (Figure 12). The sampling site was located proximately 10 m from the riverbank on the seaward site of the meander. There was no visible levees at this site. The sampling site was characterized by mixed vegetation of trees, grasses and aquatic plants.
2.4 Methodology
2.4.1 Elevation.
Three attempts to measure the elevation of each site, relative to the North Atlantic Vertical Datum of 1988, using GPS and the North Carolina Virtual Reference System failed due to the dense tree canopy, which prevented the Trimble 5800 to receive satellite signals. The relative elevation was calculated based on the differences between water levels recorded at each site, and water level recorded at the USGS station in Plymouth (Figure 12), and assumption of 0 MASL elevation at site C.
2.4.2 Sample collection and radionuclide analyses.
7Be is produced in the upper atmosphere by cosmic ray spallation of nitrogen and oxygen and is transported to the lower atmosphere mostly by wet fallout. 7Be has a half-life of 53.3 days and is useful to determine sedimentation rates on monthly time-scales(Bhandari et al., 1970; Kaste et al., 2003; Lal et al., 1960)..
210Pb (Curie et al., 1898; Rutherford, 1904) has half-life t
1/2 = 22.23 yr (Bé et al., 2008) and is a naturally produced radionuclide; a decay product of 238U present in the Earth’s crust. It has two pathways of becoming part of the lithogenic particle. A direct contribution through a 238U decay chain in the particle’s matrix referred to as a supported 210Pb. The indirect path is through wet and dry fallout, associated with the escape of 222Rn (part of 238U decay chain) from soils to the atmosphere and its decay to 210Pb, referred to as the ‘unsupported’ or ‘excess’ 210Pb (210 Pbxs) (Goldberg, 1963).
2.4.2.1 Gamma spectrometry.
2.4.2.2 Alpha spectrometry
Additionally, depending on the core depth 10-40 cm of each core was analyzed for 210Pb activities alpha spectrometry (Appendix).
2.4.3 Inventories and Sediment Accumulation.
210Pb
xs and 7Be can be supplied to floodplains by two pathways a direct deposition from the atmosphere (atmospheric flux) or supply of inorganic particulate material from sediment in transport. Inventories of excess 7Be and 210Pb
xs were calculated by summing the quotients of activities (dpm/g) and aerial section dry masses (g/cm2) for all core sections. The total inventory was divided into two components: residual inventory (inventory of previous sampling period decay-corrected to the date in the middle between previous and present sampling), and new inventory (total inventory (present sampling) - residual inventory). Next, the atmospheric flux was subtracted from the new inventory (as a background). The new inventory was divided by the mean activity in the surface region, to yield mass accumulation or removal (mass balance) over the time between samplings (Canuel et al., 1990). Additionally, based on total inventories, the radionuclide flux (total inventories multiplied by a decay coefficient of given radionuclide) at given site at given time was calculated, and compared to the atmospheric flux and presented as a ratio. Ratio below 1 indicates a net removal of sediments due to erosion and ratio above would indicate focusing accumulation (Benninger and Wells, 1993).
210Pb fluxes vary with latitude and show insignificant monthly variations (Baskaran, 2011). 210Pb
xs atmospheric flux were based on the review work by Baskaran, 2011, providing assumption for 210Pbxs atmospheric flux in North Carolina to be 0.08 dpm/cm2/month or 0.96 dpm/cm2/yr.
The production of 7Be is controlled by the cosmic ray flux which varies with altitude, latitude and solar activity (Kaste et al., 2003; Lal et al., 1960). 7Be deposition occurs as wet deposition (Dibb, 1989; Olsen et al., 1985; Wallbrink and Murray, 1994) thus the magnitude of annual fallout fluxes varies primarily in response to annual precipitation amount and latitude (Walling, 2013) and is not affected by canopy through-fall (Karwan et al., 2014). Taking these variabilities into consideration, the atmospheric flux of 7Be at the study site was calculated based on 137 measurements from sites proximate to North Carolina. For coastal North Carolina
Figure 16. 7Be fluxes by storm total precipitation from studies reporting event-based collections in the proximity to study area: coastal North Carolina (Canuel et al., 1990), northeastern
Maryland (Karwan et al., 2014), Chesapeake Bay area (Kim et al., 2000), Oak Ridge, Tennessee (Olsen et al., 1985) and Norfolk, Virginia (Olsen et al., 1985; Todd et al., 1989) and from a Stillpond, MD (Kim et al., 2000).
The 210Pb
xs chronologies were first modeled using a ‘‘Constant Rate of Supply’’ (CRS) model (Appleby and Oldfield, 1978; Sanchez-Cabeza and Ruiz-Fernández, 2012). The ultimate assumption of this model is that the 210Pb