Lab 3: Enzyme Catalysis
OverviewIn this lab you will:
1. Observe the conversion of hydrogen peroxide (H2O2) to water and oxygen gas by the
enzyme catalase.
2. Measure the amount of oxygen generated, and calculate the rate of the enzyme-catalyzed reaction.
3. Design and run an experiment to determine the highest initial rate of reaction using 10mL of fluid (any combination of components you wish, in any conditions).
Objectives:
Before doing this lab you should understand:
The general functions and activities of enzymes;
The relationship between the structure and function of enzymes;
The concept of initial reaction rates of enzymes;
How the concept of free energy relates to enzyme activity;
That changes in temperature, pH, enzyme concentration, and substrate concentration can
affect the initial reaction rates of enzyme-catalyzed reactions; and
Catalyst, catalysis, and catalase
After doing this lab you should be able to:
Measure the effects of changes in temperature, pH, enzyme concentration, and substrate
concentration on reaction rates of an enzyme-catalyzed reaction in a controlled experiment; and
Explain how environmental factors affect the rate of enzyme-catalyzed reactions.
Introduction:
Enzymes are biological catalysts and in general, are proteins produced by living cells. Enzymes speed up chemical reactions by lowering activation energy and benefit cells by allowing them to carry out complex chemical activities at relatively low temperatures.
In biochemical reactions a specific substrate will bind reversibly to the active site of the enzyme, to form an enzyme-substrate complex. One result of this temporary union is a reduction in the energy required to activate the reaction of the substrate molecule so that the
products of the reaction are formed. This can be summarized in the following equation:
Enzyme + Substrate Enzyme-Substrate Complex Enzyme + Product
Note that the enzyme is not changed in the reaction and can be recycled to break down additional substrate molecules. Each enzyme is specific for a particular reaction because its amino acid sequence is unique and causes it to have a unique 3-dimensional structure. The active site is the portion of the enzyme that interacts with the substrate, so that any substance that blocks or changes the shape of the active site affects the activity of the enzyme. A description of several ways enzyme action may be affected follows:
1. Salt Concentration – If the salt concentration is close to zero, the charged amino acid side chains of the enzyme molecules will attract each other. The enzyme will denature and form an inactive precipitate. If, on the other hand, the salt concentration is very high, normal interaction of charged groups will be blocked, new interactions will occur, and again the enzyme will precipitate. An intermediate salt concentration, such as that of human blood (0.9%) or cytoplasm, is the optimum for many enzymes.
2. pH – Amino acid side chains contain groups, such as –COOH and –NH2, that readily gain
or lose H+ ions. As the pH is lowered an enzyme will tend to gain H+ ions, and eventually
enough side chains will be affected so that the enzyme’s shape is disrupted. Likewise, as the pH is raised, the enzyme will lose H+ ions and eventually lose its active shape. Many
enzymes perform optimally in the neutral pH range and are denatured at either an extremely high or low pH.
3. Temperature – Generally, chemical reactions speed up as the temperature is raised. As the temperature increases, more of the reacting molecules have enough kinetic energy to undergo the reaction. Since enzymes are catalysts for chemical reactions, enzyme reactions also tend to go faster with increasing temperature. However, if the temperature of an enzyme–catalyzed reaction is raised still further, a temperature optimum is reached; above this value the kinetic energy of the enzyme and water molecules is so great that the conformation of the enzyme molecules is disrupted. The positive effect of speeding up the reaction is now more than offset by the negative effect of changing the conformation of more and more enzyme molecules. Many proteins are denatured by temperatures around 40-50°C, but some are still active at 70-80°C, and a few even withstand boiling.
or near the active site to change its shape or block it. Many well-known poisons, such as potassium cyanide and curare, are enzyme inhibitors that interfere with the active site of critical enzymes.
The enzyme used in this lab, catalase, has four polypeptide chains, each composed of more than 500 amino acids. This enzyme occurs universally in aerobic organisms. One function of catalase within cells is to prevent the accumulation of toxic levels of hydrogen peroxide (H2O2) formed as
a byproduct of metabolic processes. Catalase may also take part in some of the many oxidation reactions going on in cells. Catalase is found in most cells, even in single-celled eukaryotes like yeast. In the presence of oxygen, yeast breaks sugars down to water and carbon dioxide,
consuming oxygen and in the process making some unintended hydrogen peroxide, which must be removed using catalase. So the yeast have catalase ready to go. When hydrogen peroxide is added to them, it is broken down by the catalase.
Humans, too, must de-toxify hydrogen peroxide produced in the process of our metabolism. We, too, use catalase for this purpose. In this lab, you will use a yeast solution containing catalase and test its catalytic effectiveness on hydrogen peroxide.
The primary reaction catalyzed by catalase is the decomposition of H2O2 to form water and
oxygen gas:
2 H2O2 2 H2O + O2 (gas)
In the absence of catalase, this reaction occurs spontaneously, but very slowly. Catalase speeds up the reaction considerably.
We can learn a lot about enzymes by studying the changes in the rate (kinetics) of enzyme-catalyzed reactions. We can measure the amount of substrate used or the amount of product formed, from the moment the reactants are brought together until the reaction has stopped.
Hypothetical Example:
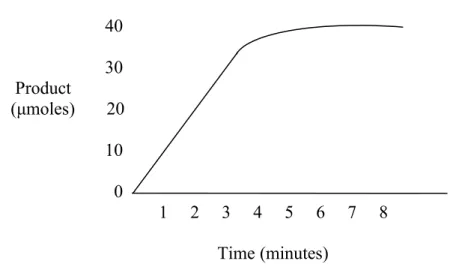
An enzyme and its substrate are mixed in a reaction vessel and the amount of product formed at 30 second intervals is recorded and graphed. A curve like the one in Figure 1 was obtained:
Figure 1. Enzyme Activity
40 30 Product
(μmoles) 20
10
0
1 2 3 4 5 6 7 8
Time (minutes)
Observe the solid line for this reaction. At time 0 there is no product. After 30 seconds, 5 μmoles have been formed; after one minute, 10 μmoles; after two minutes 20 μmoles. The rate of reaction could be given as10 μmoles of product formed per minute for this initial period. Note, however, that by the third and fourth minutes only about 5 additional μmoles of product have been formed. During the first three minutes, the rate is constant. From the third minute through the eighth minute, the rate is changing—it is slowing down. For each successive minute after the first three minutes, the amount of product formed in that interval is less than in the preceding minute. From the seventh minute onward, the reaction rate is very slow.
In the comparison of kinetics of one reaction with another, a common reference point is needed. For example, suppose you wanted to compare the effectiveness of catalase obtained from potato with that of catalase obtained from liver. Would you want to compare the two reactions during the first few minutes when the rate is constant or later when the rates are changing?
Answer: It is best to compare the reactions when the rates are constant.
The slope of a graphed line during this early period is called the initial rate of the reaction. The initial rate of any enzyme-catalyzed reaction is determined by the characteristics of the enzyme molecule. It is always the same for a specific enzyme and its substrate as long as temperature and pH are constant and the substrate is present in excess.
The initial rate of the reaction is the slope of the linear portion of the curve. To determine a rate, pick any two points on the straight-line portion of the curve. Divide the difference in the amount of product formed between these two points by the difference in time between them. The result will be the rate of the reaction which, if properly calculated, can be expressed as μmoles of product/second. This equation is:
μmoles2 - μmole1
t2 – t1
In the graph shown as Figure 1:
30 – 20 = 10 = 0.17 μmoles/second 180 – 120 60
The rate of a chemical reaction may be studied in a number of ways, including the following:
1. Measuring the rate of disappearance of substrate, in this example, H2O2
2. Measuring the rate of appearance of product, in this example, O2, this is given off as a
gas.
3. Measuring the heat released (or absorbed) during the reaction.
In this experiment the generation of the product O2 is measured.
Materials:
• 50mL beaker containing fresh catalase (yeast) solution • reaction chamber
• ring stand & clamp • 10mL graduated cylinder • 100mL graduated cylinder • 3% hydrogen peroxide (H2O2)
• pan (water bath) • pipette
• hot plate • ice
• thermometer • boiled catalase
• buffers of varying pH: 4, 7, 10 • distilled water
General Lab Procedure:
1. At your lab bench you will find a round vial with a rubber stopper top. This is your
reaction chamber. You will also find a 100mL graduated cylinder, ring stand and clamp, and a plastic pan which will be used as a water bath.
2. Fill the pan ¾ full of tap water. Allow the water to come to room temperature.
3. Submerge the 100mL graduated cylinder to fill with water. Turn the graduated cylinder upside down, keeping the open end underwater, so as to keep it filled with water.
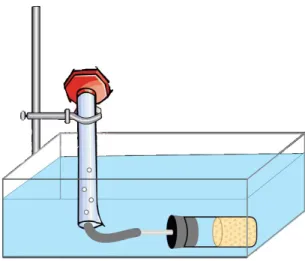
Suspend it upside down in the clamp on the ring stand. Adjust the height of the clamp on the ring stand so the open end of the graduated cylinder is about 3cm above the bottom of the pan. See Figure 2 below:
Figure 2: The General Procedure
Part A: A Time-Course Determination
To determine the course of an enzymatic reaction, you will measure the generation of oxygen gas, a product in the reaction, over time.
1. Set up the experimental apparatus as illustrated and described in the general procedure. 2. Place a thermometer in the pan and record the temperature of the water.
3. Obtain a reaction chamber.
4. Obtain a bottle of 3% H2O2 solution and a 10mL graduated cylinder.
5. Obtain a small amount of stock catalase (yeast) solution in a 50mL beaker. You will need 1.0mL of yeast solution for each trial.
6. Pour 10mL of H2O2 into the reaction chamber. Pipette in 1.0mL of stock catalase
7. Measure the gas levels in the graduated cylinder at 30-second intervals for 5 minutes. Record the levels in a data table of your own design.
8. Plot the data on a graph.
Part B: The Effect of Enzyme Concentration on Enzyme Activity
1. Repeat the experiment from Part A, using 3 different levels of enzyme concentration: 75%, 50%, and 25%.
a. For 75% - use 0.75mL of catalase instead of 1.0mL b. For 50% - use 0.50mL of catalase instead of 1.0mL c. For 25% - use 0.25mL of catalase instead of 1.0mL 2. Record all data in a data table of your own design.
3. Plot the data on the same graph as Part A. Make sure to clearly label the enzyme concentrations on your plotted lines.
Part C: The Effect of Temperature on Enzyme Activity
1. Repeat the experiment from Part A using 3 different temperatures: 5°C, 37°C, and 100°C (boiled catalase).
a. For 5°C – Set up your reaction vessel and water bath and add ice to the water bath so that it is chilled to 5°C for 5 minutes before running the experiment. Keep adding ice to keep the temperature at 5°C or colder.
b. For 37°C – Set up your reaction vessel and water bath with heated water so that it is warmed to 37°C for 5 minutes before running the experiment. Keep adding hot water to keep the temperature at 37°C.
c. For 100°C (boiled catalase) – Instead of keeping the reaction vessel in boiling water during the experiment, which may injure a student, we will instead boil the catalase solution for 5 minutes. Then after the catalase solution has cooled run the experiment in room temperature water (but with already boiled catalase).
2. Record all data in a data table of your own design.
3. Plot the data on a new graph. Also plot on this graph the room temperature data recorded in Part A. Clearly label your axes and plotted lines.
Part D: The Effect of pH on Enzyme Activity
1. Repeat the experiment from Part A using 3 different hydrogen peroxide solutions at 3 different pH values: pH 4, pH 7, and pH 10.
a. For pH 4 – Add 5mL of pH 4 buffer to 5mL of 1.5% hydrogen peroxide. b. For pH 7 – Add 5mL of pH 7 buffer to 5mL of 1.5% hydrogen peroxide. c. For pH 10 – Add 5mL of pH 10 buffer to 5mL of 1.5% hydrogen peroxide. 2. Record all data in a data table of your own design.
Part E: The Effect of Substrate Concentration on Enzyme Activity
1. Repeat the experiment from Part A using 4 different substrate concentrations: 0%, 0.3%, 1.5%, and 3.0%.
a. For 0% - Use 10mL of distilled water only.
b. For 0.3% - Add 3mL of H2O2 to 7mL of distilled water.
c. For 1.5% - Add 5mL of H2O2 to 5mL of distilled water.
d. For 3.0% - This is the concentration of substrate from the original experiment in Part A; just use this initial data.
2. Record all data in a data table of your own design. 3. Plot the data on a new graph.
Part F: The Effect of Ionic Concentration on Enzyme Activity
1. Repeat the experiment from Part A using 3 different ionic concentrations: 10% NaCl, 2%NaCl, and 0% NaCl.
a. For 10% - dissolve 5g of NaCl in 50mL of water then add 5mL of this solution to 5mL of H2O2.
b. For 2% - dissolve 1g of NaCl in 50mL of water then add 5mL of this solution to 5mL of H2O2.
c. For 0% - Add 5mL of distilled water to 5mL of H2O2.
2. Record all data in a data table of your own design. 3. Plot the data on a new graph.
Part G: “The Great Enzyme Race”
Now is your chance to put everything you know about enzymes to the test! Your lab group is faced with the challenge of getting the highest initial rate of reaction using 10mL of fluid, using any combination of components you wish, and at any conditions. Really think about the factors that affect the speed of a reaction… Look at your results from the prior experiments and THINK!
1. Design an experiment to test your prediction. 2. Record all data in a data table of your own design
3. Plot the data on a new graph and calculate your initial rate.
Lab Questions:
1. Summarize the effect of enzyme concentration on enzyme activity. Explain the mechanisms that cause this effect.
2. What would cause the rate of enzyme activity to level off on the enzyme concentration graph?
3. Summarize the effect of temperature on enzyme activity. Explain the mechanisms that cause this effect.
4. Explain the specific effect of boiling the enzyme.
5. What is the optimal temperature for human enzymes?
6. Summarize the effect of pH on enzyme activity. Explain the mechanisms that cause this effect.
7. Do all human enzymes function within the same optimal pH range, like they do with temperature? Explain.
8. Summarize the effect of substrate concentration on enzyme activity. Explain the mechanisms that cause this effect.
9. What would cause the rate of enzyme activity to level off on the substrate concentration graph?
10. Summarize the effect of ion concentration on enzyme activity. Explain the mechanisms that cause this effect.
11. After an enzyme is mixed with its substrate, the amount of product formed is determined at 10-second intervals for 1 minute. Data from this experiment are shown below.
Time (sec) 0 10 20 30 40 50 60
Product Formed (mg) 0.00 0.25 0.50 0.70 0.80 0.85 0.85
a. What is the initial rate of this enzymatic reaction? Show your calculation: b. What is the rate after 50 seconds? Show your calculation:
c. Why is the rate after 50 seconds different from the initial rate?
Alternative Lab 2: Enzyme Catalysis
This laboratory exercise is presented as an alternative to the traditional AP catalysis lab. It has been adapted from a lab created by Kim Foglia, Division Avenue High School, Levittown, and uses a technique developed by Dot Gillespie of Nashua High School.
Time Requirements: Two 90 minute blocks
For teachers short on time you can have all lab groups complete parts A and B and then divide up parts C-F with each lab group taking on one part. Lab groups can then share their data with other groups. When all groups have complete data for parts A-F then students can start their “Enzyme Race.”
Teachers Notes:
The technique is easier for the students to use and yields better results. We use fly vials
stoppered with one-hole rubber stoppers (#7) as reaction chambers. Peroxide is added to the vial and then the students add the yeast mixture (the catalase source) and the whole apparatus is quickly placed in a pan of water. The bubbles generated are collected into the water-filled graduated cylinder and the students measure the volume of O2 generated by the volume of
displaced water.
The vial is a fruit fly vial, but you can use any container that you can stopper, even larger test tubes. You just need a one-hole stopper (to fit whatever vial you use) with a short piece of glass tubing sticking out of the hole. Then attach a length of flexible plastic tubing to that and this will serve as the conduit for the escaping gas bubbles. I got my flexible plastic tubing at the pet store. I use 100mL graduated cylinders to collect the O2.
Yeast is one of the premier industrial microorganisms, because of its essential role in brewing, winemaking, baking, and fuel alcohol production. In addition, yeast has proven to be an excellent model organism for the study of a variety of biological problems involving the fields of genetics, molecular biology, cell biology and other disciplines within the biomedical and life sciences. Yeasts can operate both in the presence and the absence of oxygen. In the presence of oxygen, they break sugars down to water and carbon dioxide, consuming oxygen and in the process making some unintended hydrogen peroxide, which must be removed using catalase. So the yeast have catalase ready to go. When hydrogen peroxide is added to them, it is broken down by the catalase.
Solutions:
Catalase Solution: Use 1 package (7g) yeast in 200-250mL warm water (do NOT add sugar so that bubbling is kept at a minimum before use). Since the procedure requires 100%, then 75%, 50%, 25% of enzyme, I make it easy by starting with 1.0ml of yeast catalase. Then we go from 1.0 to 0.75 to 0.5 to 0.25ml. We use 20ml of peroxide as our starting amount of substrate.
Buffer Solutions:
pH 4 - 100 mL 0.1 M potassium hydrogen phthalate + 0.2mL 0.1 M HCL
pH 7 - 100 mL 0.1 M KH2PO4 + 58.2mL 0.1 M NaOH.