Salters-Nuffield Advanced Biology Resources
Safety checked, but not trialled by CLEAPSS. Users may need to adapt the risk assessment information to local circumstances. Activity 5.1 Student Sheet
THE BRINE SHRIMP ECOSYSTEM
Purpose
To introduce the concept of ecosystems.
To investigate how biotic and abiotic factors affect an ecosystem.
SAFETY
Wash your hands thoroughly after handling the organisms.
A risk assessment should be undertaken when planning any investigation, and both the plan and the risk assessment should be checked by your teacher/lecturer. See CLEAPSS Student Safety Sheet 73.
Procedure
Setting up an ecosystem
Set up your own brine shrimp bottle ecosystem at the start of the topic and observe it either at school/college or at home over a period of weeks, keeping a simple diary. The objective is to get the system working at least long enough to get a second generation. This could take as little as three weeks.
1 Place washed sand and crushed sea shell mix in the bottom of a clear plastic bottle (1–3 litre) to a depth of 2–3 cm.
2 Fill the bottle with salt water (made with 2 g sea salt in 100 cm3 de-chlorinated water). Check the
pH and adjust to pH 8.5 using sodium carbonate.
3 Add 2 large spoonfuls of microbial culture and one drop of liquid fertiliser to the bottle and shake well.
4 Leave the bottle with the lid off on a sunny window sill or under a lamp for about a week until there are signs of green algal growth.
5 Add a pinch of brine shrimp egg cysts. These should hatch within 48 hours and take about two weeks to reach adulthood. Each litre of water in the bottle will support about 12 adult brine shrimps.
6 Once a week while the population is developing add a drop of liquid fertiliser, screw the cap on firmly and roll the bottle gently. When the population has stabilised continue to roll the bottle weekly. Further liquid fertiliser should not be required.
Further information about the care of brine shrimps can be found in the British Ecological Society
Brine Shrimp Ecology book, which can be downloaded free from their website.
At first, the system will be unstable. If the algae do not start to make the water at least slightly green there is a possibility that the system does not have effective primary producers to provide a sustainable food supply and recycle oxygen. This could be due to:
inadequate/unsatisfactory inoculum – get more from your teacher/lecturer
not enough light – reconsider whether or not the bottle is in the best place
not enough mineral salts – consider adding more liquid fertiliser
the temperature being too low or too high – check if the bottle is in the best place
insufficient carbon dioxide and oxygen – unscrew the cap to allow air into the bottle.
Salters-Nuffield Advanced Biology Resources
Activity 5.1 Student SheetInvestigations using the ecosystem
The brine shrimp ecosystem can be used to investigate the effect of a range of different biotic or abiotic factors as outlined below.
1 Brine shrimps and light intensity: Brine shrimps do not themselves need light to grow, yet the algae they feed on do. So what is the indirect effect of light intensity on brine shrimp growth? Using several brine shrimp ecosystems, investigate the effect of light intensity on brine shrimp populations.
2 Brine shrimps and ‘harmless’ herbicide: There are some suggestions in the BES book about a herbicide that is harmless to brine shrimps (and people – full risk assessment is included). It kills the algae, therefore affecting brine shrimp growth by depriving them of food.
3 Brine shrimps and mineral salts: The effect of mild eutrophication on a food chain could be investigated.
Salters-Nuffield Advanced Biology Resources
Safety checked, but not trialled by CLEAPSS. Users may need to adapt the risk assessment information to local circumstances. Activity 5.1 Teacher Sheet
THE BRINE SHRIMP ECOSYSTEM
Purpose
To introduce the concept of ecosystems.
To investigate how biotic and abiotic factors affect an ecosystem.
SAFETY
Ensure students wash their hands thoroughly after handling the organisms. Review the students’ risk assessments and discuss any safety considerations.
Notes on the procedure
Setting up an ecosystem
We introduce brine shrimps to revise GCSE understanding of the ecosystem concept. The terms ecosystem, habitat, biotic and abiotic factor all feature in the specification. Students set up the system, get it working and can complete an investigation as suggested on the Student Sheet. A picture of the bottle ecosystem is in Student Book 2 on page 4 along with revision of key words.
Setting up a bottle ecosystem is described in full in The British Ecological Society (BES) Brine Shrimp Ecology book with photocopiable worksheets, and both teacher and technician notes. The book can be downloaded free from the BES website, which is in the weblinks that accompany this activity. Where students are looking for an investigation they will find the book a source of ideas, techniques and background information, even though the actual worksheets (which form only part of the book) are aimed at pre-GCSE. The investigations are targeted at GCSE rather than A level. There are also data-handling questions more suitable for A level than GCSE.
In this activity, emphasis is on ecological interactions. Open-ended investigations can be used to illustrate the important ecological principle that apparently modest interventions can have more far-reaching effects on an ecosystem than might have been expected.
Salters-Nuffield Advanced Biology Resources
Activity 5.1 Technician SheetTHE BRINE SHRIMP ECOSYSTEM
Purpose
To introduce the concept of ecosystems.
To investigate how biotic and abiotic factors affect an ecosystem.
Detailed instructions on the setting up and maintenance of brine shrimp bottle ecosystems can be found in The British Ecological Society (BES) Brine Shrimp Ecology book, which can be downloaded free from their website (which is in the weblinks that accompany this activity).
It is worth noting that bottles are much more successful if sub-cultured with a good microbial
community; a good dessertspoonful of benthic material from a previous culture mixed with 10 parts of fresh sand and shell is guaranteed to ‘take’ well. The bottle should be stirred, by capping and rolling, to release the benthic nutrients into the open water for the algae.
If students undertake projects, additional equipment will be required. See the BES book for a detailed range of possible activities and requirements.
Brine shrimp eggs and a complete Brine Shrimp Ecology kit are available from Blades Biological. Brine shrimps are also available from pet shops.
SAFETY
If the activities, instructions or materials in the BES book are changed then a separate risk assessment will be needed. Following the BES book should not cause any problems.
Requirements per student or
group of students Notes
A clear, clean plastic bottle between 1 and 3 litres in size
Some sand and shell for the mineral substrate
Some salt water Sea salt and de-chlorinated water (2 g in 100 cm3 water). To de-chlorinate tap water, leave it to stand in an open bowl for at least 48 hours.
Brine shrimp microbial culture Can be sand and shell from another shrimp tank. Some brine shrimps
Liquid fertiliser
Large measuring cylinder
Balance Dessert spoon
Plastic funnel
Salters-Nuffield Advanced Biology Resources
Safety checked, but not trialled by CLEAPSS. Users may need to adapt the risk assessment information to local circumstances. Activity 5.2 Student Sheet
Core Practical
LOOKING FOR PATTERNS
Purpose
To carry out a study on the ecology of a habitat. To develop practical skills.
Observing patterns
Have you ever walked into a wood and noticed that the vegetation changes as you enter? Why do the bluebells only occur under the trees? Or have you been clambering over a rocky shore and spotted that the seaweeds grow in distinctive bands, and that you only find mussels when the tide is far out? What causes these patterns in plant and animal distribution? When ecologists study habitats they try to account for plant and animal distribution, correlating them to the abiotic and biotic factors that are affecting the habitat.
Abiotic means ‘non-living’ and examples of abiotic factors include light intensity, slope, humidity, wind exposure, edaphic (soil) characteristics, such as pH and soil moisture, and many more. Biotic means ‘living’ and examples of biotic factors include competition, grazing and predation. All species of plants and animals you encounter in the wild are very well adapted to the set of conditions
encountered in their usual habitat. If they weren’t they would either grow somewhere else or become extinct.
Studying patterns
Look around your local habitats and spot any patterns in distribution and abundance of organisms. You do not need to go far; you might notice something in your school grounds or the local park. You might have a look at the distribution of plants in trampled areas of the sports field or grass paths; are there any patterns that you could investigate?
1 Scientific questions and information research
State what you are going to investigate – once you have identified a pattern and thought about why it might have come about, you should express this as a question to answer, a problem to investigate or a hypothesis to test.
Research relevant information – once you have described the pattern, you need to use appropriate biological ideas to suggest an explanation for the pattern and to help you decide on the question or hypothesis you are going to investigate. You will also need to research how you will carry out the practical work and methods other people have used to investigate similar problems. Read the information on pages 2 and 3, which briefly mention some of the techniques that could be used. There is more detail in Practical Skills Support Sheet 6 – ecological sampling. You can also look at the weblinks that accompany this activity for more information about sampling techniques. SAPS and the Field Studies Council websites have online resources for students including detailed information on fieldwork techniques.
Salters-Nuffield Advanced Biology Resources
Activity 5.2 Student Sheet Core Practical2 Planning and experimental design
Design an experiment that you can use to complete your investigation – use the Developing Practical Skills Support on SNAB Online to help you plan a fieldwork investigation to test your idea.
When planning any investigation you need to: decide what data you are going to collect
select a procedure that uses suitable apparatus and methods to test your question or problem say what measurements you will make, how they will be made, and the level of accuracy that you
can expect in your measurements
ensure you are going to collect valid data
identify any variables that may affect the outcome of the experiment and, where possible, controls or allows for them
identify any potential sources of error (systematic or random) and how errors can be minimised. decide how you will analyse the data once it has been collected
complete a risk assessment and decide on steps to avoid or minimise any risks, including both risks to the organisms and environments being sampled (injury, death, discomfort, damage) and any risks for the researcher undertaking the investigation
conduct a trial to inform your planning.
Have your plan checked by your teacher/lecturer before you start the fieldwork.
3 Carrying out practical work safely and ethically
Either use the plan you have created after it has been checked by your teacher/lecturer or use a method supplied by your teacher/lecturer. If unexpected ethical or safety issues arise deal with them sensibly, taking advice where needed and make a note of them. Note any possible errors.
4 Analysis and interpretation of data
When you have collected your data, you must present it in an appropriate way to help you to identify any patterns in the data. For transect data you can draw kite diagrams by hand or use a computer programme.
Analyse your data to reveal any patterns and explain the main relationships between species and abiotic factors, using scientific knowledge and statistics. Determine if your original hypothesis was correct. If you are comparing mean values for two sites you can determine if there are significant differences between the means by using a t-test. If you have suitable data, you can calculate correlation coefficients between your biotic and abiotic data. For example, you can see if there is a significant positive or negative correlation between the factor you think is responsible for the pattern and the distribution of the organisms you have recorded. Remember that correlations do not prove cause and effect.
For information on correlation coefficients, t-tests and other statistical techniques see the Maths and Stats Support.
5 Conclusion and evaluation
In your write-up, interpret your results using biological principles and concepts. Support any
Salters-Nuffield Advanced Biology Resources
Safety checked, but not trialled by CLEAPSS. Users may need to adapt the risk assessment information to local circumstances. Activity 5.2 Student Sheet
Core Practical
Some techniques for studying patterns
Completing a transect study
One of the easiest patterns to spot is zonation in vegetation and animal distribution – as you go from one place to another the vegetation and animal distribution changes. A zonation can often be explained by a gradual change (a gradient) in one or more physical or abiotic factors. A transect is often used to study zonation in vegetation or non-mobile animal distribution. A transect is a line along which systematic samples can be taken (Figure 1) usually using quadrats to determine the areas where the distribution and abundance of an organism will be sampled.
When planning a transect study you need to be sure you are collecting valid data that will test your hypothesis. You need to make the following decisions.
The most appropriate sampling method to use (for example, random or systematic sampling). The position and length of any transect to use. You need to make sure your transect extends far
enough to sample all the possible zones.
The size and number of quadrats to use, and their positioning.
The species of plants and animals you are to record. You can focus on those which would enable you to test the hypothesis under investigation (you may need to find out more about the species concerned using secondary sources).
The method to use for measuring the abundance of each species.
The abiotic factor(s) you are going to record. Although you may be investigating the correlation between, for example, soil moisture and the distribution of plant species, there may be other factors that could affect the distribution of organisms. It is not possible to control these variables, but you can measure them and take them into account when analysing your results.
The appropriate method for measuring the abiotic factor(s). How the data will be analysed.
How to avoid or minimise any risks when completing the fieldwork.
A pilot study in advance of the main data collection will help you make these decisions.
For details on sampling techniques, see Practical Skills Support 6 – ecological sampling – and the weblinks that accompany this activity for more detail on the use of quadrats and other sampling techniques.
Figure 1 One way of laying out a tape measure for a transect study. Quadrats are laid down at regular intervals along the tape and the abundance of species within each quadrat is recorded.
Comparing two sites
Frequently, ecologists may notice a distinct pattern that does not show a gradual change and may be related to one or more factors at the two sites. For example, the vegetation in one area of a field may be very different to the rest of the field, or the species found upstream and downstream of an outflow pipe discharging into a river may seem to differ. A transect may not be the best method for this type of investigation; instead random sampling of each area may be more appropriate with comparison of the data collected for each area. Quadrats are frequently used to sample a larger area: information
Salters-Nuffield Advanced Biology Resources
Activity 5.2 Teacher Sheet Core PracticalLOOKING FOR PATTERNS
Purpose
To carry out a study on the ecology of a habitat. To develop practical skills.
SAFETY
Teachers/lecturers must follow their LEA/school/college policy and local rules for off-site visits, especially with regard to identification of hazards and risk assessments.
The hazards will vary depending on the site chosen. Risk assessments will minimise the risk.
Notes on the procedure
Students need to carry out a study on the ecology of a habitat to produce valid data, including the use of quadrats and transects to assess the abundance and distribution of organisms, and the measurement of abiotic factors. The Student Sheet outlines how to approach a fieldwork investigation. It briefly mentions some techniques that might be used. It does not attempt to provide detailed accounts of the techniques. Additional details are provided on Practical Skills Support Sheet 6 – ecological sampling on SNAB Online, on the SAPS website in post-16 Ecology resources and on the Field Studies Council website. The methods used will depend on the habitat and factors under investigation. Any suitable methods could be used that give students the opportunity to have first-hand experience of field data collection. The school/college grounds can be a valuable resource.
Activity 5.3 includes details of fieldwork to study succession. Other activities could be covered in a fieldwork context; for example, feeding relationships and the transfer of energy through ecosystems could be investigated through a specific habitat.
The interactive tutorial that accompanies this activity allows students to become familiar with
sampling techniques before undertaking fieldwork themselves. A Microsoft Excel® spreadsheet which
can be used to produce kite diagrams is included with the resources. Students could plan the
investigation themselves, but then work cooperatively to collect data. At the planning stage encourage students to decide on the statistical analysis they will use. The Developing Skills Framework available in the Practical Skills Support will help when planning.
Select a site carefully
The site selected should show some clear relationships. Some examples where transects can be used:
A playing field or grassy area from an area of high trampling to an area of low trampling. Woodland margin – passing from a field or other example of grazed or mown grassland through
brambles into a wood. The key gradient is likely to be light – but it may not be the only one. A sand dune system from the shore across dunes into grassland and scrub as you go further inland.
In this case, the key factors could be soil moisture, soil stability and organic matter although succession is also involved here.
A rocky shore from the low tide mark to the top of the beach. The key factor is the proportion of time a part of the shore is left exposed to the air and to desiccation when the tide is out.
Salters-Nuffield Advanced Biology Resources
Safety checked, but not trialled by CLEAPSS. Users may need to adapt the risk assessment information to local circumstances. Activity 5.2 Teacher Sheet
Core Practical
Some examples where two sites can be compared: grazed and ungrazed grassland
mowed and unmowed grassland trampled and untrampled grassland fertilised and unfertilised lawns shaded and sunny sites
fast- and slow-flowing streams chalk and sandy soil sites
understories of beech and oak woodlands.
Identification – don’t panic!
Identification is not as big a problem as you may think. The only species students need focus on are those that would support the hypothesis under investigation. Trying to identify each species in a quadrat down to the tiniest piece of moss can be a poor use of time and can actually prevent students from ‘seeing the wood for the trees’.
A transect at a woodland margin could be successfully done recording only tree cover, grass, brambles, nettles, ivy, bare ground, wild garlic (with give-away smell) and bluebells, together with good light meter reading and soil pH (often showing no pattern), especially if you start to consider something like leaf surface area of brambles at the same time.
However, the principles are:
Select a site where you can cope with the species identification.
Before teaching students to identify another species ask yourself ‘What is the ecological point of teaching this?’.
Make use of expert help if available – this could include a Field Study Centre.
The Field Studies Council produce excellent laminated guides to aid with field identification in particular habitats.
The students will be relying on you for identification so careful preparation is important. You may wish to produce a record sheet which includes the species you want to focus on.
Class organisation
Students can work in groups. The smaller the group the more ‘ownership’ by individuals, whilst the larger the group the more quadrats can be recorded, and the bigger and statistically more meaningful the picture produced. A good size is six – working as three pairs. It helps if the whole group can have access to a computer as soon as possible after collecting the data and to a full set of equipment during data collection. Waiting to borrow equipment from other groups wastes a lot of time and loses momentum.
Salters-Nuffield Advanced Biology Resources
Activity 5.2 Technician Sheet Core PracticalLOOKING FOR PATTERNS
Purpose
To carry out a study on the ecology of a habitat.
To develop practical skills.
SAFETY
Teachers/lecturers must follow their LEA/school/college policy and local rules for off-site visits, especially with regard to identification of hazards and risk assessments.
The hazards will vary depending on the site chosen. Risk assessments will minimise the risk.
The standard equipment required for carrying out an ecological study is detailed below. Additional items required to measure abiotic factors will depend on the site selected and type of study being undertaken.
Requirements per student or
group of students Notes
A 10–20 m tape measure A piece of rope with 0.5 m intervals marked on it will also work.
A quadrat Either square or point quadrats can be used. Square frame quadrats
with subdivisions are useful. The ‘standard’ square frame quadrat is 50 cm × 50 cm, but smaller and larger ones can be used.
A clipboard
A clear plastic bag large enough to get clipboard and hand with pencil in
So that students’ notes are not damaged by rain.
Ranging poles The geography department may have these already.
A clinometer The geography department may have one already.
Small plastic vials or dishes For holding invertebrates while identifying them on site or taking soil samples for later pH testing. Old camera film pots are ideal for soil samples.
A key to organisms likely to be found in the area
The Field Studies Council produces a range of excellent laminated identification guides.
Access to a compass To describe the aspect.
Access to an OS map of the area To accurately pinpoint the site and for background knowledge.
Small numbered pegs At least 50.
Jam jars For pitfall traps.
Pooter Sweep net
Thermometer For air and soil if possible.
Hygrometer Light meter
Soil pin/old knitting needle To measure soil depth.
30 cm ruler To measure leaf/stem characteristics such as inter-nodal length etc.
Salters-Nuffield Advanced Biology Resources
Safety checked, but not trialled by CLEAPSS. Users may need to adapt the risk assessment information to local circumstances. Activity 5.3 Student Sheet
SUCCESSION
Purpose
To summarise the events in succession to a climax community.
What is succession?
Succession is an ecological process that goes on all around us, but can easily be overlooked. At a particular field site you get a snapshot of the community, and you cannot see what it was like in the past and how it has changed over time. It is possible to make observations over time, revisiting the same site and collecting data each year, or simply clearing an area of the school grounds so that bare soil is exposed, and making regular observations. For more information on making direct observations over time see Field investigations of succession on page 3.
Seeing succession on sand dunes
Sand dunes can offer an excellent introduction to succession because as you move inland from the beach you are effectively travelling back in time. The different stages in the succession can be identified as a series of zones. This provides an opportunity to study the changing community and associated abiotic factors that determine which species are present. A grouse moor that has been burned can also show the stages of succession; see the case study notes.
The best way to investigate succession on dunes is to visit a good example, and consider the plant distribution across the dunes and relate this to the abiotic factors. When studying these types of gradual changes in a habitat the most effective method is to sample along a transect. For more details of how this is done, see Practical Support 6 Ecological sampling.
If you are not lucky enough to be able to visit one of the magnificent dune systems around the coast then you can use the interactive tutorial that accompanies this activity to help you to understand how succession works on sand dunes.
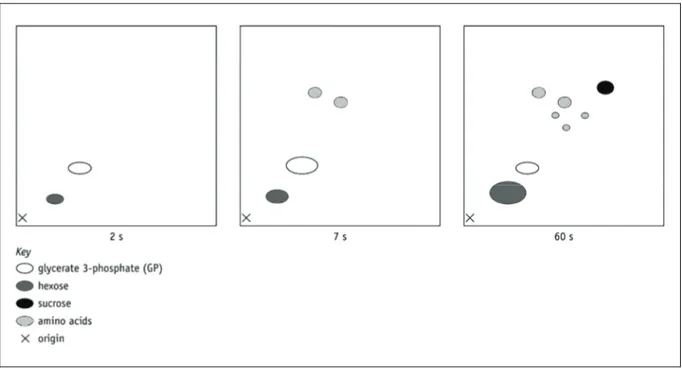
Work through the interactive tutorial on sand dune succession and then complete the questions below. Q1 Analyse the transect data collected on the dunes at Morfa Harlech on the Welsh coast near the
Drapers’ Field Centre. The point quadrat data and the abiotic data are available in the
Microsoft Excel Spreadsheet 1: this can be entered into Spreadsheet 2, which enables you to draw kite diagrams representing the distribution of species along the transect.
a Print out the kite diagrams and highlight the following: i pioneer species
ii species that appear to be dominant at each site.
b The hollows between the dune ridges are known as slacks. On the kite diagrams highlight the slack sites and add a note explaining why the vegetation changes abruptly here. Your explanation should refer to the abiotic data.
c Suggest a reason for the pattern of marram grass distribution.
Q2 Annotate the sequence of diagrams in Figure 1 to explain how succession happens on sand dunes.
Add notes on abiotic and biotic factors at each of the stages in sand dune succession to produce a summary. It should refer to the following:
● colonisation
● which species are dominant at each stage ● the species richness (number of species present)
● any adaptations of individual species that you have researched.
Salters-Nuffield Advanced Biology Resources
Activity 5.3 Student SheetFigure 1 Summary of sand dune succession.
Q3 a Use the sequence of diagrams in Figure 2 to explain the role of marram grass in sand dune formation.
Salters-Nuffield Advanced Biology Resources
Safety checked, but not trialled by CLEAPSS. Users may need to adapt the risk assessment information to local circumstances. Activity 5.3 Student Sheet
b List the ways in which the growth of marram grass may change the local biotic and abiotic conditions on a sand dune.
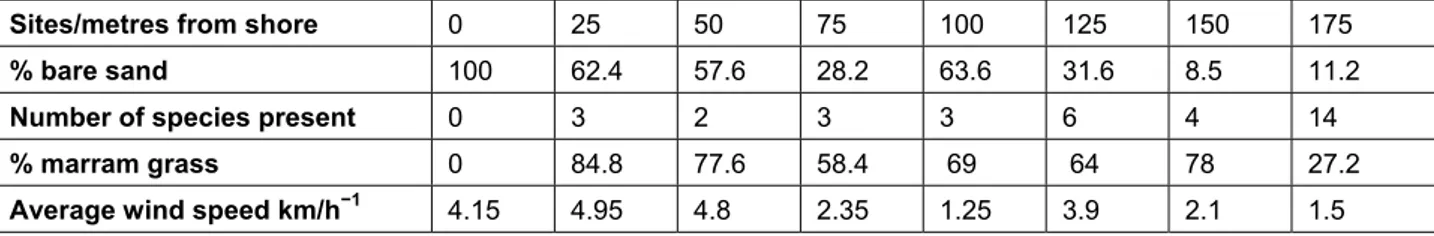
Q4 a Use the data in Table 1 to suggest an explanation for the trend of decreasing percentage of bare sand with distance from the shore.
b Suggest one reason for the abrupt decrease in percentage plant cover at 100 metres. c Explain why marram grass is a dominant species at the 25 and 50 metre sites, but is less
abundant at the last site, 175 metres from the shore.
Sites/metres from shore 0 25 50 75 100 125 150 175
% bare sand 100 62.4 57.6 28.2 63.6 31.6 8.5 11.2
Number of species present 0 3 2 3 3 6 4 14
% marram grass 0 84.8 77.6 58.4 69 64 78 27.2
Average wind speed km/h−1 4.15 4.95 4.8 2.35 1.25 3.9 2.1 1.5
Table 1 Data from a transect taken across a second sand dune system.
Field investigations of succession
Direct observation of succession involves keeping records of the same site over time and this usually involves marking out permanent quadrats – often by knocking pegs into the ground – and going back every few weeks, months or years to make new records and see what has changed. However, it is possible to set up permanent quadrats, which are surveyed by each new group of students and compared with previous years’ data.
The example in Student Book 2 on Shetland (page 11) has been marked and recorded for over 35 years. This, of course, does not fit well into the constraints of a one- or two-year course.
Observations in school grounds
An area of school grounds can be cleared leaving bare ground, or an area of lawn can be left unmown. Permanent quadrats measuring 1 × 1 m can be marked out with pegs and recorded, perhaps by
estimating percentage cover and counting the number of individual plants. The point quadrat method (see Practical Support 6 Ecological sampling) could be particularly appropriate at the beginning of succession since it yields very reproducible results, but it may become impractical as the vegetation begins to get tall. Photographic records can also be worth keeping. This type of study is not too time-consuming and could be done in normal lesson time. It is much more interesting if it complements fieldwork in other habitats.
Salters-Nuffield Advanced Biology Resources
Activity 5.3 Student SheetCase studies
Secondary succession on a grouse moor
The advantage of a burned grouse moor as a place to study succession is that it is a relatively simple ecosystem with a limited number of easily identified species.
Gamekeepers burn moorland in order to increase the supply of young, green heather shoots, which are eaten by red grouse (Figure 3).
Figure 3 The red grouse is a subspecies endemic to (only found in) Scotland and northern England where it is thought to have evolved from the willow grouse, which is more widely distributed in northern Europe.
Grouse shooting became widespread in the nineteenth century when it became fashionable amongst the upper classes. Today a surprising number of people will pay considerable sums to spend a day grouse shooting. This is why large areas of northern England and Scotland are managed for grouse shooting. Left to grow naturally, heather (Calluna vulgaris) becomes a straggling, woody bush. As it grows, a greater and greater proportion becomes wood with less and less of the tender green shoots that the grouse eat. Burning the moor and then letting the heather regenerate ensures that there are plenty of tender green shoots. Maximising food supply for the grouse maintains a much higher grouse population than would otherwise be the case. If grouse shooting were to cease, the National Park authorities of the Yorkshire Dales and the North York Moors might well continue to burn moorland in order to maintain the kind of landscape tourists expect to see.
The field study
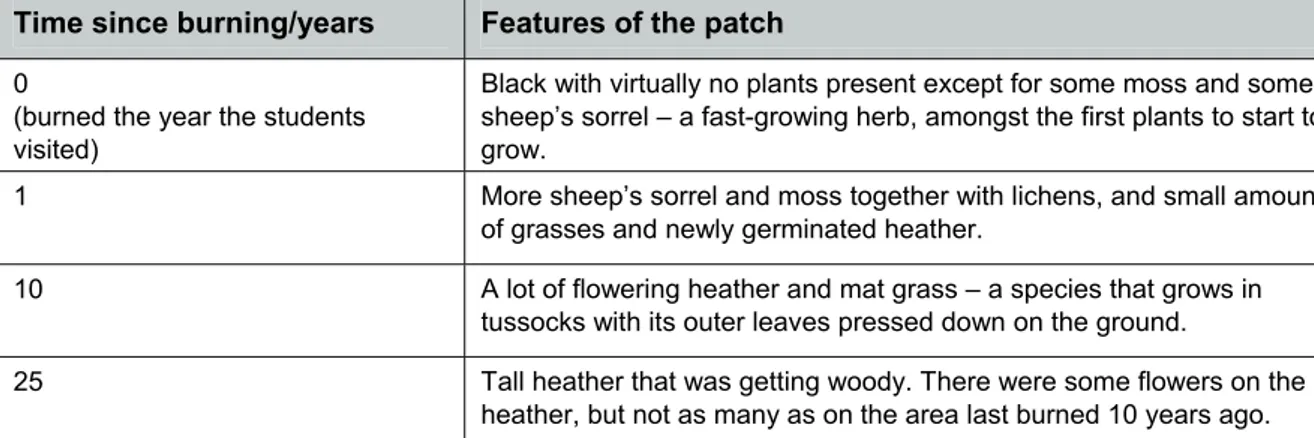
A group of students were given permission by the gamekeeper of a moor to study the moorland vegetation on days when no shooting was taking place. He showed them a patchwork of heather where areas had been burned at different times and told them when each area was last burned. The patches had distinct plant communities depending on the time since burning (Table 2).
Salters-Nuffield Advanced Biology Resources
Safety checked, but not trialled by CLEAPSS. Users may need to adapt the risk assessment information to local circumstances. Activity 5.3 Student Sheet
Time since burning/years Features of the patch
0
(burned the year the students visited)
Black with virtually no plants present except for some moss and some sheep’s sorrel – a fast-growing herb, amongst the first plants to start to grow.
1 More sheep’s sorrel and moss together with lichens, and small amounts
of grasses and newly germinated heather.
10 A lot of flowering heather and mat grass – a species that grows in
tussocks with its outer leaves pressed down on the ground.
25 Tall heather that was getting woody. There were some flowers on the
heather, but not as many as on the area last burned 10 years ago.
Table 2 Descriptions of the plant communities in areas with increasing length of time since the moor vegetation was burnt.
The exercise allowed the students to reconstruct the likely successional sequence. However, only long-term studies using permanent quadrats can provide full information. The peak of mat grass after 10 years, for example, could have been because the soil in that part of the moor where the quadrat was placed happened to be different – a possible alternative to the successional theory.
Figure 4 Reconstructing grouse moor succession.
Q1 Suggest reasons for the changes in percentage cover of each species shown on the graph. Q2 Suggest a reason for the decline in fresh biomass after more than 20 years since the last
burning.
Salters-Nuffield Advanced Biology Resources
Activity 5.3 Student SheetMeasuring succession to help plan the management of a local nature reserve
The following pieces of work were done with the help of sixth-form students.
The short turf in a woodland clearing had a high biodiversity, including many interesting flowering plants, which supported a large variety of insects. There were small saplings of prickly shrubs, hawthorn and wild rose growing in the clearing, and it was feared that the surrounding scrub was encroaching on it. Those responsible for managing the nature reserve needed to know if the vegetation in the clearing was changing and if mowing would be needed to maintain the biodiversity. A row of pegs 1 m apart was knocked into the ground, making a permanent transect. Each time the records were made, a measuring tape was laid alongside the pegs. The height of each prickly shrub sapling touching the tape was measured and the average height for each 1 m section was recorded. This was repeated over several years. The outcome was that the average height and density of the prickly shrubs was actually constant (most were only 10 to 15 cm tall, but there were taller ones around the edge of the clearing). No succession appeared to be taking place. There was no threat to the biodiversity of the clearing and so the recommended management was non-intervention rather than scrub clearance or mowing, but with continued monitoring using the permanent transect.
Measurements of soil depth (using a metal rod) along the transect revealed that the soil in the centre of the clearing was very shallow, and that the reason why the hawthorn and rose shoots got shorter towards the centre of the clearing was nothing to do with succession, but because of a soil depth gradient. Historical research found that the name of the place (the ‘Batts’) in local Middle English dialect meant ‘islands in a river’ and inspection of a seventeenth century map belonging to the landowner confirmed that the river used to be much wider with small islands in it. The clearings were probably on what had once been gravel banks in the river. But this was not the whole story. A fence was erected in the clearing to keep rabbits and deer out of a 1 m2 area. Observations over one growing
season found the grass to be very much taller inside the fenced area than in the rest of the clearing. Such rapid growth of grass would shade the small plant species that are part of the biodiversity. Clearly, succession was being held back in the clearing not only by shallow soil depth, but also by grazing by rabbits, deer or both.
Questions
Q1 Suggest the management strategy that the nature reserve should adopt to maintain the biodiversity of the site. Explain the reasons for your suggestion.
Q2 Suggest what might be the consequences for the central area of the clearing if the prickly shrubs and saplings grow taller.
Q3 State the name used to describe succession held back by human activity.
Salters-Nuffield Advanced Biology Resources
Safety checked, but not trialled by CLEAPSS. Users may need to adapt the risk assessment information to local circumstances. Activity 5.3 Teacher Sheet
SUCCESSION
Purpose
To summarise the events in succession to a climax community.
What is succession?
The web-based activity is provided to help students to understand the process of succession and to produce a summary of the sequence of events for a sand dune succession. The Drapers’ Field centre data allow students to analyse the changes over time in a plant community and the conditions at each stage in the succession.
In the case of a sand dune transect, it is important to make students aware that, although this is a useful exercise in reconstructing the past, it is still an indirect way of studying succession. The sand dune system is a zonation and in this case the variable that largely explains this zonation is time. The rocky shore is also a zonation, but one that has nothing to do with succession. If the sand dune succession really is pushing back the sea then we might expect to find traces of marram grass beneath the scrub. A virtual sand dune transect is available in the weblinks that accompany this activity.
There are two additional sheets. The first – Field investigations of succession – provides an idea for a fieldwork investigation in school/college grounds. The second – Case studies – provides descriptions of two studies of succession, applying the ideas of succession to other habitats; one on a grouse moor and the other in a woodland clearing, each of which is followed by questions. After completing the first half of the activity as a group, these could be used as a homework assignment or as a test to check student ability to apply knowledge and understanding.
Answers: Seeing succession on sand dunes
Q1 a i Pioneer species are sea rocket and prickly saltwort. ii
Station 1 2 3 4 5 6 7 8 9 10
Location high drift embryo dune 1st ridge 1st hollow 2nd ridge 2nd hollow high dune dry slack wet slack dune scrub Dominant species sea rocket sand couch grass marram grass red fescue marram grass red fescue marram grass other grasses sand sedge/ creeping willow trees/ gorse Number of species present
2 3 6 11 10 18 12 15 9 13
Table 1 Dominant species at each station.
b Higher soil moisture and organic content in the slacks.
c Marram grass is dominant where the conditions are harsh (low soil moisture and organic content, higher wind speed). It is well adapted to cope with these conditions.
Salters-Nuffield Advanced Biology Resources
Activity 5.3 Teacher SheetQ3 a
b Dead plant material increases organic matter present. Organic matter allows sand to hold more water; drainage is decreased. The sand can hold more mineral ions as there is less leaching. Insects and other herbivores arrive to graze on grass. The number of
decomposers and microorganisms increases as dead organic matter builds up. The sand is stabilised by the roots, so does not blow around so much. This allows other plants to take root.
Q4 a The overall trend is that the percentage of bare sand decreases. The wind speed decreases with distance from the shore, providing a more sheltered habitat. As conditions become less harsh, more species are able to colonise and ground cover increases, reducing the percentage of bare sand. The number of species increases, suggesting that conditions are favourable for a greater range of species. The decrease in percentage of bare sand is not constant because the side of the dune facing the shore will be more exposed to wind and salt spray, and the tops of the dunes will be most exposed so they are likely to have more bare sand.
b This site could be at the top of a dune, in a more exposed site. Or it could represent a dune slack or damage to the vegetation by people.
c Marram grass is a pioneer species in this system. It is one of few species that can survive the harsh conditions near the shore. As the dune system develops, conditions become less harsh and more species are able to survive. These species out-compete the marram grass at 175 m because they are better adapted to the conditions present here. In the climax community, it is likely that trees will be dominant.
Field investigations of succession
Many schools and colleges take their classes to the same sites each year and sometimes an opportunity is missed to build up a valuable data set about ecological change, because the students’ records are not archived. The work in Shetland referred to in Student Book 2 (page 11) involves permanent quadrats going back over 30 years, identified with markers supplied by Scottish Natural Heritage, which are designed to remain in place for centuries.
If students do survey permanent quadrats the task has to be such that inexperienced students can work with the required degree of accuracy whilst finding it a challenging activity.
Being part of long-term data collection and incorporating new data into the long-term data set is an excellent way of learning about succession and other ecological processes.
Salters-Nuffield Advanced Biology Resources
Safety checked, but not trialled by CLEAPSS. Users may need to adapt the risk assessment information to local circumstances. Activity 5.3 Teacher Sheet
Nettlecombe Court is a Field Studies Council Centre in north Devon. Since 1968, a mowing
experiment has been carried out in the grounds of the centre. Students on field courses have used these experimental plots to learn sampling skills. In the process they have contributed to the collection of what is now a classic long-term data set of which ecologists wish they had more.
Crothers, J.H. (1991) The Nettlecombe Grassland Experiment. Field Studies 7, 687–717. Offprints available from FSC publications, Field Studies Council, Preston Montford, Shrewsbury, SY4 1HW. FSC also produce excellent laminated identification guides.
Answers: Case studies
Secondary succession on a grouse moor
Q1 The first species to reappear was sheep’s sorrel because of its rapid germination and rapid growth rate. It behaved as a pioneer species, taking advantage of the reduced competition from larger species. Moss does not decrease to zero with burning, so quickly re-grows. Both sheep’s sorrel and moss disappear as the larger plants get established, as they are probably unable to compete for light.
Mat grass was well established after five years and may have been competing at this time with the sheep’s sorrel. Mat grass grows in tussocks and its outer leaves press down on the ground, suppressing the opposition. As the heather grows, it becomes taller than the mat grass and shades it. By 25 years the mat grass had disappeared and the heather was the dominant species. Q2 At 20 and 25 years after burning, the vegetation is dominated by heather. The biomass
probably declined after 20 years because the heather was becoming increasingly straggly. Some evidence for this is provided by the slight rise from 20 to 25 years after last burning in the percentage cover of moss. This rise suggests that the heather is less dense, allowing light to reach the ground.
Q3 Sheep prefer heather to mat grass. It is likely that too high a grazing pressure by sheep greatly reduces heather cover, allowing mat grass to dominate.
Measuring succession to help plan the management of a local nature reserve
Q1 The recommended management strategy would be non-intervention with continued monitoringusing the permanent transect. Grazing by rabbits, deer or both would prevent any succession. Q2 Tall shrubs or trees would shade the central clearing, altering conditions in this area. This
might affect which plants grow in the shade. Q3 Deflected succession.
Follow-up projects from the grouse moor case study
Some students used this exercise as the starting point for individual projects.
pH and succession
Salters-Nuffield Advanced Biology Resources
Activity 5.3 Teacher SheetHeather and mat grass
Another student measured the diameter of the mat grass tussocks and the average height of heather in a number of randomly placed quadrats. Her data supported her prediction that there was a negative correlation between the two variables. She suggested that this supported the idea of competition between the two species.
Woody versus green tissue in heather
Salters-Nuffield Advanced Biology Resources
Safety checked, but not trialled by CLEAPSS. Users may need to adapt the risk assessment information to local circumstances. Activity 5.4 Student Sheet
PHOTOSYNTHESIS
Purpose
To summarise the light-dependent and light-independent reactions of photosynthesis. To relate the structure of chloroplasts to their role in photosynthesis.
Procedure
Use the interactive tutorial on photosynthesis, which accompanies this activity and Student Book 2 to complete this sheet, which includes summary diagrams of the light-dependent and light-independent reactions. The interactive tutorial provides an overview of the reactions; the Student Book gives additional detail: you need to consult both.
The light-dependent reactions
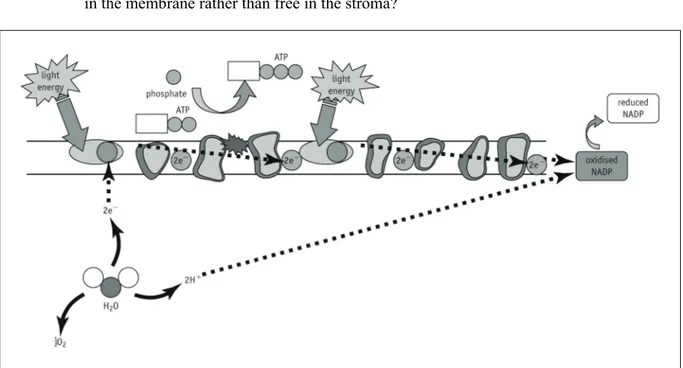
Q1 Examine Figure 1, which represents the key light-dependent reactions in photosynthesis. Summarise the processes occurring at stages 1–8.
Figure 1 Summary of the light-dependent reactions.
Salters-Nuffield Advanced Biology Resources
Activity 5.4 Student SheetQ3 a What is the final destination of the electrons that leave chlorophyll in PSI and pass along the electron transport chain?
b On Figure 2, label the thylakoid membrane, chlorophyll molecules in PSI and PSII, electron carriers, stroma and the inside of the thylakoid.
c Add numbers 1–8 to Figure 2 to show where the processes in the summary you produced in question 1 take place in the chloroplast.
d What is the advantage in having the chlorophyll and electron carrier molecules embedded in the membrane rather than free in the stroma?
Figure 2 The location of the light-dependent reactions of photosynthesis.
The light-independent reactions
Q4 a Alongside each of the compounds in the Calvin cycle in Figure 3 draw in the correct number of squares to represent the carbon atoms in the compound, for example:
5-carbon compound
1-carbon compound
b Fill in the boxes below the cycle, giving one example in each box of the different types of organic molecule that a plant might synthesise from glyceraldehyde 3-phosphate (GALP). In each case make a note of any additional elements (not present in the sugars) that are needed for the synthesis of these molecules and suggest how the plant obtains these. c Summarise the processes occurring at each of the numbered stages in the diagram of the
Salters-Nuffield Advanced Biology Resources
Safety checked, but not trialled by CLEAPSS. Users may need to adapt the risk assessment information to local circumstances. Activity 5.4 Student Sheet
Figure 3 The light-independent reactions of the Calvin cycle.
Photosynthesis summary
Q5 a Name the products that are generated during the light-dependent stage.
……….……….…
b Which of these is a waste product?
……….……….…
c Describe the roles of the other products.
……….……….…
……….……….…
d Why is ATP generated rather than using light energy directly to synthesise carbohydrate?
……….……….…
……….……….…
e How many molecules of carbon dioxide need to be fixed in order to produce a molecule of glucose?
Salters-Nuffield Advanced Biology Resources
Activity 5.4 Student SheetQ6 a Add the following labels and annotations to Figure 4 (you can use the interactive cell in Activity 3.1 to help with this). Parts vi to ix require you to identify places where events occur:
i stroma
ii granum
iii thylakoid membrane iv thylakoid space
v outer membrane of chloroplast vi electron transport chain vii splitting of water
viii synthesis of ATP and reduced NADP ix Calvin cycle
Figure 4 A chloroplast.
b How does the presence of organelles, such as chloroplasts, lead to greater efficiency in biochemical pathways within cells?
……….……….…
……….……….…
……….……….…
Q7 Explain why ‘light-independent reactions’ is a better description of the Calvin cycle than ‘dark reactions’.
……….……….…
……….……….…
Salters-Nuffield Advanced Biology Resources
Safety checked, but not trialled by CLEAPSS. Users may need to adapt the risk assessment information to local circumstances. Activity 5.4 Student Sheet
Extension
Q8 Read about the light-dependent reactions in Extension 5.6.
a ‘Photo’ means light, and ‘lysis’ means splitting. Explain why, even though light energy is not directly transferred to the water molecule, photolysis is an appropriate term for the splitting of water that takes place in a thylakoid.
Salters-Nuffield Advanced Biology Resources
Activity 5.4 Teacher SheetPHOTOSYNTHESIS
Purpose
To summarise the light-dependent and light-independent reactions of photosynthesis.
To relate the structure of chloroplasts to their role in photosynthesis.
Notes on the procedure
This Student Sheet is intended for use with the interactive tutorial on photosynthesis, which
accompanies this activity. Student Book 2 and the interactive cell can also be used for completion of the sheet.
Depending on time available a selection of the sheets could be completed.
Answers
Q1 Stage 1: Light energy is absorbed by chlorophyll. Electrons in chlorophyll are excited (raised to a higher energy level).
Stage 2: Electrons are lost from the chlorophyll molecule (and are transferred to electron carriers in the thylakoid membrane).
Stage 3: Electrons are passed between carriers in the electron transport chain (on the thylakoid membrane).
Stage 4: Energy released during the transfer of the electrons along the electron transport chain is used to synthesise ATP.
Stage 5: Water molecules in the thylakoids are split into electrons, hydrogen ions and oxygen, using energy from sunlight (photolysis).
Stage 6: The electrons from water replace the electrons lost from the chlorophyll molecule to the electron transport chain.
Stage 7: NADP is reduced by the addition of electrons that pass along the electron transport chains and hydrogen ions.
Stage 8:Oxygen from the splitting of water is lost as a waste product.
Q2 Need to include two chlorophyll molecules, photosystem I and II, with associated electron chains. ATP formed on the first electron transport chain. Reduced NADP formed at the end of the second electron transport chain.
Q3 a Reduced NADP.
Salters-Nuffield Advanced Biology Resources
Safety checked, but not trialled by CLEAPSS. Users may need to adapt the risk assessment information to local circumstances. Activity 5.4 Teacher Sheet
d The positioning of the chlorophyll and electron carriers in the thylakoid membrane allows rapid transfer of electrons from the chlorophyll along the chain of carriers in the correct sequence.
Q4 a and b (see figure below)
c Stage 1: Carbon dioxide is ‘fixed’ – it combines with 5-carbon ribulose bisphosphate, RuBP.
Stage 2: The unstable 6-carbon compound formed by the previous reaction breaks down into two 3-carbon compounds (GP).
Stage 3: ATP provides the energy for the reduction of the 3-carbon compound. Stage 4: Reduced NADP reduces the 3-carbon compound (GP is converted to GALP). Stage 5: Some GALP is used to regenerate ribulose bisphosphate and some is removed from the cycle. Each turn of the cycle produces one net carbon that can be removed from the cycle.
Stage 6: ATP is used to regenerate ribulose bisphosphate. Q5 a ATP, reduced NADP and oxygen.
b Oxygen.
c ATP provides the energy for the reduction of CO2 and the phosphate group for the
regeneration of ribulose bisphosphate. Reduced NADP reduces the CO2.
d ATP is an energy transfer molecule within cells; it allows small quantities of energy to be moved around the cell from energy-yielding reactions to energy-requiring reactions.
Salters-Nuffield Advanced Biology Resources
Activity 5.4 Teacher SheetQ6 a
b Enzymes for a particular reaction are physically close to the reactants inside the
organelle. The reaction is separated from the rest of the cell by one or more membranes, so an optimum local environment can be maintained.
Q7 The Calvin cycle can take place in either light or dark – i.e. independently of light rather than only in the dark. The light-independent reactions can only continue for a very short time in the dark as they need the products from the light-dependent stage.
Extension
Q8 a When electrons are removed from photosystems/chlorophyll due to absorption of light energy, the photosystem/chlorophyll becomes positively charged. The splitting of water releases electrons that are attracted by the positive charge of the photosystem and so replace the electrons that were removed.
Salters-Nuffield Advanced Biology Resources
Safety checked, but not trialled by CLEAPSS. Users may need to adapt the risk assessment information to local circumstances. Activity 5.5 Student Sheet
Core Practical
INVESTIGATING PHOTOSYNTHESIS
Purpose
To investigate experimentally the link between the light-dependent and light-independent reactions.
SAFETY
DCPIP solution can stain, so avoid skin contact. Wear eye protection.
Ensure the centrifuge has stopped before inserting or removing the tubes.
Write a risk assessment including any safety precautions. Discuss this with your teacher before starting.
YOU NEED
● Fresh green spinach, lettuce or cabbage leaves
● Scissors
● Cold pestle and mortar (or blender or food mixer) which has been kept in a freezer compartment for 15–30 minutes (if left too long the extract may freeze)
● Muslin or fine nylon mesh
● Filter funnel
● Centrifuge and centrifuge tubes
● Ice-water-salt bath
● Glass rod or Pasteur pipette
● Measuring cylinder, 20 cm3
● Beaker, 100 cm3
● Pipettes, 5 cm3 and 1 cm3
● Bench lamp with 100 W bulb
● 0.05 M phosphate buffer solution, pH 7.0
● Isolation medium (sucrose and KCl in phosphate buffer)
● DCPIP solution
Using isolated chloroplasts
It is fairly easy to show that plants produce oxygen and starch in photosynthesis. At KS4 you may have collected the gas given off by Canadian pondweed (Elodea) and tested leaves for starch. It is not quite so easy to demonstrate the other reactions in photosynthesis. In this experiment, DCPIP
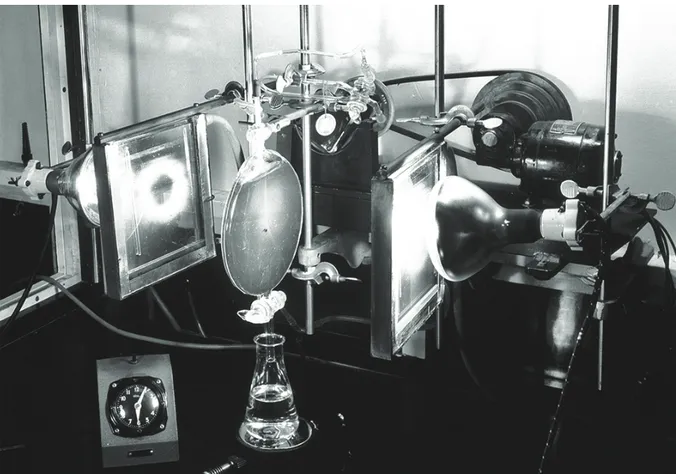
(2,6-dichlorophenolindophenol), a blue dye, acts as an electron acceptor and becomes colourless when reduced. DCPIP solution is added to isolated chloroplasts allowing any reducing agent produced by the chloroplasts to be detected. In the cell, NADP is the electron acceptor that is reduced in the light-dependent reactions and provides electrons and hydrogen for the light-inlight-dependent reactions. This reaction was first demonstrated in 1938 by Robert (known as Robin) Hill and is often called the Hill Reaction.
1 Scientific questions and information research
Before you start the experiment you should research the background science relevant to the light-dependent and light-inlight-dependent reactions of photosynthesis. You should think about the role of DCPIP in the experiment. It may help to look back at Activity 1.25 which used DCPIP to investigate the content of vitamin C in fruit juice.
Read through the procedure and predict what will happen in each of the five tubes, and give a reason to explain your prediction.
2 Planning and experimental design
Go through the procedure below and consider the following points. Explain your answers in each case.
Is the apparatus and procedure appropriate for the investigation?
What observations or measurements will you make and how will they be made?
Are there any safety issues in the use of the apparatus?
Salters-Nuffield Advanced Biology Resources
Activity 5.5 Student Sheet Core PracticalProcedure
Isolating chloroplasts
Follow the instructions below to isolate chloroplasts from leaves. This may have already been done for you.
NB Keep solutions and apparatus constantly cold during the extraction procedure, steps 1–8, to preserve enzyme activity. The extraction should also be carried out as quickly as possible. 1 Cut three small green spinach, lettuce or cabbage leaves into small pieces with scissors, but
discard the tough midribs and leaf stalks. Place in a cold mortar or blender containing 20 cm3 of
cold isolation medium (scale up quantities for blender if necessary). 2 Grind vigorously and rapidly (or blend for about 10 s).
3 Place four layers of muslin or nylon in a funnel and wet with cold isolation medium. 4 Filter the mixture through the funnel into the beaker and pour the filtrate into pre-cooled
centrifuge tubes supported in an ice-water-salt bath. Gather the edges of the muslin, wring thoroughly into the beaker and add filtrate to the tubes.
5 Check that each centrifuge tube contains about the same volume of filtrate.
6 Centrifuge the tubes for sufficient time to get a small pellet of chloroplasts (10 minutes at high speed should be sufficient).
7 Pour off the liquid (supernatant) into a boiling tube being careful not to lose the pellet.
Re-suspend the pellet with about 2 cm3 of isolation medium, using a glass rod. Squirting in and out of
a Pasteur pipette five or six times gives a uniform suspension.
8 Store this leaf extract in an ice-water-salt bath and use as soon as possible.
Using the chloroplasts
9 Read all the instructions before you start.
Note: The DCPIP solution should be used at room temperature. 10 Set up five labelled tubes as follows:
Tube Leaf extract/
cm3 Supernatant/cm
3 Isolation
medium/cm3 Distilled water/cm3 DCPIP solution/cm3
1 0.5 – – – 5
2 – – 0.5 – 5
3 0.5 – – – 5
4 0.5 – – 5 –
5 – 0.5 – – 5
11 When the DCPIP is added to the extract, shake the tube and note the time. Place tubes 1, 2 and 4 about 12–15 cm from a bright light (100 W). Place tube 3 in darkness. Note any changes observed in the five tubes. Make any appropriate measurements to allow comparisons between the tubes. 12 Describe any unexpected safety issues that arose in carrying out the practical work. Explain how
you dealt with them, including any advice you sought in dealing with them.
Analysis and interpretation of data
Salters-Nuffield Advanced Biology Resources
Safety checked, but not trialled by CLEAPSS. Users may need to adapt the risk assessment information to local circumstances. Activity 5.5 Student Sheet
Core Practical
Conclusion and evaluation
In the write-up of your experiment, make sure your report includes:
a clear conclusion to your work which is supported by evidence from the data and your own biological knowledge
comments on how valid your conclusion is
comments on the accuracy and precision of the results obtained in this experiment
comments on whether or not the outcome of your work was as you expected – and if it wasn’t, try to explain why not
discussion about any safety precautions you took during the experiment
descriptions of any modifications you made to the procedure and how the experiment could be improved.
Questions
Q1 The rate of photosynthesis in intact leaves can be limited by several factors, including light, temperature and carbon dioxide. Which of these factors will have little effect on the reducing capacity of the leaf extract?
Salters-Nuffield Advanced Biology Resources
Activity 5.5 Teacher Sheet Core PracticalINVESTIGATING PHOTOSYNTHESIS
Purpose
To investigate experimentally the link between the light-dependent and light-independent reactions.
SAFETY
Review the students’ risk assessments and discuss any safety considerations.
DCPIP solution can stain, so avoid skin contact.
Ensure eye protection is worn.
Ensure centrifuge is used safely and appropriately.
Notes on the procedure
Traditionally the production of oxygen and starch are used as evidence for photosynthesis. The Student Sheet for this activity describes the experiment used to investigate how the light-dependent reactions produce a reducing agent. This normally reduces NADP, but in this experiment the electrons are accepted by the blue dye DCPIP. Reduced DCPIP is colourless. Using extracted chloroplasts, this confirms the reduction that occurs in the light-dependent reactions. This experiment was originally completed by Robert (known as Robin) Hill in 1938; he concluded that water had been split into hydrogen and oxygen. This is now known as the Hill reaction.
Students must develop a clear understanding of the link between the dependent and light-independent reactions to be able to decide what observations/measurements are appropriate for the investigation, and to interpret the results. If colorimeters are not available, a qualitative colour assessment of the tubes could be done after 5–10 minutes.
This is a core practical, the focus is on correctly following instruction, selecting the appropriate measurements to make and interpreting the findings. On completion of the practical students could use the Developing Practical Skills Self-evaluation Sheet to reflect on what they have done in this
practical. This can be found in the Practical Skills Support section of the online resources.
The use of carbon dioxide by Elodea can be demonstrated using hydrogen carbonate indicator; in the light the indicator turns purple as carbon dioxide concentration decreases. There is a good SAPS photosynthesis practical in which algae are immobilised, placed in hydrogen carbonate indicator and used to investigate the rate of photosynthesis. A detailed worksheet can be downloaded from the SAPS website. The URL is in the weblinks that accompany this activity.
Sample results
Colour change and inferences that can be made from the results:
Tube 1 (leaf extract + DCPIP): colour changes until it is the same colour as tube 4 (leaf extract + distilled water).
Tube 2 (isolation medium + DCPIP): no colour change. This shows that the DCPIP does not decolourise when exposed to light.
Tube 3 (leaf extract + DCPIP in the dark): no colour change. It can therefore be inferred that the loss of colour in tube 1 is due to the effect of light on the extract.
Tube 4 (leaf extract + distilled water): no colour change. This shows that the extract does not change colour in the light. It acts as a colour standard for the extract without DCPIP.
Tube 5 (supernatant + DCPIP): no colour change if the supernatant is clear; if it is slightly green there may be decolouring, see results on page 2.
Salters-Nuffield Advanced Biology Resources
Safety checked, but not trialled by CLEAPSS. Users may need to adapt the risk assessment information to local circumstances. Activity 5.5 Teacher Sheet
Core Practical
Using a bench centrifuge
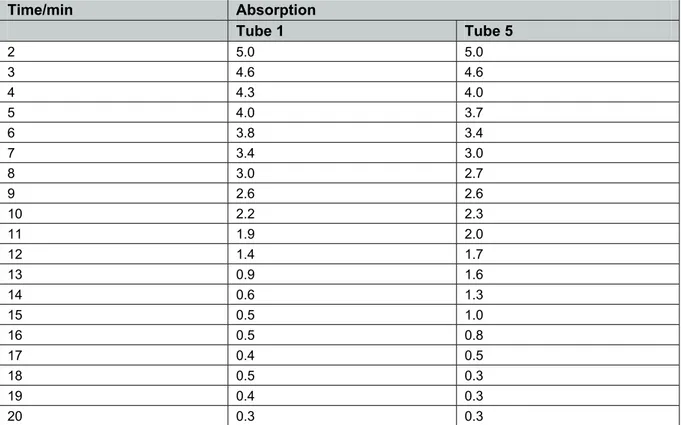
The experimental procedure was followed. A standard lab centrifuge was used to spin down the chloroplasts (Clifton NE 010GT/I) at 2650 RPM, 95× g for 10 minutes.
The experiment was started within 5 minutes of preparing the chloroplasts. The reaction was followed using an EEL colorimeter with a red filter – readings taken every minute. Results for tube 1 and 5 are presented in Figure 1.
Time/min Absorption
Tube 1 Tube 5
2 5.0 5.0
3 4.6 4.6
4 4.3 4.0
5 4.0 3.7
6 3.8 3.4
7 3.4 3.0
8 3.0 2.7
9 2.6 2.6
10 2.2 2.3 11 1.9 2.0 12 1.4 1.7 13 0.9 1.6 14 0.6 1.3 15 0.5 1.0 16 0.5 0.8 17 0.4 0.5 18 0.5 0.3 19 0.4 0.3 20 0.3 0.3
Tube 3 (incubated in the dark) gave a reading of 5.4 absorption units after 20 minutes. A colour change easily discernible by eye is obtained in about 10 minutes. If the colour change is too slow the DCPIP can be diluted a little.
Tube 2 (DCPIP with no leaf extract) was 6.2 absorption units.
Salters-Nuffield Advanced Biology Resources
Activity 5.5 Teacher Sheet Core PracticalUsing a micro-centrifuge
The experiment was repeated using a micro-centrifuge. Results for tubes 1 and 5 are presented in Figure 2.
Time/min Absorption
Tube 1 Tube 5
1 3.8 3.5
2 2.9 3.1
3 2.3 2.8
4 1.8 2.5
5 1.3 2.3
6 0.9 2.1
7 0.7 1.8
8 0.6 1.6
9 0.6 1.3
10 0.6 1.1
Tube 3 (incubated in the dark) gave a reading of 4.9 absorption units after 10 minutes. Tube 2 (DCPIP with no leaf extract) was 6.4 absorption units.
Figure 2 Results using micro-centrifuge. DCPIP chloroplast extract spun for 5 minutes at 2000× g.
The relative activity of the pellet was higher than when the bench centrifuge was used.
The micro-centrifuge tubes were only 1.5 cm3 capacity – not ideal for this practical. A higher speed
bench centrifuge would be better.
In order to check for loss of chloroplast activity, the experiment was repeated using the same chloroplast suspension 1 and 2 hours after preparation. Chloroplast suspension was kept in an ice-water-salt bath. There was no loss of activity when the extract was kept in ice for up to 2 hours.
Answers
Q1 Carbon dioxide will have no effect, because it is not involved in the light-dependent reactions. Q2 Students should describe a procedure using isolated chloroplasts and DCPIP in which light