R E S E A R C H A R T I C L E
Open Access
Ancestry-specific associations identified in
genome-wide combined-phenotype study
of red blood cell traits emphasize benefits
of diversity in genomics
Chani J. Hodonsky
1,2*, Antoine R. Baldassari
1, Stephanie A. Bien
3, Laura M. Raffield
4, Heather M. Highland
1,
Colleen M. Sitlani
5, Genevieve L. Wojcik
6, Ran Tao
7, Marielisa Graff
1, Weihong Tang
8, Bharat Thyagarajan
8,
Steve Buyske
9, Myriam Fornage
10, Lucia A. Hindorff
11, Yun Li
1, Danyu Lin
1, Alex P. Reiner
3,12, Kari E. North
1,4,
Ruth J. F. Loos
13, Charles Kooperberg
12and Christy L. Avery
1Abstract
Background:Quantitative red blood cell (RBC) traits are highly polygenic clinically relevant traits, with
approximately 500 reported GWAS loci. The majority of RBC trait GWAS have been performed in European- or East Asian-ancestry populations, despite evidence that rare or ancestry-specific variation contributes substantially to RBC trait heritability. Recently developed combined-phenotype methods which leverage genetic trait correlation to improve statistical power have not yet been applied to these traits. Here we leveraged correlation of seven quantitative RBC traits in performing a combined-phenotype analysis in a multi-ethnic study population.
Results:We used the adaptive sum of powered scores (aSPU) test to assess combined-phenotype associations
between ~ 21 million SNPs and seven RBC traits in a multi-ethnic population (maximumn= 67,885 participants; 24% African American, 30% Hispanic/Latino, and 43% European American; 76% female). Thirty-nine loci in our multi-ethnic population contained at least one significant association signal (p< 5E-9), with lead SNPs at nine loci
significantly associated with three or more RBC traits. A majority of the lead SNPs were common (MAF > 5%) across all ancestral populations. Nineteen additional independent association signals were identified at seven known loci (HFE,KIT,HBS1L/MYB,CITED2/FILNC1,ABO,HBA1/2, andPLIN4/5). For example, theHBA1/2locus contained 14 conditionally independent association signals, 11 of which were previously unreported and are specific to African and Amerindian ancestries. One variant in this region was common in all ancestries, but exhibited a narrower LD block in African Americans than European Americans or Hispanics/Latinos. GTEx eQTL analysis of all independent lead SNPs yielded 31 significant associations in relevant tissues, over half of which were not at the gene
immediately proximal to the lead SNP.
(Continued on next page)
© The Author(s). 2020Open AccessThis article is licensed under a Creative Commons Attribution 4.0 International License, which permits use, sharing, adaptation, distribution and reproduction in any medium or format, as long as you give appropriate credit to the original author(s) and the source, provide a link to the Creative Commons licence, and indicate if changes were made. The images or other third party material in this article are included in the article's Creative Commons licence, unless indicated otherwise in a credit line to the material. If material is not included in the article's Creative Commons licence and your intended use is not permitted by statutory regulation or exceeds the permitted use, you will need to obtain permission directly from the copyright holder. To view a copy of this licence, visithttp://creativecommons.org/licenses/by/4.0/. The Creative Commons Public Domain Dedication waiver (http://creativecommons.org/publicdomain/zero/1.0/) applies to the data made available in this article, unless otherwise stated in a credit line to the data.
* Correspondence:[email protected] 1
University of North Carolina Gillings School of Public Health, 135 Dauer Dr, Chapel Hill, NC 27599, USA
2University of Virginia Center for Public Health Genomics, 1355 Lee St,
Charlottesville, VA 22908, USA
(Continued from previous page)
Conclusion:This work identified seven loci containing multiple independent association signals for RBC traits using a combined-phenotype approach, which may improve discovery in genetically correlated traits. Highly complex genetic architecture at theHBA1/2locus was only revealed by the inclusion of African Americans and Hispanics/ Latinos, underscoring the continued importance of expanding large GWAS to include ancestrally diverse populations.
Keywords:Blood cell traits, Combined-phenotype analysis, Pleiotropy, Diversity, Multi-ethnic, GWAS
Background
In the average adult, 200 billion red blood cells (RBCs) are generated daily from hematopoietic stem cells in the bone marrow. The most commonly assessed traits for mature RBCs are hematocrit (HCT), hemoglobin concentration (HGB), mean corpuscular hemoglobin (MCH), MCH con-centration (MCHC), mean corpuscular volume (MCV), RBC count (RBCC), and red cell distribution width (RDW); together, these traits are used to characterize RBC develop-ment and function, diagnose anemic disorders, and identify risk factors for complex chronic diseases [1–6]. RBC traits also are moderately to highly heritable, making these com-plex quantitative traits excellent candidates for genomic in-terrogation [7–9]. Improved characterization of RBC molecular pathways has benefitted both disease diagnosis and pharmaceutical development, as has been demon-strated by recent successes in a BCL11A-silencing gene therapy clinical trial for individuals with sickle cell disease (SCD) [10,11].
Genetic association studies have reported over 500 in-dependent loci for RBC traits [12–31]. However, several research gaps remain which may be addressed via re-cently developed methods and broadly representative study populations. First, previously published RBC trait genome-wide association study (GWAS) populations have mostly been ancestrally homogeneous [31–39]. Utilization of diverse study populations can improve identification of rare or ancestry-specific variants located in biological pathways that affect phenotypes in global populations and, when summary data are made publicly available, enable construction of broadly applicable poly-genic risk scores [40]. Relatedly, gaps between estimated heritability and the proportion of variance explained by GWAS findings suggest that additional associations re-main to be identified, including rare variants and inde-pendent secondary associations at known loci that are both more likely to be ancestrally specific [12, 41, 42]. Finally, RBC traits exhibit modest to high correlation, and several dozen loci have been reported for two or more RBC traits, although few studies have leveraged this shared genetic architecture to increase statistical power to map novel RBC trait loci [12,20,26,43–45].
In this work, we examined the individual and shared gen-etic architecture of seven RBC traits in participants of the
ancestrally diverse Population Architecture using Genomics and Epidemiology (PAGE) study [46]. Our findings reinforce the necessity of incorporating multi-ethnic study populations in genomics in order to accurately characterize RBC trait loci and encourage equitable application of the results to transla-tional work [39]. The complexity of association signals at loci previously characterized in European- and East Asian-ancestry populations also demonstrates improved power to perform conditional analysis using a combined-phenotype model [47].
Results
The number of participants with both phenotype and genotype data ranged from 33,549 (RDW) to 67,885 (HCT, see Methods, Tables S2& S3). Seventy-eight per-cent of participants were female and participants were on average 57 years old at time of blood collection (Table S4). Self-reported race/ethnicity in the total study population was approximately 20% African American, 30% Hispanic/Latino, and 40% European American (Table S3).
Combined-phenotype analyses
Approximately 21 M SNPs met our inclusion criteria and were evaluated in our primary analysis, a combined-phenotype multi-ethnic meta-analysis of seven RBC traits. SNP associations with the combined phenotype multi-ethnic meta-analysis exceeded genome-wide significance at 39 loci (p< 5E-09, Figures S1, S2), all of which were identified previously. Lead SNPs at nine loci (KIT, HFE,
HBS1L/MYB, IKZF1, TFR2, HBB, HBA1/2, GCDH, and
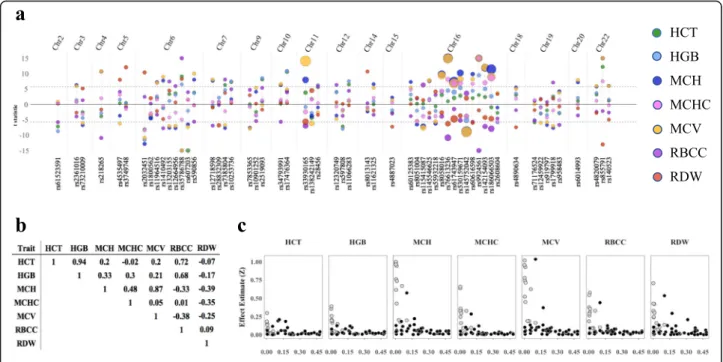
TMPRSS6) were associated with three or more RBC traits at genome-wide significance (Tables1, S5A). HCT, HGB, and MCHC exhibited genome-wide-significant associa-tions at the fewest loci (eleven, ten, and six, respectively), whereas MCH and MCV had the most (twenty and twenty-one, respectively, Fig. 1a, Table S5A). Estimated partial correlations by RBC trait pair ranged from HCT-MCHC (partial correlationρ=−0.02) to HCT-HGB (ρ= 0.94, Fig.1b). Consistent with other GWAS of quantitative complex traits, effect size was inversely correlated to allele frequency across all phenotypes (Fig.1c).
Table 1 RBC trait loci with evidence o f multiple independent signals among PAGE study participants Signal Chr:po s Ref/ Alt CAF a p valu es Mult i-ethni c RBC trait-specific Combine d p h enotype by race/eth nicity a AA HL EU
HCT N=
67,885
HGB N=
67,870 MC H N = 41,317 MC HC N = 67,8 56 MC V N = 41,2 76
RBCC N=
41
,310
RDW N=
33
,549
AA N=
16,802
HL N=
20
,697
EU N=
Table
1
RBC
trait
loci
with
evidence
o
f
multiple
independent
signals
among
PAGE
study
participants
(Continued)
Signal
Chr:po
s
Ref/ Alt
CAF
a
p
valu
es
Mult
i-ethni
c
RBC
trait-specific
Combine
d
p
h
enotype
by
race/eth
nicity
a
AA
HL
EU
HCT N=
67,885
HGB N=
67,870
MC
H
N
=
41,317
MC
HC
N
=
67,8
56
MC
V
N
=
41,2
76
RBCC N=
41
,310
RDW N=
33
,549
AA N=
16,802
HL N=
20
,697
EU N=
29,5
13
PLIN4
/PLIN5
loc
us
rs9
19797
1
19:4498
157
A/G
0.68
0.49
0.
46
5.1E-2
5.5E-4
1.9E
-11
1.
8E-5
6.
5E-9
4.4E-1
8.8E-1
0.35
9.5E-3
1.
1E-8
rs1
24599
22
2
19:4455
862
A/G
0.12
0.25
0.
26
0.003
0.00
3
4.3E
-8
0.
34
1.
4E-9
0.09
0.11
0.17
4.9E-5
1.
0E-4
Bold
font
for
combined-phe
notype
analysis
indicates
that
the
index
SNP
also
had
the
lowest
reported
p-value
for
that
particular
trait.
Variants
not
m
eeting
effective
heterozygosity
criterion
of
35
excluded.
AA
African
American,
HL
Hispanic/Latino,
EU
European
American.
aRestricted
to
populations
with
>
1000
association signals identified via conditional analysis, 64% (n = 37) exceeded genome-wide significance for the combined-phenotype lead SNP in two or more traits. When comparing genome-wide significant associations for two traits exhibiting a pairwise correlation >|0.2| among these loci, in 93% of instances (119 of 128) the dir-ection of effect matched the dirdir-ection of trait correlation (Fig.1a, b, Tables S5A, S6). Eight of nine trait-pair associa-tions with direcassocia-tions of effect opposite of expectation were instances in which MCH or MCV drove the lead SNP as-sociation, and HCT or HGB had a different lead SNP in high LD with the combined-phenotype lead SNP (r2> 0.8 in the combined MEGA-genotyped study population). Only one of nine associations was in a trait pair exhibiting moderate correlation: HGB and RBCC (ρ= 0.68) exhibit-ing opposite directions of effect for rs9924561, the lead SNP in theHBA1/2region on chromosome 16.
Evidence of independent associations at established loci We identified 20 independent association signals at seven loci (HFE, CCND3, HBS1L/MYB, CITED2, ABO,
HBA1/2, andPLIN4/5, Table1, Fig.1a). The majority of lead SNPs were common to all ancestries (MAF > 0.01);
evidence of association was most significant in European Americans at HFE and HBS1L/MYB loci, whereas His-panics/Latinos had the most significant association at both
CITED2lead SNPs. In two instances, known causal vari-ants accounted for the entire association signal after con-ditioning. At the HFE locus, both rs1800562 (HFE p.C282Y) and rs1799945 (HFE p.H63D, r2~0.99 with lead SNP rs2032451) are known coding hemochromatosis vari-ants and accounted for all significant associations within +/−3 Mb of the lead SNP [48]. Similarly, rs2519093 and rs10901252 are in moderate to high LD with variants that affect RBC traits but also determine an individual’s ABO blood type, and adjusting for these two variants accounted for the entire association at this locus.
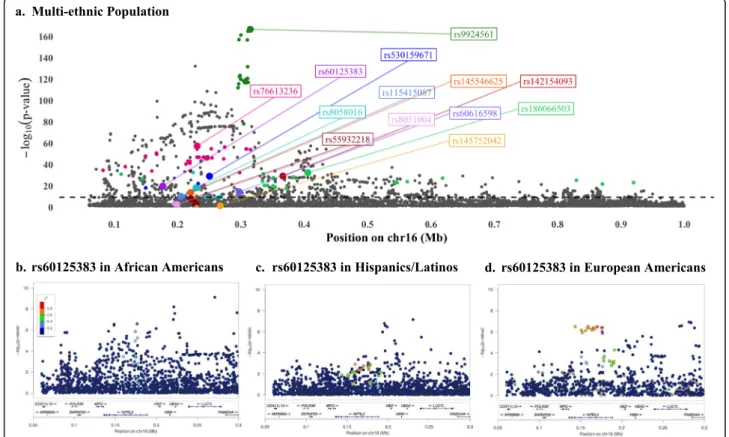
Of note, theHBA1/2locus demonstrated ancestry spe-cificity (i.e., the lead SNP was monomorphic in one or more ancestries) at 11 of 14 conditionally independent SNPs (Fig. 2a, Tables S5B-D). With the exception of rs60125383 (frequency of the A allele: 0.43 in African Americans, 0.55 in European Americans, 0.62 in His-panics/Latinos), located in a nonsense-mediated-decay transcript for NPRL3, no lead SNP at this locus was common to all ancestries. The LD block for rs60125383 Fig. 1Identification and characterization of 58 independent lead variants in 39 loci in a multi-ethnic study population.aLead and conditionally independent SNPs from combined-phenotype analysis of total study population show shared genetic architecture directionally consistent with correlation structure. Colored circles to the right of figure correspond to trait-specific associations. X-axis: rsid (bottom) sorted by chromosome (top) and position; y-axis: significance of association and direction of effect, represented by t-value (scaled to a maximum of t = |15|). Size of
circles is exponentially proportional to effect size standardized to trait means (3Z) to demonstrate differences in average effect size at lead SNPs
by trait. Dashed gray lines correspond to genome-wide-significance threshold ofa= 5E-09.bRBC trait pair partial correlations among
MEGA-genotyped participants adjusted for linear regression model covariates (n= 29,090 for HCT, HGB, and MCHC measurements;n= 22,330 for MCH,
MCV, and RBCC;n= 19,573 for RDW).c.Low-frequency and rare alleles exhibit larger magnitude of effect across RBC traits in the total
contained fewer variants in African Americans (Fig. 2b, no SNPs r2> 0.4) compared to Hispanics/Latinos (Fig. 2c, 10 SNPs r2> 0.6) and European Americans (Fig. 2d, 13 SNPs r2> 0.6).
Sensitivity analyses
Trait-specific sensitivity analyses identified two previously-unreported variants exceeded genome-wide significance for a single RBC trait in the univariate analyses, yet did not meet genome-wide significance in the combined pheno-type. Rs6573766 was specific to RBCC (p= 1.1E-9) and is common to all ancestries but was poorly captured by earlier genotyping arrays and is not represented in 1000 genomes phase 3 data (Figure S3, Table S7). Rs145548796 was sig-nificant for MCV (p= 4.6E-9) and is rare (< 1%) in all popu-lations, only meeting the inclusion criteria in the MEGA pooled sample and one study sub-population (Figure S4, Table S7). Ancestry-specific sensitivity analyses did not un-cover any significant association signals that did not achieve genome-wide significance in the overall study population.
When adjusting for esv3637548 deletion dosage in the MEGA-genotyped subgroup, we observed evidence of both attenuation and strengthening of effect at otherwise conditionally independent lead SNPs at the HBA1/2 locus (Table S8). Specifically, eight lead SNPs lost more than two orders of magnitudep-value after conditioning on esv3637548; one increased in significance; and five remained unchanged. Among the lead SNPs in this chromosomal region which remained significant was rs145546625, which was previously reported as signifi-cant for MCV independent of esv3637548 in a GWAS of HCHS/SOL participants using a different genotyping array [28]. All other PAGE lead SNPs in theHBA1/2 re-gion either did not pass QC or imputation criteria for the custom array used in that study, or had p> 1E-07 in the primary analysis.
Generalization of previously reported associations Generalization of previously identified association signals varied for trait-specific loci (p< 1.07E-4, Tables S9-S11), Fig. 2Multiple independent associations with MCH demonstrate complex genetic architecture atHBA1/HBA2locus. All plots: each point
represents one SNP; x-axis: increasing position on chromosome 16 left to right; y-axis: -log10(p-value) of the association with MCH.aRegional
association plot of 14 independent associations in unadjusted analysis of multi-ethnic study population (n= 41,317). Large circles represent
conditionally independent lead SNPs, labeled by rsid (order of conditioning is shown in Table1); small colored SNPs represent variants in high LD
(r2> 0.8 in LD in pooled MEGA subpopulation) with the lead SNP of the corresponding color.b-dLocus-Zoom regional association plots of MCH
association with rs60125383 (11th round of conditioning, purple diamond) in African Americans on an African American LD background (bn=
8703), Hispanics/Latinos on a Hispanic/Latino LD background(c,n= 17,380), and European Americans on a European LD background (dn=
14,707). SNP correlation with the lead SNP (r2) is colored according to the legend in (b). Annotated Refseq genes proximal to the lead SNP are
ranging from 50 of 143 (35%) for MCHC to 93 of 121 (77%) for HGB. Ancestry-specific generalization varied by trait, with the highest proportion of generalization oc-curring in the European-ancestry sub-population and the lowest occurring in African Americans, which may be due to power differences to detect associations by ancestry.
eQTL function of index SNPs
To assess the potential regulatory roles of lead SNPs, we evaluated cis-eQTL (< 500 kb) associations for all lead SNPs in GTEx as available [49]. Thirty-three of 51 SNPs were low-frequency or common (MAF > 1%) in the European-ancestry GTEx population and had available information in whole blood, liver, spleen, and/or thyroid tissues. Fourteen SNPs exhibited significant associations in RBC-relevant tissues; seven SNPs were eQTLs for multiple genes (Table S12). Although approximately 40 genes were within 500 kb of each of the chromosome 16 lead SNPs, none of the lead SNPs in this region exceeded a MAF > 1% in the GTEx study population and hence could not be evaluated for cis-eQTLs.
Discussion
RBC traits are complex quantitative phenotypes that have been broadly examined in GWAS of European- and East Asian-ancestry study populations. Here, we examine the benefits of identifying and characterizing RBC trait associ-ations in the ancestrally diverse PAGE study population using a combined-phenotype approach. Although the combined-phenotype method we employed did not enable identification of novel loci, ancestral diversity improved characterization of loci containing both ancestry-specific and common variants. The continued underrepresenta-tion of diverse populaunderrepresenta-tions in GWAS despite the growing clinical and public health significance of GWAS-enabled tools that are ancestry-specific underscores the continued importance of expanding existing RBC trait GWAS of pre-dominantly European and East Asian populations to glo-bal populations [50–53].
With regard to regions exhibiting multiple independ-ent significant associations, our results demonstrate al-lelic heterogeneity at known RBC trait loci, the characterization of which was enabled by an inclusive study design. Of particular note was our identification of eleven variants specific to African and/or Amerindian ancestries within the first megabase of chromosome 16. The chromosome 16 region includes hemoglobin genes
HBA1, HBA2, HBM, and HBZ as well as fifty other protein-coding genes that should be examined for plaus-ible roles in RBC trait biology. Decades of research have demonstrated selective pressure in this region occurring over millennia in malaria-endemic regions of the world but, as with many other complex quantitative traits, red
blood cell traits—specifically with regard to theHBA1/2 locus—have been primarily analyzed in Eurocentric study populations. Given the high polygenicity and com-plexity of quantitative RBC traits, our identification of over a dozen independent association signals suggests a highly-transcribed region with either complementary or redundant regulatory mechanisms that may affect mul-tiple genes. Future work could extend our efforts by examining other populations in malaria-endemic re-gions, as well as previously identified and highly influen-tial structural variants, including a previously identified 3.7 kb copy number variant, which we were only able to evaluate as a sensitivity analysis [28].
The possibility that combined-phenotype methods could benefit the study of other correlated polygenic traits still merits further investigation, particularly with groups of traits that may overlap in genetic architecture, but have not been previously examined in concert. Over the past three decades, RBC traits have been associated with cardiovascular disease outcomes like heart failure and stroke, highlighting the potential for identifying novel pleiotropic loci [6, 57–62]. Indeed, combined-phenotype approaches that examine the shared genetic architecture underlying intermediate phenotypes and clinical events may be particularly powerful for out-comes like stroke and heart failure, given that pheno-typic heterogeneity of these phenotypes has complicated locus identification and characterization.
Our evaluation of lead SNPs’ effects on expression in RBC-relevant tissues faced known constraints that lim-ited interpretation and contextualization of identified variants. Crucially, the vast majority of publicly available functional data were collected from European-ancestry individuals, precluding the use of these databases for interpreting potential effects of ancestry-specific or low-frequency SNPs on gene expression. For example, rs8051004 is one of two less frequent variants that were detected in European-ancestry populations at theHBA1/
2 locus (CAF = 0.02). However, rs8051004 was reported as“monoallelic”in spleen tissue in GTEx, despite having a 10% allele frequency in PAGE African Americans and 12 and 11% in the 1000G African and East Asian super-populations, respectively. The exclusion of populations with African, Amerindian, and Asian ancestry continues to hamper the potential benefits of these resources. Add-itionally, while the GTEx consortium has made extensive efforts to characterize a wide array of tissue types, bone marrow was not included [49]. RBCs enucleate in the bone marrow prior to entering circulation, with no nuclear transcription and extremely limited translation occurring in mature RBCs. Therefore, bone marrow is the only tissue for which eQTL data characterizing the effects of genetic variation on gene expression for RBCs directly.
As with other genetic association studies, we faced several limitations. First, sample sizes for RBC trait GWAS have ballooned to nearly 200,000 participants and we were restricted to a smaller study population. However, the PAGE study has recently demonstrated that modest-sized studies that are more ancestrally di-verse improve detection of novel and independent sig-nals compared to simply increasing the number of European-ancestry individuals [56]. Second, while this study did improve on previous studies in terms of repre-sentation from African and American continental ances-tries, we were unable to evaluate associations in several populations, particularly South Asians, Pacific Islanders, Native Americans, and Native Hawaiians. Native
Americans and Native Hawaiians are represented in PAGE, but RBC phenotypes were not measured in con-tributing studies. South Asian study populations have been included in several previous RBC trait GWAS; Na-tive Americans and Pacific Islanders remain underrepre-sented in GWAS of all complex traits [15, 20, 39, 63]. Third, we were unable to evaluate structural variants, which have traditionally been difficult to impute, and re-calling all structural variants within significant loci was outside the scope of this work. A sensitivity analysis ac-counting for the effect of esv3637548 in MEGA-genotyped study participants suggests that further evaluation is required to determine whether true causal variants overlap the pos-ition of this 3.7 kb structural variant on other ancestral hap-lotypes. However, it is expected that some structural variants will be adequately represented by proxy SNPs, and future sequencing-based studies will be able to characterize these rare variants. Finally, eQTL data could not be comprehen-sively interpreted given the limitations of publicly available databases as described above. It is imperative that these re-sources focus their efforts on improving inclusivity over the next several years to keep abreast of increased representative-ness in association studies.
Conclusion
In conclusion, we identified over 50 association signals within 39 loci in a combined-phenotype analysis of seven RBC traits. We did not observe large improvement in discovery signal detection by using the combined-phenotype methods, although further work is required to fully test the utility of these approaches. However, our work demonstrates the benefits of diverse study popula-tions for highly polygenic traits, in spite of the fact that while global populations are increasing in genetic diver-sity, genetic research has become less diverse. As gen-omics tools become more broadly available, our results underscore the critical importance of including diverse global populations so the benefits of genomics research can be equitably applied.
Methods Study population
the Women’s Health Initiative (WHI, described above). Our study population comprised sixteen analytic sub-groups which were genotyped and imputed separately. Fifteen of the sixteen analytic subgroups were identified by study and self-reported race/ethnicity (Tables S2, S3). The sixteenth subgroup was a pooled sample of self-reported African American, Asian American, Hispanic/ Latino, Native American, and“Other”MEGA-genotyped individuals from BioMe, HCHS/SOL, and WHI. Partici-pants were excluded if they had ever been diagnosed with HIV or leukemia, were pregnant at time of blood draw, were receiving chemotherapy at time of blood draw, or had a severe hereditary anemia (primarily sickle-cell disease, determined by genotype).
RBC trait measurement
RBC traits were measured with hemanalyzers following standardized laboratory protocols from blood draws at the earliest available visit (see online supplement) for the three primary (HCT, HGB, and RBCC) and four derived (MCH, MCHC, MCV, and RDW) RBC traits (Table S1). RBC trait values that exceeded four standard deviations from the mean of the trait in the overall study population were excluded, mirroring protocols established by prior GWAS [28,45]. Pairwise correlation coefficients were cal-culated in the MEGA-genotyped analytic subgroup (see below) adjusting for all the covariates used in univariate regression analysis, specifically age at blood draw, sex, study site or region, and ancestral principal components.
Genotyping, quality control, and imputation
Genotyping methods have been described for each of our study sub-populations previously; all imputation of genotype data used in this study was performed by the PAGE coordinating center [64]. Briefly, genotyping ar-rays and quality control measures used were as follows. Affymetrix Genome-Wide Human SNP Array 6.0 for ARIC, BioMe Mt. Sinai Biobank European Americans, CARDIA, and WHI SHARe. The Illumina OmniExpress was used to genotype individuals for all remaining BioMe Mt. Sinai Biobank participants. WHI GARNET participants were genotyped on the Illumina Human Omni1-Quad v1–0 B array; WHI GECCO participants on the Illumina 610 K and Cytochip 370 K arrays; WHI HIPFX participants on the Illumina 550 K and 610 K arrays; WHI LLS participants on the Illumina HumanOmniExpressExome-8v1_A array; WHI MOP-MAP participants on the Affymetrix Gene Titan, Axiom Genome-Wide Human CEU I Array Plate; and WHI WHIMS participants on the HumanOmniExpress Exome-8v1_B array. All remaining participants from BioMe, HCHS/SOL, and WHI were genotyped on the Illumina Infinium Expanded Multi-Ethnic Genotyping Array (MEGA).
With regard to quality control, studies employed either a 90% (ARIC, MOPMAP) or 98% (all other studies) SNP call-rate threshold. A sample call rate of 95% was employed for ARIC and. A 98% rate for MEGA-genotyped participants, with no sample call rate applied to remaining studies. Similarly, a 1E-06 HWE p-value threshold was employed for ARIC, and a 1E-04 thresh-old for MEGA-genotyped participants. Additional study-specific genotype QC criteria are described in Table S2. All studies were imputed to the 1000 Genomes phase 3 reference panel by the PAGE coordinating center after study-specific quality control criteria were applied (Table S2, 56). We further excluded SNPs on a sub-study-specific basis which had poor imputation quality (< 0.4) or an effective heterozygosity < 35 (calculated as 2 x CAF x (1-CAF) x N x imputation quality, where CAF is coded allele frequency and N is sample size).
Statistical methods Overall reporting of results
Previously-reported SNPs for the seven RBC traits evaluated in this study were identified through review of the NHGRI-EB GWAS Catalog [65] as of January 1, 2019, supplemented by a PubMed search. Multi-ethnic combined-phenotype re-sults were presented as the primary findings, employing Bonferroni correction assuming 10 M independent tests (i.e., genome-wide significance refers to paSPU < 5E-9). We de-fined a locus using physical proximity (+/−500 kb from the lead SNP), and we defined an association signal as the lead (most significant) SNP and proxy SNPs in local LD based on conditional independence within ten megabases. Discov-ery loci were defined as≥500 kb from and conditionally in-dependent of a variant previously reported to satisfy the field standard p < 5E-8 for any of the seven RBC traits. Ancestry-specific and trait-specific analyses were performed as sensitivity analyses to improve interpretation of results. Complete summary-level results are available through dbGaP (phs000356).
Univariate analysis
p-values were assessed by RBC trait by calculating gen-omic inflation factors (λ) and plotting the expected dis-tribution against observed results.
Combined-phenotype analyses
We used an adaptive sum of powered scores (aSPU) simulation-based method to perform a combined-phenotype analysis incorporating univariate results from seven RBC traits in sixteen analytic subgroups that were combined using inverse-variance-weighted meta-analysis. To evaluate evidence for shared genetic effects across all seven RBC traits, we combined meta-analyzed univariate results with aSPU to generate a combined-phenotype p -value for each SNP [28,69]. In comparison with other avail-able methods, we chose aSPU because it exhibited low type 1 error rate in simulations; accommodated direction of ef-fect; and was computationally scalable to the millions of SNPs measured using 1000 Genomes Phase 3 imputed data [70]. We implemented aSPU using Julia 1.0 to optimize effi-ciency (https://github.com/kaskarn/aspu_julia).
aSPU incorporated univariate summary z-scores, cal-culated for each SNP across all 7 traits, to yield a single p-value evaluating whether one or more of the traits were associated with a given SNP. Briefly, the procedure estimates Σ, the 7 × 7 correlation of null z-scores across univariate results and draws 1011 Monte-Carlo samples from the multivariateN7ð0;ΣÞ^ distribution. For each SNP
j, the results for all 7 traitszj1,…,zj7are used to form a se-quence of sums of powered scores: SPUðγÞ ¼zγ1þ… þzγ7, whereγ= 0, 1,…, 8, plusSPU(∞) = max ∣S7∣. Each powered score is compared to the distribution of the 1011 powered scores calculated using simulated null values with the same γ to calculate a Monte-Carlo p-value. An overall SNP p-value (paSPU, possible range: [1/(1 + 1011), 1]), is calculated by comparing the minimum p-value across the sequence of powered scores to the reference distribution of minimump-values across the sequence of powered scores computed using the simulated null data. The adaptive aspect of the test lies in the potential for dif-ferent γ values to yield the maximal SPU across SNPs, maintaining power compared to a test with only a single possible alternative hypothesis.
Sensitivity analyses
Sensitivity analyses were performed for combined-trait results by self-reported race/ethnicity among analytic subgroups with greater than 1000 participants (i.e., re-stricted to African Americans, Hispanics/Latinos, and European Americans). Given the number of known ancestry-specific variants driving blood trait values, it was necessary to ensure that all self-reported race/ethnic groups be evaluated individually for associations that may be undetectable in the larger population.
Meta-analyses of univariate summary statistics followed by combined-phenotype analysis were performed within each self-reported race/ethnicity using the same methods de-scribed above for the overall study population to identify genome-wide association signals (p< 5E-09).
We also examined whether there was evidence of sig-nificant trait-specific loci that were not identified in combined-phenotype analyses. Meta-analyses of each univariate RBC trait across all analytic subpopulations, as described above, were evaluated for association signals exceeding genome-wide significance (p< 5E-09). Al-though RBC traits are expected to share genetic under-pinnings, particularly within pairs of correlated traits, association signals which were trait-specific in the well-powered UK BioBank blood trait GWAS suggest that each trait has its own unique suite of associations [12].
Finally, in an attempt to examine the influence of the previously identified 3.7 kb structural variant esv3637548 in the HBA1/2 region of chromosome 16, we also ad-justed for esv3637548 dosage (r2= 0.86) in the MEGA-genotyped subgroup [28]. This structural variant either overlaps or has the potential to affect chromatic accessi-bility for multiple variants at this locus, but is present as both a duplication and a deletion. The duplication was not able to be imputed, and the deletion only met im-putation quality criteria in the MEGA-genotyped study population, hence esv3637548 could not be evaluated within the entire study population in which this variant may be present. To evaluate the potential effect of this variant on each lead SNP reported as independent within our study, unadjusted combined-phenotype p -values were therefore compared to p--values after condi-tioning on esv3637548.
Generalization of previously reported associations to PAGE
generalization of association signals in each trait across all known loci.
Identification of conditionally independent association signals
Iterative conditional analysis was performed to identify all independent, genome-wide-significant combined-phenotype lead SNPs as described above. To avoid iden-tifying SNPs as independent that were in long-range LD, we began by conditioning on the top SNP within ten megabase windows on each chromosome. To identify in-dependent SNPs, linear models were extended to include all PAGE combined-phenotype lead SNPs on shared chromosomes using the same methods described above for univariate analysis, with an added covariate to in-clude the dosage information for each participant at each lead SNP. Following each round of conditioning, aSPU was re-run on conditioned results. Additional rounds of conditional analyses were performed as an it-erative process until no genome-wide-significant SNPs remained in the combined phenotype analysis.
Publicly available expression quantitative trait locus (eQTL) analysis
To help prioritize candidate causal gene-variant associa-tions at identified loci, we evaluated all available lead SNPs within significant loci in relevant available tissues (whole blood, liver, spleen, and thyroid) for evidence of association with gene expression using the Genotype Tissue Expression (GTEx) portal [49].
Supplementary information
Supplementary informationaccompanies this paper athttps://doi.org/10.
1186/s12864-020-6626-9.
Additional file 1: Figure S1.Manhattan and Quantile-Quantile plots for individual RBC traits in the total study population. In Manhattan plots,
previously reported loci (published index SNP reportedp< 5E-08 within
500 kb of PAGE combined-phenotype lead SNP) are shown in purple;
pre-viously unreported loci with a PAGE lead SNPp< 5E-09 are shown in
green. In Q-Q plots, all (black)p-values and p-values for variants > 500 kb
from a previously reported significant variantfor any RBC trait(blue) are
both shown.Figure S2.Evidence of genetic associations shared across
correlated RBC traits. X-axis: chromosome and position (top) and rsid
(bottom) for each combined-phenotype lead SNP. Y-axis: trait-specific–
log10(p-values), with increased intensity representing higher significance,
for each combined-phenotype lead SNP.P-values scaled to a maximum–
log10value of 25 for improved interpretation.Figure S3.Locus-Zoom
plots of the association between rs6573766 and RBCC in PAGE African Americans on an African American LD background (A), Hispanics/Latinos on a Hispanic/Latino LD background (B), and European Americans on a European LD background (C). Each point represents one SNP; x-axis:
in-creasing position on chromosome 14 left to right; y-axis: -log10(p-value)
of the association with MCH SNP correlation with the lead SNP (r2) is
col-ored according to the legend in Figure S3A. Annotated Refseq genes
proximal to the lead SNP are shown by position above the X axis.Figure
S4.Locus-Zoom plot of the association between MCH (A) and MCV (B)
and rs145548796 in the total MEGA study population. Each point repre-sents one SNP; x-axis: increasing position on chromosome 6 left to right;
y-axis: -log10(p-value) of the association with MCH SNP correlation with
the lead SNP (r2) is colored according to the legend in Figure S4A.
Anno-tated Refseq genes proximal to the lead SNP are shown by position above the X axis.
Additional file 2.Twelve supplemental tables supporting findings reported in the main text. Tables cover trait, genotyping, and QC description; ancestry- and trait-specific findings for combined-phenotype
lead SNPs; sensitivity analysis of a deletion at theHBA1/2locus;
generalization of previously reported findings to PAGE study populations; and eQTL findings for PAGE lead SNPs in relevant tissue types.
Abbreviations
ARIC:Atherosclerosis Risk in Communities study; aSPU: adaptive sum of powered scores; CARDIA: Coronary Artery Risk Development in Young Adults Study; eQTL: expression quantitative trait locus; GTEx: Genotype Tissue Expression project; GWAS: Genome-wide association study; HCHS/ SOL: Hispanic Community Health Study/Study of Latinos; HCT: Hematocrit; HGB: Hemoglobin concentration; kb: kilobase; LD: Linkage disequilibrium; MCH: Mean corpuscular hemoglobin; MCHC: Mean corpuscular hemoglobin concentration; MCV: Mean corpuscular volume; MEGA: Multi-ethnic genotyping array; PAGE: Population Architecture using Genomics and Epidemiology study; RBC: Red blood cell; RBCC: Red blood cell count; RDW: Red cell distribution width; SNP: Simple nucleotide polymorphism;
WHI: Women’s Health Initiative study
Acknowledgements
The contents of this paper are solely the responsibility of the authors and do not necessarily represent the official views of the National Institutes of Health (NIH). The PAGE consortium thanks the staff and participants of all PAGE studies for their contributions. We thank R. Williams and M. Ginoza for providing assistance with program coordination. The complete list of PAGE
members can be found athttp://www.pagestudy.org.
Authors’contributions
All contributing authors were given the opportunity to review and comment on the final manuscript and accompanying materials, and have approved submission for publication. Overall project supervision and management: CJH, CLA, KEN, APR, MG, RT. Genotyping and quality control: GLW, SB, MF, RJFL, CLK. Phenotype harmonization: CJH, SAB, WT, BT. Association and secondary analyses: CJH, ARB, CS, RT, MG. Manuscript preparation: CJH, ARB, SAB, LMR, HMH, CS, MG, LAH, YL, DL, APR, KEN.
Authors’information
N/A
Funding
National Institutes of Health contract HHSN268200625226C. The Coronary Ar-tery Risk Development in Young Adults Study (CARDIA) is supported by con-tracts HHSN268201300025C, HHSN268201300026C, HHSN268201300027C, HHSN268201300028C, HHSN268201300029C, and HHSN268200900041C from the National Heart, Lung, and Blood Institute (NHLBI), the Intramural Research Program of the National Institute on Aging (NIA), and an intra agency agree-ment between NIA and NHLBI (AG0005).
The HCHS/SOL study was carried out as a collaborative study supported by contracts from the National Heart, Lung and Blood Institute (NHLBI) to the University of North Carolina HC65233), University of Miami (N01-HC65234), Albert Einstein College of Medicine (N01-HC65235), Northwestern University (N01-HC65236) and San Diego State University (N01-HC65237). The WHI program is funded by the NHLBI, NIH, US Department of Health and Human Services through contracts HHSN268201100046C,
HHSN268201100001C, HHSN268201100002C, HHSN268201100003C, HHSN268201100004C and HHSN271201100004C. CJH, HMH, and LMR were also supported by NHLBI training grant HL129982. HMH was also supported
by NHLBI training grant T32 HL007055 and ADA grant #1–19-PDF-045. D-YL
was also supported by R01CA082659, R01GM047845, and P01CA142538. CLA, ARB, CMS, HMH, and CJH were also supported by R01HL142825.
Availability of data and materials
Complete summary level results are available through dbGaP (http://www.
ncbi.nlm.nih.gov/projects/gap/cgi-bin/study.cgi?study_id=phs000356).
Ethics approval and consent to participate
All participating studies listed in the methods section obtained Institutional Review Board approval and written informed consent from all participants. Specifically, for the ARIC study IRBs at the following institutions approved the inclusion of this data in PAGE genomics studies: University of North Carolina at Chapel Hill, Johns Hopkins University, University of Minnesota, and University of Mississippi Medical Center. Use of HCHS/SOL study data was approved by IRBs from the following institutions: Northwestern University, Albert Einstein School of Medicine, University of Miami, and San Diego State University. Use of the BioMe Biobank data was approved by the Mt. Sinai IRB. Use of the WHI data was approved by the Fred Hutchinson Cancer Research Center IRB.
Consent for publication N/A
Competing interests
All authors declare that they have no competing financial or non-financial interests.
Author details
1University of North Carolina Gillings School of Public Health, 135 Dauer Dr,
Chapel Hill, NC 27599, USA.2University of Virginia Center for Public Health
Genomics, 1355 Lee St, Charlottesville, VA 22908, USA.3Fred Hutchinson
Cancer Research Center, 1100 Fairview Ave N, Seattle, WA 98109, USA.
4Department of Genetics, University of North Carolina at Chapel Hill, 120
Mason Farm Road, Chapel Hill, NC 27599, USA.5University of Washington,
1730 Minor Ave, Ste 1360, Seattle, WA 98101, USA.6Stanford University
School of Medicine, 291 Campus Dr, Stanford, CA 94305, USA.7Vanderbilt University, 2525 West End Ave #1100, Nashville, TN 37203, USA.8University of
Minnesota, 420 Delaware St SE, Minneapolis, MN 55455, USA.9Rutgers
University, 683 Hoes Ln W, Piscataway, NJ 08854, USA.10University of Texas
Houston, 7000 Fannin Street, Houston, TX 77030, USA.11National Human Genome Research Institute, 31 Center Dr, Bethesda, MD 20894, USA.
12University of Washington, 1705 NE Pacific St, Seattle, WA 98195, USA. 13Icahn School of Medicine at Mount Sinai, 1468 Madison Ave, New York, NY
10029, USA.
Received: 24 October 2019 Accepted: 26 February 2020
References
1. Buttarello M. Laboratory diagnosis of anemia: are the old and new red cell
parameters useful in classification and treatment, how? Int J Lab Hematol.
2016;38(Suppl 1):123–32.
2. Migone de Amicis M, Chivite D, Corbella X, Cappellini MD, Formiga F.
Anemia is a mortality prognostic factor in patients initially hospitalized for
acute heart failure. Intern Emerg Med. 2017 Sep;12(6):749–56.
3. Dai Y, Konishi H, Takagi A, Miyauchi K, Daida H. Red cell distribution width
predicts short- and long-term outcomes of acute congestive heart failure
more effectively than hemoglobin. Exp Ther Med. 2014;8(2):600–6.
4. Kellert L, Martin E, Sykora M, Bauer H, Gussmann P, Diedler J, et al. Cerebral
oxygen transport failure?: decreasing hemoglobin and hematocrit levels after ischemic stroke predict poor outcome and mortality: STroke: RelevAnt impact of hemoGlobin, hematocrit and transfusion (STRAIGHT)--an
observational study. Stroke. 2011 Oct;42(10):2832–7.
5. Dzierzak E, Philipsen S. Erythropoiesis: development and differentiation. Cold
Spring Harb Perspect Med. 2013;3(4):a011601.
6. Barlas RS, Honney K, Loke YK, McCall SJ, Bettencourt-Silva JH, Clark AB, et al.
Impact of hemoglobin levels and Anemia on mortality in acute stroke: analysis of UK regional registry data, systematic review, and meta-analysis. J Am Heart Assoc. 2016;17:5(8).
7. Whitfield JB, Martin NG. Genetic and environmental influences on the size
and number of cells in the blood. Genet Epidemiol. 1985;2(2):133–44.
8. Wright FA, Sullivan PF, Brooks AI, Zou F, Sun W, Xia K, et al. Heritability and
genomics of gene expression in peripheral blood. Nat Genet. 2014 May;
46(5):430–7.
9. Patel KV. Variability and heritability of hemoglobin concentration: an
opportunity to improve understanding of anemia in older adults.
Haematologica. 2008 Sep;93(9):1281–3.
10. Brendel C, Guda S, Renella R, Bauer DE, Canver MC, Kim Y-J, et al.
Lineage-specific BCL11A knockdown circumvents toxicities and reverses sickle
phenotype. J Clin Invest. 2016 Oct 3;126(10):3868–78.
11. Trakarnsanga K, Wilson MC, Lau W, Singleton BK, Parsons SF, Sakuntanaga P,
et al. Induction of adult levels ofβ-globin in human erythroid cells that
intrinsically express embryonic or fetal globin by transduction with KLF1
and BCL11A-XL. Haematologica. 2014 Nov;99(11):1677–85.
12. Astle WJ, Elding H, Jiang T, Allen D, Ruklisa D, Mann AL, et al. The allelic
landscape of human blood cell trait variation and links to common
complex disease. Cell. 2016;167(5):1415–1429.e19.
13. Ferreira MAR, Hottenga J-J, Warrington NM, Medland SE, Willemsen G,
Lawrence RW, et al. Sequence variants in three loci influence monocyte
counts and erythrocyte volume. Am J Hum Genet. 2009 Nov;85(5):745–9.
14. Yang Q, Kathiresan S, Lin J-P, Tofler GH, O’Donnell CJ. Genome-wide
association and linkage analyses of hemostatic factors and hematological phenotypes in the Framingham Heart Study. BMC Med Genet. 2007;8(Suppl 1):S12.
15. Chambers JC, Zhang W, Li Y, Sehmi J, Wass MN, Zabaneh D, et al.
Genome-wide association study identifies variants in TMPRSS6 associated with
hemoglobin levels. Nat Genet. 2009 Nov;41(11):1170–2.
16. Lo KS, Wilson JG, Lange LA, Folsom AR, Galarneau G, Ganesh SK, et al.
Genetic association analysis highlights new loci that modulate hematological trait variation in Caucasians and African Americans. Hum
Genet. 2011;129(3):307–17.
17. Yasukochi Y, Sakuma J, Takeuchi I, Kato K, Oguri M, Fujimaki T, et al.
Identification of nine novel loci related to hematological traits in a Japanese
population. Physiol Genomics. 2018 Sep 1;50(9):758–69.
18. Chen Z, Tang H, Qayyum R, Schick UM, Nalls MA, Handsaker R, et al.
Genome-wide association analysis of red blood cell traits in African Americans: the
COGENT network. Hum Mol Genet. 2013 Jun 15;22(12):2529–38.
19. van Rooij FJA, Qayyum R, Smith AV, Zhou Y, Trompet S, Tanaka T, et al.
Genome-wide trans-ethnic meta-analysis identifies seven genetic loci influencing erythrocyte traits and a role for RBPMS in erythropoiesis. Am J
Hum Genet. 2017 Jan 5;100(1):51–63.
20. van der Harst P, Zhang W, Mateo Leach I, Rendon A, Verweij N, Sehmi J,
et al. Seventy-five genetic loci influencing the human red blood cell. Nature.
2012 Dec 20;492(7429):369–75.
21. Soranzo N, Spector TD, Mangino M, Kühnel B, Rendon A, Teumer A, et al. A
genome-wide meta-analysis identifies 22 loci associated with eight hematological parameters in the HaemGen consortium. Nat Genet. 2009
Nov;41(11):1182–90.
22. Pistis G, Okonkwo SU, Traglia M, Sala C, Shin S-Y, Masciullo C, et al. Genome
wide association analysis of a founder population identified TAF3 as a gene for MCHC in humans. PLoS One. 2013 Jul 31;8(7):e69206.
23. Okada Y, Kamatani Y. Common genetic factors for hematological traits in
24. Li J, Glessner JT, Zhang H, Hou C, Wei Z, Bradfield JP, et al. GWAS of blood cell traits identifies novel associated loci and epistatic interactions in Caucasian and African-American children. Hum Mol Genet. 2013 Apr 1;22(7):
1457–64.
25. Kullo IJ, Ding K, Jouni H, Smith CY, Chute CG. A genome-wide association
study of red blood cell traits using the electronic medical record. PLoS One. 2010;28:5(9).
26. Kamatani Y, Matsuda K, Okada Y, Kubo M, Hosono N, Daigo Y, et al.
Genome-wide association study of hematological and biochemical traits in
a Japanese population. Nat Genet. 2010 Mar;42(3):210–5.
27. Iotchkova V, Huang J, Morris JA, Jain D, Barbieri C, Walter K, et al. Discovery
and refinement of genetic loci associated with cardiometabolic risk using
dense imputation maps. Nat Genet. 2016 Sep 26;48(11):1303–12.
28. Hodonsky CJ, Jain D, Schick UM, Morrison JV, Brown L, McHugh CP, et al.
Genome-wide association study of red blood cell traits in Hispanics/Latinos: the Hispanic community health study/study of Latinos. PLoS Genet. 2017 Apr 28;13(4):e1006760.
29. Ganesh SK, Zakai NA, van Rooij FJA, Soranzo N, Smith AV, Nalls MA, et al.
Multiple loci influence erythrocyte phenotypes in the CHARGE Consortium.
Nat Genet. 2009 Nov;41(11):1191–8.
30. Ding K, de Andrade M, Manolio TA, Crawford DC, Rasmussen-Torvik LJ,
Ritchie MD, et al. Genetic variants that confer resistance to malaria are associated with red blood cell traits in African-Americans: an electronic medical record-based genome-wide association study. G3 (Bethesda). 2013;
3(7):1061–8.
31. Kanai M, Akiyama M, Takahashi A, Matoba N, Momozawa Y, Ikeda M, et al.
Genetic analysis of quantitative traits in the Japanese population links cell
types to complex human diseases. Nat Genet. 2018 Feb 5;50(3):390–400.
32. Bustamante CD, Burchard EG, De la Vega FM. Genomics for the world.
Nature. 2011;475(7355):163–5.
33. DIAbetes Genetics Replication And Meta-analysis (DIAGRAM) Consortium,
Asian Genetic Epidemiology Network Type 2 Diabetes (AGEN-T2D) Consortium, South Asian Type 2 Diabetes (SAT2D) Consortium, Mexican American Type 2 Diabetes (MAT2D) Consortium, Type 2 Diabetes Genetic Exploration by Nex-generation sequencing in muylti-Ethnic Samples (T2D-GENES) Consortium, Mahajan A, et al. Genome-wide trans-ancestry meta-analysis provides insight into the genetic architecture of type 2 diabetes
susceptibility. Nat Genet. 2014;46(3):234–44.
34. Kichaev G, Roytman M, Johnson R, Eskin E, Lindström S, Kraft P, et al.
Improved methods for multi-trait fine mapping of pleiotropic risk loci.
Bioinformatics. 2017 Jan 15;33(2):248–55.
35. Schick UM, Jain D, Hodonsky CJ, Morrison JV, Davis JP, Brown L, et al.
Genome-wide association study of platelet count identifies ancestry-specific loci in
Hispanic/Latino Americans. Am J Hum Genet. 2016 Feb 4;98(2):229–42.
36. Parra EJ, Mazurek A, Gignoux CR, Sockell A, Agostino M, Morris AP, et al.
Admixture mapping in two Mexican samples identifies significant associations of locus ancestry with triglyceride levels in the BUD13/ZNF259/ APOA5 region and fine mapping points to rs964184 as the main driver of the association signal. PLoS One. 2017 Feb 28;12(2):e0172880.
37. 1000 Genomes Project Consortium, Auton A, Brooks LD, Durbin RM,
Garrison EP, Kang HM, et al. A global reference for human genetic variation.
Nature. 2015;526(7571):68–74.
38. Li YR, Keating BJ. Trans-ethnic genome-wide association studies: advantages
and challenges of mapping in diverse populations. Genome Med. 2014 Oct 31;6(10):91.
39. Petrovski S, Goldstein DB. Unequal representation of genetic variation across
ancestry groups creates healthcare inequality in the application of precision medicine. Genome Biol. 2016;17(1):157.
40. Bigdeli TB, Genovese G, Georgakopoulos P, et al. Contributions of common
genetic variants to risk of schizophrenia among individuals of African and Latino
ancestry. Mol Psychiatry. 2019.https://doi.org/10.1038/s41380-019-0517-y.
41. Girirajan S. Missing heritability and where to find it. Genome Biol. 2017 May
11;18(1):89.
42. Kim H, Grueneberg A, Vazquez AI, Hsu S, de Los Campos G. Will big data
close the missing heritability gap? Genetics. 2017 Sep 11;207(3):1135–45.
43. Pickrell JK, Berisa T, Liu JZ, Ségurel L, Tung JY, Hinds DA. Detection and
interpretation of shared genetic influences on 42 human traits. Nat Genet.
2016 May 16;48(7):709–17.
44. Park H, Li X, Song YE, He KY, Zhu X. Multivariate analysis of anthropometric
traits using summary statistics of genome-wide association studies from GIANT Consortium. PLoS One. 2016 Oct 4;11(10):e0163912.
45. Chami N, Chen M-H, Slater AJ, Eicher JD, Evangelou E, Tajuddin SM, et al.
Exome genotyping identifies pleiotropic variants associated with red blood
cell traits. Am J Hum Genet. 2016 Jul 7;99(1):8–21.
46. Matise TC, Ambite JL, Buyske S, Carlson CS, Cole SA, Crawford DC, et al. The
next PAGE in understanding complex traits: design for the analysis of population architecture using genetics and epidemiology (PAGE) study. Am
J Epidemiol. 2011 Oct 1;174(7):849–59.
47. Wei P, Cao Y, Zhang Y, Xu Z, Kwak I-Y, Boerwinkle E, et al. On robust
association testing for quantitative traits and rare variants. G3 (Bethesda).
2016;6(12):3941–50.
48. Gerhard GS, Paynton BV, DiStefano JK. Identification of genes for hereditary
hemochromatosis. Methods Mol Biol. 2018;1706:353–65.
49. GTEx Consortium. Human genomics. The genotype-tissue expression (GTEx)
pilot analysis: multitissue gene regulation in humans. Science. 2015;
348(6235):648–60.
50. Lambert SA, Abraham G, Inouye M. Towards clinical utility of polygenic risk
scores. Hum Mol Genet. 2019;28(R2):R133–42.
51. Martin AR, Kanai M, Kamatani Y, Okada Y, Neale BM, Daly MJ. Clinical use of
current polygenic risk scores may exacerbate health disparities. Nat Genet.
2019 Mar 29;51(4):584–91.
52. Barbeira AN, Dickinson SP, Bonazzola R, Zheng J, Wheeler HE, Torres JM,
et al. Exploring the phenotypic consequences of tissue specific gene expression variation inferred from GWAS summary statistics. Nat Commun. 2018 May 8;9(1):1825.
53. Peterson RE, Kuchenbaecker K, Walters RK, Chen C-Y, Popejoy AB,
Periyasamy S, et al. Genome-wide association studies in ancestrally diverse populations: opportunities, methods, pitfalls, and recommendations. Cell.
2019 Oct 17;179(3):589–603.
54. Evans TC, Jehle D. The red blood cell distribution width. J Emerg Med. 1991;
9(Suppl 1):71–4.
55. Monzon CM, Beaver BD, Dillon TD. Evaluation of erythrocyte disorders with
mean corpuscular volume (MCV) and red cell distribution width (RDW). Clin
Pediatr (Phila). 1987;26(12):632–8.
56. Wojcik GL, Graff M, Nishimura KK, Tao R, Haessler J, Gignoux CR, et al.
Genetic analyses of diverse populations improves discovery for complex
traits. Nature. 2019 Jun 19;570(7762):514–8.
57. Hsieh Y-P, Chang C-C, Kor C-T, Yang Y, Wen Y-K, Chiu P-F. The predictive
role of red cell distribution width in mortality among chronic kidney disease patients. PLoS One. 2016 Dec 1;11(12):e0162025.
58. Tseliou E, Terrovitis JV, Kaldara EE, Ntalianis AS, Repasos E, Katsaros L, et al.
Red blood cell distribution width is a significant prognostic marker in advanced heart failure, independent of hemoglobin levels. Hell J Cardiol.
2014 Dec;55(6):457–61.
59. Panwar B, Judd SE, Warnock DG, McClellan WM, Booth JN, Muntner P, et al.
Hemoglobin concentration and risk of incident stroke in community-living
adults. Stroke. 2016;47(8):2017–24.
60. Solovieff N, Cotsapas C, Lee PH, Purcell SM, Smoller JW. Pleiotropy in complex
traits: challenges and strategies. Nat Rev Genet. 2013 Jul;14(7):483–95.
61. Chesmore K, Bartlett J, Williams SM. The ubiquity of pleiotropy in human
disease. Hum Genet. 2018 Jan;137(1):39–44.
62. Gaggin HK, Dec GW. The role of treatment for Anemia as a therapeutic
target in the Management of Chronic Heart Failure: insights after RED-HF. Curr Treat Options Cardiovasc Med. 2014;16(1):279.
63. Morales J, Welter D, Bowler EH, Cerezo M, Harris LW, McMahon AC, et al. A
standardized framework for representation of ancestry data in genomics studies, with application to the NHGRI-EBI GWAS catalog. Genome Biol. 2018;19(1):21.
64. Bien SA, Wojcik GL, Zubair N, Gignoux CR, Martin AR, Kocarnik JM, et al.
Strategies for enriching variant coverage in candidate disease loci on a multiethnic genotyping array. PLoS One. 2016 Dec 14;11(12):e0167758.
65. MacArthur J, Bowler E, Cerezo M, Gil L, Hall P, Hastings E, et al. The new
NHGRI-EBI catalog of published genome-wide association studies (GWAS
catalog). Nucleic Acids Res. 2017 Jan 4;45(D1):D896–901.
66. Zheng X, Levine D, Shen J, Gogarten SM, Laurie C, Weir BS. A
high-performance computing toolset for relatedness and principal component
analysis of SNP data. Bioinformatics. 2012;28(24):3326–8.
67. Lin D-Y, Tao R, Kalsbeek WD, Zeng D, Gonzalez F, Fernández-Rhodes L, et al.
Genetic association analysis under complex survey sampling: the Hispanic
community health study/study of Latinos. Am J Hum Genet. 2014;95(6):675–88.
68. Willer CJ, Li Y, Abecasis GR. METAL: fast and efficient meta-analysis of
69. Kim J, Bai Y, Pan W. An adaptive association test for multiple phenotypes
with GWAS summary statistics. Genet Epidemiol. 2015 Dec;39(8):651–63.
70. Sitlani CM, Baldassari AR, Highland HM, Hodonsky CJ, Avery CL. Comparison
of multiple phenotype association tests using summary statistics in genome-wide association studies. Wiley Online Library; 2019.
Publisher’s Note