Sharif University of Technology
Scientia IranicaTransactions A: Civil Engineering www.scientiairanica.com
A dierent NSM FRP technique for strengthening of
RC two-way slabs with low clear cover thickness
P. Behzard
, M.K. Sharbatdar and A. Kheyroddin
Faculty of Civil Engineering, Semnan University, Semnan, P.O. Box 35131-19111, Iran. Received 22 February 2015; received in revised form 17 May 2015; accepted 27 June 2015KEYWORDS Manually made CFRP rods;
Manually made CFRP strips;
GFRP rods; NSM technique; RC two-way slabs; Finite element.
Abstract. An experimental program was carried out to investigate the eectiveness of a novel Near Surface Mounted (NSM) technique using innovative Manually Made CFRP Rods (MMRs) and Manually Made CFRP Strips (MMSs) for exural strengthening of Reinforced Concrete (RC) two-way slabs with low clear cover thickness. Four full-scale RC slabs (15001500120 mm) were tested under monotonic four-point bending. One slab was kept un-strengthened as the control specimen, one slab was strengthened using NSM GFRP rods, and the other two slabs were strengthened using NSM CFRP MMRs and NSM CFRP MMSs. The load-deection responses, strain measurements, and failure modes of the tested slabs were studied and discussed. The behavior of slabs strengthened with this technique was compared to the behavior of the slab strengthened with GFRP rods. The test results conrmed the feasibility and ecacy of this technique in improving the exural behavior of RC two-way slabs. Strengthened slabs showed an increase in exural capacity between 279% and 394% over the control specimen. A 3D nonlinear numerical model was developed using the Finite Element (FE) method to predict the exural behavior of the tested slabs. A good agreement between experimental and numerical results was observed. © 2016 Sharif University of Technology. All rights reserved.
1. Introduction
Fiber Reinforced Polymer (FRP) reinforcement has shown to be an eective material to increase the ex-ural and shear capacity of Reinforced Concrete (RC) structures. Advantages of FRP material for strength-ening over traditional methods are: high strength to weight ratio, high fatigue strength, no corrosion, and high chemical resistance [1,2].
The Near Surface Mounted (NSM) method is an emerging strengthening technique for RC structures, which is based on bonding the FRP reinforcements into pre-cut grooves in the concrete cover. Such grooves
*. Corresponding author. Tel.: +98 21 44260750; Fax: +98 21 44480149
E-mail addresses: [email protected] (P. Behzard); [email protected] (M.K. Sharbatdar); [email protected] (A. Kheyroddin)
might be in the tensile faces of the RC members for exure strengthening or sides of the beams for shear strengthening as well as along the height of columns [3-5]. In recent years, research on the NSM FRP reinforcement strengthening technique has attracted considerable attention and the results have shown the eectiveness of this technique in improving the exural and shear behavior of RC structural members. De Lorenzis and Teng [6] presented a critical review of ex-isting research on strengthening of structural members using the NSM FRP reinforcement technique.
The eciency of the NSM technique for the exu-ral and shear strengthening of RC members has already been assessed [7,8]. However, most of the studies have focused on the strengthening of RC beams [9-12] or slab strips [13-17]. There are little experimental or analytical studies on the behavior of RC two-way slabs exurally strengthened with NSM FRP reinforcements. The exural capacity of RC two-way slabs can
Table 1. Material properties. Material Elastic modulus (GPa) Compressive strength (MPa) Yield stress (MPa) Yield strain (strain) Ultimate tensile stress (MPa) Ultimate tensile strain (strain)
Concretea 24.91 24.82 { { { {
Steela 200 { 351.15 2,160 520.85 159,332
GFRP rodb 60 { { { 1,000 15,000
CFRP fabricb 230 { { { 4,900 15,000
Sikadur 30b 4.5 { { { 25 10,000
Sikadur 300b 3.5 { { { 45 15,000
a Average values obtained from material testing. bValues reported by the manufacturer.
be increased by bonding the FRP rods or strips into grooves cut perpendicularly on the tension face. For two-way slabs, the NSM strengthening technique using the FRP reinforcement must be performed along two perpendicular directions. Foret and Limam [18] investigated experimentally the exural behavior of RC two-way slabs with two strengthening techniques: NSM CFRP rods and Externally Bonded (EB) CFRP strips. The experimental study consisted of three full-scale strengthened slabs in addition to one un-strengthened slab as the control specimen. It was concluded that the NSM technique improved the bearing capacity of RC two-way slabs. A more ductile behavior was also observed comparing to the EB technique. It was shown that the specimen strengthened using EB CFRP strips experienced the premature debonding failure of the strips and carried approximately half the load carried by the specimen strengthened using NSM CFRP rods. However, it should be mentioned that this technique can only be applied for slabs with sucient clear cover thickness, because the grooves in one direction must be cut deeper than those in another direction. Therefore, this NSM strengthening technique is often limited, be-cause the sucient clear cover thickness is not available in most existing RC slabs. To overcome this drawback, an innovative NSM technique for strengthening of RC two-way slabs through Manually Made CFRP Rods (MMRs) and Manually Made CFRP Strips (MMSs), manufactured manually by CFRP fabric, is proposed in this study.
2. Research signicance
The main objective of this study is to investigate the feasibility and ecacy of an NSM strengthening technique using innovative CFRP MMRs and CFRP MMSs to increase the positive bending exural capac-ity of existing RC two-way slabs with low clear cover thickness. To the authors' knowledge, the technique introduced in this study is the rst investigation in the technical literature into the use of manually made FRP
reinforcements for strengthening of the RC two-way slabs. An experimental program of four-point bending tests is carried out on the RC two-way slabs with a limited amount of internal steel reinforcements. To as-sess the eectiveness of this technique, a comparison is carried out between the behavior of slabs strengthened according to this technique and the behavior of the slab strengthened with conventional GFRP rods. A 3D nonlinear Finite Element (FE) simulation is also developed using the FE code ANSYS [19] to predict the behavior of exurally strengthened slabs. The FE numerical predicted load-central deection responses and failure modes are compared with those of the measured experimental results.
3. Experimental program 3.1. Material properties
Table 1 summarizes the material properties of the con-crete, steel bars, FRP reinforcements, and epoxy used for test specimens. The average 28-day compressive strength and ultimate compressive strain of concrete from compressive cylinder tests were 24.82 MPa and 2,985 microstrain, respectively. The steel reinforce-ments were 10 mm diameter deformed steel bars with the mean yield strength of 351.15 MPa obtained from uniaxial tension tests. The FRP reinforcements used in the strengthening application consisted of GFRP rods and exible CFRP sheets. The rods used in this investigation were GFRP pultruded rods made of continuous E-glass bers and vinyl-ester resin. The nominal diameter of the rods was 12 mm, and their surface was spirally ribbed. The sheets used in the strengthening application consisted of a custom stitched unidirectional carbon fabric. The thickness and width of the fabric were 0.13 mm and 500 mm, respectively. The type and size of the FRP reinforce-ments were chosen based on commercial availability; however, there was a good agreement between the axial stiness of the dierent FRP materials used for test specimens. For bonding the FRP reinforcements to the
concrete, Sikadur 30 structural epoxy paste adhesive was used, which is a two-component epoxy matrix ma-terial. For manufacturing MMRs and MMSs, Sikadur 300 epoxy impregnation resin was used.
3.2. Manufacturing CFRP MMRs and CFRP MMSs
The proposed MMRs and MMSs were manufactured manually by CFRP fabric based on the lay-up tech-nique. For manufacturing MMRs, four strips of CFRP fabric were cut by 1500 mm in length and 250 mm in width. The width of the strips was selected based on the design requirements and their length was equal to the dimension of the slab specimen. Twenty pieces of a 6 mm diameter wooden bar with a circular cross section were cut by 260 mm in length. One of the CFRP strips was impregnated with epoxy and then spread on a at surface. In order to provide desirable workability for manufacturing MMRs and MMSs, a low viscosity epoxy impregnation resin, Sikadur 300, was used. Five wooden bars were aligned along the length of the CFRP strip as the end of each piece was about 50 mm away from the beginning of the next piece (Figure 1(a)). After that, the CFRP strip was wrapped uniformly around the wooden bars (Figure 1(b)). The prepared MMR had a wooden bar in the rst 260 mm along its length, but there was no wooden bar in the next 50 mm after that. The free spaces between the subsequent wooden bars were
repeated along the length of the prepared CFRP MMR with the same proportion. Consequently, four portions along the length of the prepared CFRP MMR were without wooden bars. Some pressure was applied on the prepared CFRP MMR by hand along the ber direction to remove air bubbles entrapped between CFRP layers. After wrapping the CFRP strip and before drying the epoxy adhesive, those four portions without wooden bars along the length of the prepared CFRP MMR were compressed by hand, in order to compress and bond the CFRP layers with each other (Figure 1(c)). Four clips were attached to those four portions until the epoxy hardened. Four CFRP MMRs were prepared similarly. The nal diameter of the prepared MMRs was 12 mm, approximately. Fig-ure 1(d)-(f) show the prepared CFRP MMR. Finally, the prepared MMRs were allowed to be cured for ve days. The complementary details related to the mechanical properties of the MMRs through tension coupon test can be found in [20].
For manufacturing MMSs, four strips of CFRP fabric were cut by 1500 mm in length and 250 mm in width. One of the CFRP strips was impregnated with epoxy and then spread on a at surface. After that, the CFRP strips were folded on each other by the width of the strip for three times and then bonded with each other (Figure 2(a)). Air bubbles entrapped between the CFRP layers were removed by hand. Four CFRP MMSs were prepared similarly. The nal width and
Figure 1. Manufacturing process of CFRP MMRs.
thickness of the prepared MMSs were 30 and 3.5 mm, respectively. Figure 2(b) shows the prepared CFRP MMS.
3.3. Test specimens
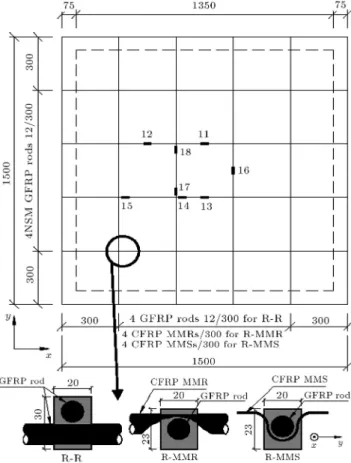
Four full-scale RC two-way slab specimens were con-structed with the same geometrical conguration and steel reinforcement details. The dimensions of the slabs were 1,500 mm long1,500 mm wide120 mm thick. The sides of the slabs represent the contra-exure lines in an actual two-way slab system. The slabs were designed to obtain a pure exural failure mode for the control specimen and possibly improve the exural behavior of the strengthened specimens. The main exural reinforcements (in one layer near the slab tension face) were 5-10 mm diameter deformed steel bars spaced at 300 mm along two perpendicular directions and arranged to give an average eective depth (d) to the center of the two layers of 80 mm. Thus, the clear cover thickness was about 30 mm. The reinforcement area provided in the slabs corresponded to reinforcement ratio of about 0.22%, which was close to the minimum reinforcement ratio for RC two-way slabs (0.2%), as specied by ACI 318-99 [21]. The anchorage of these bars was provided by 180 degree hooks at both ends. Figure 3 shows the layout of a test specimen and steel reinforcement details.
3.4. Strengthening method
After curing, the specimens were rotated in 180 degrees around their in-plane axis and placed on an elevated platform for strengthening. Out of the four specimens, one was kept un-strengthened as the control speci-men. Control specimen simulates an existing RC slab requiring strengthening. The other three specimens were strengthened using dierent congurations of NSM FRP reinforcements at the tension face of the slab. The amount and conguration of the FRP reinforcements were selected to provide a reasonable enhancement in the exural capacity of the specimen. The specimens were named according to the dierent materials used for strengthening. The rst and second phrases denoted the strengthening material in x and y directions, respectively. The GFRP rod, manually made CFRP rod, and manually made CFRP strip were denoted as R, MMR, and MMS, respectively.
Figure 3. Test specimen layout and steel reinforcement details (all dimensions in mm).
Therefore, the specimens were named as R-R, R-MMR, and R-MMS. The specimen designation, description of FRP reinforcements, and groove dimensions for specimens are given in Table 2.
The specimen R-R was strengthened using 4-12 mm diameter NSM GFRP rods in both x and y directions. The GFRP rods (1500 mm in length), spaced at 300 mm, were bonded into grooves on the slab tension face. When the concrete slabs attained, approximately, 28 days of age, eight grooves were cut into the concrete cover along two perpendicular directions on the tension face of the slabs. The grooves were spaced at 300 mm centers. For specimen R-R, the grooves in x direction were cut 10 mm deeper than
Table 2. Specimen designation, FRP layout description, and groove dimensions. Specimen
designation
Reinforcement material in x direction
Reinforcement material in y direction
Groove size in x direction
b h (mm)
Groove size in y direction b h (mm)
Control { { { {
R-R GFRP rod GFRP rod 2030 2020
R-MMR GFRP rod CFRP MMR 2023 2020
Figure 4. Strengthening process of slab specimens.
those in y direction, as indicated in Table 2. A special concrete saw with a diamond blade was used to cut the grooves. The grooves were thoroughly cleaned of debris and dust using steel brushes and pressured air to ensure proper bonding between the epoxy adhesive and the concrete. Each groove was then half lled with the epoxy using a spatula, and the GFRP rods were subsequently inserted and lightly pressed. This forced the epoxy to penetrate around the rod and ll the space between the GFRP rod and the sides of the groove. At the grooves intersection, the GFRP rods, placed along two perpendicular directions, were passed on top of each other, as shown schematically in Figure 4(a). More epoxy was applied to ll the groove and the surface was leveled by removing the excess adhesive. The specimen was cured for one week at room temperature before testing.
The specimens R-MMR and R-MMS were sim-ilarly strengthened in x direction using four NSM GFRP rods with the same arrangement as that of the specimen R-R, but they used, respectively, four CFRP MMRs and four CFRP MMSs as the strengthening reinforcements in y direction. For specimens R-MMR and R-MMS, the grooves were cut in the same way as specimen R-R, except that the grooves in x direction were cut only 3 mm deeper than those in y direction, as indicated in Table 2. Therefore, the grooves in both directions had a same depth, approximately. For specimen R-MMR, four CFRP MMRs (1500 mm in long), spaced at 300 mm, were bonded into grooves on the slab tension face in y direction. At the grooves intersection, the GFRP rods were passed on top of the CFRP MMRs at those four compressed portions with-out wooden bar, as shown schematically in Figures 4(b-d). As a result, both the GFRP rods and CFRP MMRs could be tted into the limited depth of the groove. For specimen R-MMS, four CFRP MMSs (1500 mm in long), spaced at 300 mm, were bonded horizontally into grooves on the slab tension face in y-direction. At the grooves intersection, the CFRP MMSs were passed
Figure 5. Schematic layout of the strengthened specimens and FRP reinforcement details at the grooves intersection.
on top of the GFRP rods, as shown schematically in Figure 4(e) and (f), in order to prevent separation of the GFRP rods from the groove sides. Therefore, both the GFRP rods and CFRP MMSs could be tted into the limited depth of the groove, too. All the FRP reinforcements were extended to the exterior edges of the slab to allow utilization of a sucient bond length of the FRP reinforcements. The specimens were cured for one week at room temperature before testing. Figure 5 shows a schematic layout of the three FRP
strengthened specimens and FRP reinforcement details at the grooves intersection.
It should be mentioned that exural strength-ening of RC two-way slabs with low clear cover thickness, using NSM FRP rods in one direction and EB FRP strips or pre-cured FRP laminates in the other direction, can be an alternative choice for the strengthening technique proposed in this study, because of easier fabrication and installation process of EB FRP reinforcements than those of the MMRs and MMSs. But, in this study, based on the exper-imental results conducted by Foret and Limam [18] and those reported by other studies, it was concluded that the EB FRP strips or pre-cured FRP laminates experience the premature debonding failure at high load levels and the nal exural behavior of speci-men is not achieved due to early debonding failure. Therefore, further investigations are not carried out to evaluate the eectiveness of this strengthening tech-nique.
3.5. Test setup and instrumentation
The slabs were placed on a sti supporting steel frame along their four sides. The sti supporting frame rested on the strong concrete oor of the laboratory. Four steel rollers, 1350 mm apart on center, were placed between the four sides of the specimen and the sti supporting frame. This simulates the simple supports over the four edges of the specimen, thus permitting the corners to uplift when load is applied. A sti loading steel frame was used to test the specimens. All slabs were tested under monotonic load using a 500 kN hydraulic jack in four-point bending up to failure. The loading points and supports were selected to give an eective span of 1350 mm and a shear span of 300 mm in both directions, as shown in Figure 3. A cruciform spreader steel beam was used to transfer the load to the slab through four loading points. Four square steel loading plates (15015040 mm) were placed between the cruciform spreader beam arms and slab top face to avoid uneven application of the load. The load was gradually increased by successive 10 kN increment, which was progressively reduced to near failure. The self-weight of the slab was small and neglected in the
calculation of the applied loads. The test was stopped when the specimen failed.
The applied load was measured using a 500 kN load cell placed between the hydraulic jack and the sti loading frame. The vertical deection of the specimen was measured at eleven dierent locations using Linear Variable Displacement Transducers (LVDTs), denoted by points A to K in Figure 3. The LVDTs were attached to a sti instrumentation steel frame placed below the slab bottom face and xed at the base. One of the LVDTs was placed underneath the slab center to measure the central deection of the specimen. Six LVDTs were placed along the orthogonal central lines to measure the deection at 300, 345, and 600 mm away from the slab center. The other four LVDTs were placed along the diagonal lines at 212, 424, and 500 mm away from the slab center. Eight strain gauges, denoted as 1 to 8 in Figure 3, were bonded at dierent locations on the steel bars in each specimen. Concrete strains were also measured on the slab compressive face along two perpendicular directions using two strain gauges, denoted as 9 and 10 in Figure 3. Based on the conguration of FRP reinforcements embedded in the slab tension face, eight gauges, denoted as 11 to 18 in Figure 5, were bonded to the FRP reinforcements at dierent locations. The locations of the strain gauges were selected in order to measure the maximum strains and to plot the strain distribution in the steel bars. Before bonding the gauges, the surface of the steel bars and GFRP rods were smoothed using an electrical disk sander and then cleaned with a solvent material. The readings from the load cell, LVDTs, and strain gauges were recorded by means of a data logger system. Figure 6 shows test setup and locations of the instruments.
4. Test results and discussion 4.1. Load-deection response
Table 3 summarizes the test results including the ultimate load and deection measurements for test specimens.
Figure 7 compares the load-central deection responses of all four test specimens. Central
deec-Table 3. Summary of test results.
Specimen Pcr
(kN) Py (kN) Pu (kN) Ppf (kN) cr (mm) y (mm) u (mm)
% increase in Pu with
respect to control
% decrease in u with
respect to control
Displacement ductility (u=y)
Control 22.83 42.50 47.50 { 0.96 15.01 63.35 { { 4.22
R-R 25.68 189.85 234.50 68.00 0.69 13.85 22.93 393.68 63.80 1.66 R-MMR 24.22 143.17 213.17 103.00 0.71 11.83 21.06 348.78 66.76 1.78 R-MMS 23.73 164.83 180.17 113.83 0.65 17.76 33.09 279.31 47.77 1.86
Figure 6. Test setup and locations of the instruments.
Figure 7. Comparison of load-deection responses of specimens.
tions shown in these plots represent central deections relative to supports. The load-deection response can be divided into un-cracked and cracked stages. The cracked stage can also be divided into pre-yield and post-yield sub-stages. The pre-yield cracked stage is from the cracking load (Pcr) to the yield load (Py).
The post-yield cracked stage extends from the yield load (Py) to the ultimate load (Pu). The rst cracking
load can be considered as the point where the load-deection response deviates from the initial elastic response. Ppf is the post-failure load carrying capacity
of the specimen.
A ductile failure was observed for the control specimen. The load-deection response of the con-trol specimen consisted of a sti un-cracked stage followed by a yield plateau due to yield of the steel bars. Yielding spread gradually from the slab center to the edges as the applied load increased, which caused the formation of some yield lines. Finally,
the specimen failed in pure exural mode. The strengthened specimens exhibited combined exural and local failure due to punch of the loading plates through the slab. Failure took place after signicant yielding of exural reinforcement. As the applied load increased further, the regions near the loading plates entered into a plastic state, and the loading plates punched through the slab thickness. Finally, failure occurred in a brittle manner and the load car-rying capacity dropped in all strengthened specimens. Punching the loading plates through the slab thickness at high load levels (between 4.94 and 3.79% times the ultimate load measured for the control specimen) is natural in the four-point loading method in low-thickness two way slabs and sometimes it is unavoid-able.
It can be seen by comparing the load-deection responses of the specimens shown in Figure 7 and the ultimate load results presented in Table 3 that applying FRP reinforcements increases the cracking strength and exural stiness of the specimens, and results in considerable improvement in the exural capacity. The corresponding increases depend on the area of the FRPs relative to the area of the conventional steel bars and the failure mode of the specimens. In addition, the load level at which the steel bars yielded (Py) depends
on the FRP reinforcements area and conguration. The formation of yield lines is also inuenced by the FRP reinforcements which tend to restrain the crack propagation.
4.2. Ultimate load and deection
The control specimen experienced the lowest ulti-mate load (47.50 kN). All the strengthened speci-mens had higher loading capacity than that of the
control specimen. The specimens MMR and R-MMS had increase in the ultimate load almost by 279 and 349%, respectively, over the control specimen. Specimen R-R, strengthened by GFRP rods, showed higher increase in the ultimate load, which was 394% over the control specimen. The control specimen had the highest deection value (63.35 mm) at the corresponding ultimate load. Deection values at the ultimate loads of the strengthened specimens were between 33 and 52% of the deection value of the control specimen due to the stiening eect of FRP reinforcements. Displacement ductilities, dened as the ratio of deection at the ultimate load divided by the deection at the rst yield, were 4.22, 1.66, 1.78, and 1.86 for specimens Control, R-R, R-MMR, and R-MMS, respectively. Specimens R-MMR and R-MMS showed high ductility compared to specimen R-R, but less ductility than the control specimen. It was shown that the increase in exural capacity was accompanied by a reduction in the ductility of failure.
4.3. Deection prole
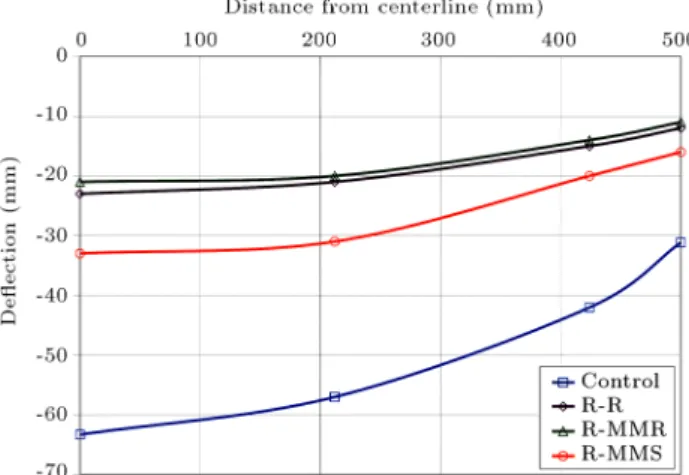
Deection of the specimens at 0, 300, 345, and 600 mm away from the slab center along the orthogonal axis and at 0, 212, 425, and 500 mm along the diagonal axis was measured continuously with increasing the applied load. At any load level, the highest deection value was at the slab center, and deections decreased with increase in the distance from the slab center. Figures 8 and 9 compare the deection proles of the control and strengthened specimens at the ultimate loads along the orthogonal and diagonal axes, respec-tively. The control specimen had the highest deection values at all locations among the test specimens. Specimen R-MMS had the highest deection values among the strengthened specimens, but less deection than the control specimen. Specimen R-R had the lowest deection prole among the strengthened spec-imens.
Figure 8. Deection prole along the orthogonal axis at the ultimate load.
Figure 9. Deection prole along the diagonal axis at the ultimate load.
4.4. Cracking patterns and failure modes Figure 10 shows the cracking patterns at the tension and compression faces of the specimens after failure. Control specimen failed in pure exural failure mode by forming the exural orthogonal yield lines at the slab tension face directly below the loading plates. Yield lines then extended from the corners of the loading plates in the diagonal direction and forked out as they approached the corners of the slab. There was no sudden loss of strength in the load-deection response of the control specimen, although very large deection was imposed. The failure of the control specimen was more ductile than those of the strengthened specimens, as indicated in Table 3. All the strengthened specimens experienced combined exural and brittle local failure due to punch of the loading plates through the slab in which both exural yield lines and roughly circu-lar cracks along the perimeter of the loading plates were observed to form simultaneously at failure. For strengthened specimens, signicant yielding was ob-served followed by the initiation of crushing of concrete around the loading plates.
All the strengthened specimens had smaller crack widths than that of the control specimen due to the eect of FRP reinforcements on restraining the crack propagation. It was observed that the load level at which failure occurred and the severity of failure of the specimens was inuenced by the presence of the FRP reinforcements. The crack control provided by the FRP reinforcements was optimal when direction of the FRP reinforcements was oriented perpendicular to the crack. The crack outlines for FRP strengthened specimens were similar to each other. For specimens R-MMR and R-MMS, crack distribution at the slab tension face was more concentrated in the x direction, strengthened with GFRP rods.
After failure took place, the loading was continued and measurements were taken to observe the post-failure behavior until the ultimate post-failure occurred due
Figure 10. Cracking patterns of the specimens after failure.
to a combination of anchoring or rupture of the FRP reinforcements and concrete crushing. A drop in load was observed in all strengthened specimens beyond the ultimate load (Pu), as shown in Figure 7. This drop
in load was stabilized at a certain level (Ppf), beyond
which the specimens continued carrying approximately
the same level of load under increasing deections. Table 3 provides the comparison of the loads carried after failure. The post-failure load carrying capacities for specimens R-R, R-MMR, and R-MMS were about 29, 48, and 63% of their ultimate load carrying capac-ities, respectively, and their post-failure behavior was
Figure 11. Failure plane between the slab face and the bonding epoxy of the GFRP NSM rods for specimen R-R.
Figure 12. Strain measurements on the steel bars.
stable up to the end of loading. For control specimen, punching of loading plates did not occur and failure was in the form of exural failure. The post-failure behavior was highly inuenced by FRP reinforcements area and conguration, concrete compressive strength, slab reinforcement ratio, and eccentricity of the loading points. At this stage, all strengthened specimens experienced failure of the anchoring of the GFRP rods which was evident from the horizontal shear-o of a thin concrete layer between the slab face and the bonding epoxy of the GFRP rods as a result of large deection on either side of the crack when failure occurred, as shown in Figure 11(a) and (b) for specimen R-R.
4.5. Steel and concrete strains
Strains were measured on the steel bars and on the concrete compressive face of the slabs. Figure 3 shows the locations of the strain gauges. Load versus steel and concrete strain responses for strain gauges that gave maximum strains are shown, respectively, in Figures 12 and 13. The vertical line in Figure 12 illustrates the yield strain for steel bars, determined as 2,160 microstrain from uniaxial tension tests. Yielding of the steel bars was observed in all of the specimens. The maximum steel strain measurement for specimens was well above the yield strain (between 13,000 and 18,000
Figure 13. Strain measurements on the concrete compression face of the slabs.
Figure 14. Steel strain proles at the ultimate load.
microstrain). The maximum concrete compressive strain, reached at the ultimate load of the specimens, was about 2,531 microstrain for specimen R-MMS. This strain level corresponded to about 85% of the ultimate uniaxial compressive strain of concrete, deter-mined as 2,985 microstrain from compressive cylinder tests.
Figure 14 shows the steel strain proles at gages 1 to 5 along the orthogonal axis at the ultimate load of the specimens. The horizontal line in this gure
illustrates the yield strain for steel bars (2,160 micros-train). The steel strain versus distance relationship for all specimens had a nonlinear prole. The highest steel strains at all load levels for all specimens were measured by strain gage 5 located at the slab center. The lower strains were measured by other strain gages located further from the slab center. Initial yielding of steel bars occurred at the slab center and then spread gradually from the center to the edges of the slab. Strengthened specimens had lower steel strain values than that of the control specimen. Applying the FRP reinforcements reduced the internal steel strains and delayed the onset of failure. Strengthened specimens had steel strain values that ranged from 73 to 93% of those in the control specimen. Although high strain levels in steel bars were reached for strengthened specimens, the pure exural failure mode was not reached.
4.6. FRP strains
Figure 15 shows the load versus the maximum mea-sured FRP reinforcements strain for strengthened specimens. It was observed that FRP strains were small before cracking. After cracking, the FRP rein-forcements engaged and started carrying the excessive strains until failure occurred. The maximum strains, developed in the GFRP rods, CFRP MMRs, and CFRP MMSs, were 10,873, 4,419, and 5,540 micros-train, respectively. This corresponded to about 72, 29, and 37% of the ultimate tensile (rupture) strain of the FRP reinforcements, which depended on the slab failure mode and the bond strength between the FRP reinforcements and concrete. In R-MMR and R-MMS specimens, the strain gauges had been bonded on the unsmooth surface of the CFRP fabric of MMRs and MMSs, which resulted in separation of the gauges from the surface of MMRs and MMSs at high strain levels. As a result, the MMRs and MMSs showed lower strain values than that of the GFRP rods.
Figure 15. Strain measurements on the FRP reinforcements.
5. Finite element modeling
5.1. Geometry of the developed FE models Four FE models were developed to simulate the be-havior of the full-scale RC slabs, using the FE code ANSYS [19]. The numerical predictions were com-pared with the experimental results for load-central deection response and cracking pattern at failure. The models had the same geometry, dimensions, ma-terial properties, loading, and boundary conditions as those of the experimental tested specimens. Also, the developed FE models had the same notation as that of the experimental program. One quarter of the slabs was modeled due to the geometrical, load-ings, and boundary conditions symmetry. The steel bars and NSM FRP reinforcements were dened as discrete reinforcement model located near the slab tension face. The nodes on the compressive face of slab, which corresponded to the location of the steel loading plate in the experiment, were coupled in the vertical direction using the constraint equations. Figure 16 shows the general layout of a developed FE model.
5.2. Description of elements and material properties
The eight-node structural solid element, SOLID65, was used to model the concrete [19]. Each node of the solid element had three translational degrees of freedom in the x, y, and z directions. The element was capable of plastic deformation, cracking in tension (in three orthogonal directions), and crushing in compression. The 3D two-node structural spar element, LINK8, was used to model the steel bars and NSM FRP reinforcements [19]. Each node of the element had three translational degrees of freedom. The element was a uni-axial tension-compression element and was capable of plastic deformation. In order to simplify modeling, the perfect bond between reinforcements (steel and NSM FRP) and solid concrete elements was assumed by sharing the same nodes.
The William and Warnke [22] failure criterion along with the Drucker-Prager criterion were used to dene the constitutive material model for the con-crete elements. Drucker-Prager criterion considers the eect of mean normal stress (i.e., connement) on the yield function and is suitable for modeling the concrete behavior in compression. The behavior of the steel bars was idealized to be bilinear (elastic-plastic) with a post-yield strain hardening of 1% to represent the strain hardening eect of the steel bars as the strain hardening greatly aected the ultimate load carrying capacity of the specimen. The von-Misses failure criterion was used to dene yielding of the steel bars. The NSM FRP reinforcements were modeled with elastic-brittle behavior (linear stress-strain curve up to brittle failure) in tension and zero strength and stiness in compression. The material constitutive models of concrete, steel bars, and NSM FRP reinforcements used in the FE model are shown in Figure 17.
5.3. Comparison between FE numerical predictions and experimental results A comparison was carried out between the FE numer-ical predictions and experimental results of the load-central deection response and cracking pattern at failure. Figure 18 compares the load-central deection responses predicted by FE models with the experimen-tal results for all the four slabs. The descending branch of the FE load-central deection responses was not calculated. As shown in Figure 18, the FE numerical predicted load-central deection responses agree well with the experimental measurements for all specimens. The load-deection responses from the FE models were slightly stier than those from the experimental results.
Table 4 compares the predicted ultimate loads and deections of the FE analyses with the tests data. As indicated in Table 4, the maximum deviation between the experimental and predicted numerical results for the ultimate load is less than 7% for all slabs.
Figure 17. Material constitutive models.
Table 4. Comparison between the predicted FE numerical and experimental results.
Specimen
Exp. FE % dierence in
Pu
(kN)
u
(mm)
Pu
(kN)
u
(mm) Pu (FE-Exp.)/FE
Control 47.50 63.35 50.92 59.79 6.7
R-R 234.50 22.93 245.53 22.06 4.5
R-MMR 213.17 21.06 218.08 20.43 2.3
R-MMS 180.17 33.09 181.79 18.76 0.9
Figure 19. Cracking pattern of FE models at failure load level.
Figure 19(a)-(d) show the cracking pattern ob-tained from the FE analyses at the last converged load step for all models. The black lines in this gure illustrate the approximate crack pattern for each specimen, which were drawn manually along the length of the cracking signs resulted from ANSYS output. As shown in Figure 19, the cracking patterns from the FE simulations and the actual slabs, reported in Section 4.4., are in reasonably good agreement. It can be concluded that the developed FE models can provide the accurate prediction of the load-central deection response and cracking pattern at failure for the RC two-way slabs strengthened with NSM FRP reinforcement.
6. Summary and conclusions
An eective technique based on the NSM method for exural strengthening of existing RC two-way slabs with low clear cover thickness is presented in this
study. The proposed strengthening technique em-ploys the innovative CFRP MMRs and CFRP MMSs, manufactured manually by CFRP fabric, as exural reinforcements. An experimental program was carried out and the behavior of slabs strengthened according to this technique was compared to the behavior of the slab strengthened with conventional GFRP rods. A 3D nonlinear simulation was also developed using the FE method and the numerical predictions of load-central deection response and cracking pattern were compared with the experimental results. The following conclusions can be drawn from this study:
The test results indicated that the use of MMR and MMS reinforcements is a feasible and eectiveness technique for improving the exural behavior of the RC two-way slabs with low clear cover thickness;
It can be shown that when the proposed CFRP MMR and CFRP MMS reinforcements are used, the grooves in both x and y directions of the slab can be cut approximately with the same depths. Therefore, strengthening the slabs with low clear cover thickness using NSM method, which was often limited due to the insucient clear cover thickness in most existing slabs, can be possible;
Strengthening the RC two-way slabs using NSM FRP reinforcements increases their exural capacity. The specimens R-R, R-MMR, and R-MMS had increase in the exural capacities by almost 394, 349, and 279%, respectively, compared with the control specimen. Specimen R-R, strengthened with GFRP rods, showed an increase in ultimate load by 10 and 30% over those slabs strengthened with CFRP MMRs and CFRP MMSs, respectively;
All the strengthened specimens failed in combined exural and local failure modes due to the punch in loading plates through the slab. Failure took place after signicant yielding of steel bars. Although high strain levels in steel bars were reached, the pure exural failure mode was not reached;
The strengthened specimens had a stier behavior than that of the control specimen due to the stien-ing eect of FRP reinforcements. Deection values at the ultimate load of the strengthened specimens
were between 33 and 52% of the deection value of the control specimen;
The slabs strengthened with CFRP MMRs and CFRP MMSs showed higher ductility compared to the slab strengthened using GFRP rods. It was shown that the increase in exural capacity was accompanied by a reduction in the ductility of failure;
The NSM FRP reinforcements reduced the strain in the internal steel bars and resulted in delay in the initiation and controlling propagation of the exural cracks in slabs;
There was a reasonably good agreement between the numerical predictions and experimental results in terms of the load-central deection response and cracking pattern of the specimens.
Acknowledgment
The authors wish to thank Semnan University Science and Technology Park for nancial support and col-leagues at the University for technical support. Also, they would like to acknowledge PAYA-SAZ-AZHAND Company for providing epoxy adhesives.
References
1. ACI Committee 440, Guide for the Design and Construction of Externally Bonded FRP System for Strengthening Concrete Structures, Farmington Hills (MI): American Concrete Institute, ACI 440.2R-08 (2008).
2. Badawi, M. and Soudki, K. \Flexural strengthening of RC beams with prestressed NSM CFRP rods -experimental and analytical investigation", Constr. Build. Mater., 23(10), pp. 3292-300 (2009).
3. Hawileh, R.A. \Nonlinear nite element modeling of RC beams strengthened with NSM FRP rods", Constr. Build. Mater., 27(1), pp. 461-71 (2012).
4. Yost, J.R., Gross, S.P., Dinehart, D.W. and Mildenberg, J.J. \Flexural behavior of concrete beams strengthened with near-surface-mounted CFRP strips", ACI Struct. J., 104(4), pp. 430-7 (2007).
5. Bournas, D.A. and Triantallou, T.C. \Flexural strengthening of reinforced concrete columns with near-surface-mounted FRP or stainless steel", ACI Struct. J., 106(4), pp. 495-505 (2009).
6. De Lorenzis, L. and Teng, J.G. \Near-surface mounted FRP reinforcement: An emerging technique for strengthening structure", J. Compos., Part B Eng., 38(2), pp. 119-43 (2007).
7. El-Hacha, R. and Riskalla, S.H. \Near-surface-mounted ber-reinforced polymer reinforcements for exural strengthening of concrete structures", ACI Struct. J., 101(5), pp. 717-26 (2004).
8. Barros, J.A.O., Dias, S.J.E. and Lima, J.L.T. \Ecacy of CFRP-based techniques for the exural and shear strengthening of concrete beams", J. Cem. Concr. Compos, 29(3), pp. 203-17 (2007).
9. Ceroni, F. \Experimental performances of RC beams strengthened with FRP materials", Constr. Build. Mater., 24(9), pp. 1547-59 (2010).
10. Jalali, M., Sharbatdar, M.K., Chen, J.F. and Jandaghi Alaee, F. \Shear strengthening of RC beams using innovative manually made NSM FRP bars", Constr. Build. Mater., 36, pp. 990-1000 (2012).
11. Barros, J.A.O., Baghi, H., Dias, S.J.E. and Gouveia, A.V. \A FEM-based model to predict the behaviour of RC beams shear strengthened according to the NSM technique", Eng. Struct J., 56, pp. 1192-1206 (2013).
12. Sharaky, I.A., Torres, L., Comas, J. and Barris, C. \Flexural response of reinforced concrete (RC) beams strengthened with near surface mounted (NSM) bre reinforced polymer (FRP) bars", Compos. Struct. J., 109, pp. 8-22 (2014).
13. Bonaldo, E., Barros, J.A.O. and Lourenco, P.B. \Ef-cient strengthening technique to increase the exural resistance of existing RC slabs", J. Compos. Constr., 12(2), pp. 149-59 (2008).
14. Elgabbas, F., El-Ghandour, A.A., Abdelrahman, A.A. and El-Dieb, A.S. \Dierent CFRP strengthening techniques for prestressed hollow core concrete slabs: Experimental study and analytical investigation", Compos. Struct. J., 92, pp. 401-11 (2010).
15. Dalfre, G.M. and Barros, J.A.O. \NSM technique to increase the load carrying capacity of continuous RC slabs", Eng. Struct. J., 56, pp. 137-53 (2013).
16. Mostakhdemin Hosseini, M.R., Dias, S.J.E. and Bar-ros, J.A.O. \Eectiveness of prestressed NSM CFRP laminates for the exural strengthening of RC slabs", Compos. Struct. J., 111, pp. 249-58 (2014).
17. Breveglieri, M., Barros, J.A.O., Dalfre, G.M. and Aprile, A. \A parametric study on the eectiveness of the NSM technique for the exural strengthening of continuous RC slabs", Compos., Part B Eng., 43(4), pp. 1970-87 (2012).
18. Foret, G. and Limam, O. \Experimental and numerical analysis of RC two-way slabs strengthened with NSM CFRP rods", Constr. Build. Mater., 22(10), pp. 2025-30 (2008).
19. ANSYS - Release version 11 \A nite element com-puter software theory and user manual for nonlinear structural analysis", ANSYS 2007, Inc. Canonsburg, PA (2007).
20. Sharbatdar, M.K. \Concrete columns and beams re-inforced with FRP bars and grids under monotonic and reversed cyclic loading", PhD Thesis, University of Ottawa, Canada (2003).
21. ACI committee 318, Building Code Requirements for Structural Concrete, Farmington Hills (MI): American Concrete Institute, ACI 318-99 (1999).
22. William, K.J. and Warnke, E.P. \Constitutive model for the triaxial behavior of concrete", IABSE Proc., Int. Association for Bridge and Structural Engineering, Zurich, 19, pp.174 (1975).
Biographies
Pejman Behzard obtained an MS degree in Struc-tural Engineering from Semnan University, Iran, with his thesis on the Punching shear strengthening of reinforced concrete slab-column connections using ber reinforced polymers, and is currently a PhD degree candidate at the same institution. He owns a patent related to his thesis and has authored one book and numerous conference papers.
Mohammad Kazem Sharbatdar obtained his MS
degree from Amirkabir University, Tehran, Iran, and his PhD degree from Ottawa University in Canada. He is currently Associate Professor in the Faculty of Civil Engineering at Semnan University, Iran. He has authored 5 books, more than 20 ISI and ISC journal papers and more than 100 conference papers. He has 5 patents. He has also supervised numerous MS and PhD degree theses.
Ali Kheyroddin obtained his MS degree from Iran University of Science and Technology, Iran, and his PhD degree from McGill University, Canada. He is currently Professor of Civil Engineering at Semnan University, Iran. He is the author of 8 books, more than 35 ISI and ISC journal papers and more than 200 conference papers. He has 4 patents. He has also supervised numerous PhD and MS degree theses.