Sharif University of Technology
Scientia IranicaTransactions E: Industrial Engineering www.scientiairanica.com
A prototype-based classication using extended
imperialist competitive algorithm
M.H. Fazel Zarandi
a;, M. Teimouri
b, A. Zaretalab
aand V. Hajipour
c a. Department of Industrial Engineering, Amirkabir University of Technology, 424 Hafez Avenue, Tehran, Iran. b. Faculty of Industrial and Mechanical Engineering, Qazvin Branch, Islamic Azad University, Qazvin, Iran. c. Department of Industrial Engineering, Faculty of Engineering, Bu-Ali Sina University, Hamedan, Iran. Received 4 July 2015; received in revised form 26 December 2015; accepted 26 December 2016KEYWORDS Prototype-based classication; Imperialist competitive algorithm;
UCI machine learning repository.
Abstract. Classication is an important machine learning technique used to predict group membership for data instances. In this paper, we propose an ecient prototype-based classication approach in the data classication literature by a novel soft-computing approach based on extended imperialist competitive algorithm. The novel classier is called EICA. The goal is to determine the best places of the prototypes. EICA is evaluated under three dierent tness functions on twelve typical test datasets from the UCI Machine Learning Repository. The performance of the proposed EICA is compared with well-developed algorithms in classication including original Imperialist Competitive Algorithm (ICA), the Articial Bee Colony (ABC), the Firey Algorithm (FA), the Particle Swarm Optimization (PSO), the Gravitational Search Algorithm (GSA), the Grouping Gravitational Search Algorithm (GGSA), and nine well-known classication techniques in the literature. The analysis results show that EICA provides encouraging results in contrast to other algorithms and classication techniques.
© 2017 Sharif University of Technology. All rights reserved.
1. Introduction
Machine Learning (ML), as a branch of articial intelli-gence, attempts to improve systems' performance [1-3]. ML's classication is the problem of identifying which set of categories (subpopulations) a new observation belongs to, on the basis of a training set of data contain-ing observations (or instances) whose category mem-bership is known. Classication techniques have been extensively applied to several elds such as business, image recognition, biology, medicine, and microarray data analysis, among others. For more details about classication problem, one can refer to [4,5].
The classication is also considered as two distinct
*. Corresponding author. Tel.: 021 64545378
E-mail addresses: [email protected] (M.H. Fazel Zarandi); [email protected] (M. Teimouri);
arash [email protected] (A. Zaretalab); [email protected] (V. Hajipour)
meanings: unsupervised learning (or clustering) and supervised learning. Clustering is a classication process to put data into specic groups or clusters based on their similarities. As a simple explanation, the clustering algorithms can be classied into two categories: hierarchical clustering and partitional clus-tering [6]. Hierarchical clusclus-tering techniques group data objects with a sequence of partitions, either from singleton clusters towards a cluster based on all individuals, or vice versa [7]. Unlike the hierarchical clustering algorithms, the goal of partitional algorithms is to classify the clusters at once based on a criterion function [7]. The most well-known class of partitional clustering methods is the center-based clustering algo-rithms. The aim of the center-based algorithms is to minimize its objective function. K-means is one of the best-developed center-based clustering algorithms [8]. This paper concentrates on supervised learning as a classication concept.
Over the past half century, many classication techniques have been presented such as Articial Neu-ral Networks (ANNs) [9,10], Support Vector Machine (SVM) [11,12], Decision Tree (DT) [13,14], and In-stance Based (IB) [15-18]. Among these techniques, the DT technique is simple and easy to use and comprehend by human beings. The SVM technique is a new machine learning method based on the foundation of statistical learning theory introduced by Vapnik [19]. SVM is based on the hypothesis in which the training samples have a certain distribution, restricting its application scope. The ANNs techniques, inspired by biological neural networks [4], attempt to formulate data as a mathematical model for both quantitative and qualitative data. The advantage of this method is the ability to deal with noisy data.
Among these, the IB classier is one of the most traditional types of classiers in which the main distinc-tive characteristic is to apply the instances themselves as class representations. The IB classication relies on the closeness or similarity between instances selected as a representative (prototype) of the learned class and the new examples to be classied. If the rep-resentative instances were previously observed exem-plars, we would apply classiers called memory-based, case-based, or exemplar-based. If the representative instances were abstracted from the given data, we would classify them as prototype-based [16]. The main advantage of the prototype-based classiers is oering an intuitive summation of the given data in a few number of prototypes, leading, therefore, to plausible and interpretable class structures and classication schemes [20].
Some recent developments show that some hybrid IB classiers, such as the Prototype Exemplar Learning Classier (PEL-C) [16] and the Total Recognition by Adaptive Classication Experiments (T.R.A.C.E.) [21], which generalize both prototype-based and exemplar-based classiers, can be used to discover the \typicality structure" of the learnt category, detecting how the class is decomposable in some subclasses and their typicality grade within the class [22].
There are lots of prototype-based algorithms which are dierent in terms of the number of the used prototypes and their selection method such as K-Means Classier (KMC) [4], Learning Vector Quantization (LVQ) [23], Nearest Neighbor Classier (NNC) [24], Nearest Mean Classier (NMC) [4], Nearest Subclass Classier (NSC) [25], and so forth [26,27]. Briey, NNC does not abstract the data, but rather applies all the training data to label unseen patterns. NMC saves one prototype for each class (i.e., mean of each class), while KMC and LVQ select a xed number of prototypes per class as an over-tting avoidance strategy. In LVQ, the training points attract prototypes of the correct class and repel other prototypes. In the learning phase,
the degree of attraction and repellence is controlled, which is tended towards zero at each iteration. NSC attempts to impose the number of prototypes per class by introducing a variance constraint parameter. In NSC, every pattern contains the same amount of noise and does not formulate the label noise [17]. However, such assumptions may not be satised in real world conditions.
Determining a proper classier for a classication problem is still a complicated issue. However, various factors are eective in choosing a suitable classier, including the size of the dataset, the type of hypoth-esized space representations, having either noisy or noise-free data, and so forth [2]. In the literature, many researchers have used soft-computing approaches for prototype-based techniques. The main reason for that comes from the nature of ML techniques. Since the training process is overly eective in the performance of the algorithms, inappropriate training can be converted to a local optimum, and consequently, increase the number of misclassications [28]. De Falco et al. [29] introduced an approach based on Particle Swarm Optimization (PSO) for classication. They applied three dierent tness functions as minimization to evaluate the quality of solutions. Karaboga and Ozturk [30] presented an Articial Bee Colony (ABC) algorithm for classication problem inspired by the foraging behavior of honey-bees. They have utilized only one of the tness functions presented by De Falco et al. [29]. Senthilnath et al. [31] proposed an algorithm based on the Firey Algorithm (FA) for solving classication problems and tested its pro-ciency on real datasets. Similar to [30], they also applied one of the functions proposed by De Falco et al. [29]. Bahrololoum et al. [28] proposed a Gravita-tional Search Algorithm (GSA) to face the classication of instances in multi-class datasets. Recently, Dowlat-shahi and Nezamabadi-pour [32] have presented a Grouping Gravitational Search Algorithm (GGSA) for data clustering. There are two signicant advantages of GGSA algorithm. First, a special encoding scheme, called grouping encoding, is used in order to make the relevant structures of clustering problems become parts of solutions. Second, given the encoding, special GSA updating equations suitable for the solutions with grouping encoding are used.
Since optimization algorithms are general-purpose techniques, the results obtained by the aforementioned algorithms conrm that optimization algorithms have high capability for classication problems. Besides, there is no classier that works best in classication problems. The Imperialist Competitive Algorithm (ICA), introduced by Atashpaz and Lucas [33] and Atashpaz et al. [34], is an evolutionary algorithm based on human's socio-political evolution. This evolutionary optimization algorithm has
an appropriate performance in many optimization problems such as inventory control [35], data clustering [36], scheduling [37], reliability [38], game theory [39], supply chain [40], project scheduling [41], dynamic facility layout [42], Euclidean minimal spanning tree [43], global optimization [44], and so on. Recently, Hosseini and Al Khaled [45] have reviewed the underlying ideas of how ICA and its application to the engineering disciplines mainly in industrial engineering have emerged. Not only is ICA easy to implement and computationally ecient, but it also has few param-eters. However, it is still in its infancy and undergoing intensive studies to improve its performance.
To enhance the quality of the solution in the ICA, several approaches have been proposed in the literature. Zhang et al. [46] proposed an improved algorithm based on the concept of small probability perturbation. They showed that there is no restriction on the number of optimized variables. Razzaghpour and Rusu [47] proposed a modied ICA to multi-dimensional problems. Their algorithm is compared with the original ICA and Genetic Algorithm (GA) on the circuit-related case study. Duan et al. [48] presented a chaotic ICA. They showed that the chaos can improve the global convergence of ICA and avoid getting stuck at local minima. Kaveh and Talata-hari [49] proposed an improved ICA in which the move-ment of the colonies toward their related imperialist is modied. Also, this approach is applied to our ICA for classication problems. Recently, Al Khaled and Hosseini [44] have proposed a Fuzzy Adaptive Imperialist Competitive Algorithm (FAICA) for global optimization in which the deviation angle parame-ter is adaptively adjusted using a fuzzy controller. By implementing fuzzy controller, the algorithm was capable of making a balance between global search and local search. Our proposed ICA determines a better quality solution with modifying two procedures: (I) assimilation policy and (II) revolution strategy. Considering these changes, we present an Extended Imperialist Competitive Algorithm (EICA).
In this paper, two phases are considered for the design prototype classier based on the EICA. In the rst phase, the fundamental problem is to determine favorable prototypes for each class which has signicant eect on the nal results. Therefore, to nd these prototypes, EICA is run until the termination criteria are satised. The prototypes are obtained by selecting 75% of the given dataset which is called as a training set. In the second phase, according to the result obtained in the previous phase, each instance from the remaining 25% of dataset, called the test set, is assigned to the prototype which has the minimum distance. In this respect, Euclidian distance, which is the most well-known and applicable distance, is applied. In order to evaluate the performance of the
proposed algorithm, 12 distinguished and standard datasets are chosen from the UCI machine learning repository [50]. The results of the proposed EICA are compared with those of the 15 well-known classication techniques reported in the literature. The tness functions in our EICA algorithm are exactly the same as the tness function suggested by De Falco et al. [29]. The performance of the algorithms is measured by Classication Error Percentage (CEP). We attempt to illustrate the performance of the proposed EICA for classication of instances.
The remainder of the paper is organized as fol-lows: In Section 2, ICA is presented. In Section 3, EICA is illustrated in detail. In Section 4, classication using EICA is discussed. Experimental implementation is introduced in Section 5. Then, in Section 6, feasi-bility of EICA is demonstrated and compared with the results of other classiers for dierent datasets and the behavior of optimization algorithm is investigated, and so more discussion is provided. At the end, conclusions and remarks for future research studies are given. 2. Imperialist Competitive Algorithm (ICA) ICA is a new population-based stochastic search algo-rithm inspired by imperialistic competition introduced by Atashpaz and Lucas [33] for optimization prob-lems. Formerly, ICA has been victorious in solving optimization problems such as design of plate-n heat exchangers [44], design of a linear induction motor [45], mixed-model assembly line sequencing problem [46], and skin color segmentation [47].
The main framework of ICA consists of 8 steps: generation of the initial empire; assimilation; revo-lution; exchanging positions of the imperialist and a colony; total power of an empire; imperialistic competi-tion; elimination of the powerless empires; convergence. The ICA's steps are described in detail in the following subsections.
- Step 1: Generating initial empires
Since representing the solutions is the main step in designing an optimization algorithm, an array of decision variables of the problem is considered to encode the problem. For example, in Genetic Al-gorithm (GA), this format is called \chromosome". In ICA, representation of the solution is called \country". In an Nvar-dimensional optimization
problem, country is a 1 Nvar array dened as:
Country = [P1; P2; ; PNvar]; (1)
where Pirefers the variables of the problem. Figure 1
shows the interpretation of the country using some of socio-political characteristics. The cost of the country is given by assessing cost function f dened by:
Figure 1. The candidate solutions of the problem, called country.
Cost = f(Country) = f(P1; P2; ; PNvar): (2)
To begin ICA, an initial random population of size Npop is created, and then, the objective function
for all countries is computed. The most powerful countries (Nimp) are selected as imperialists, and the
remaining of the population are colonies (Ncol) that
should be assigned to the imperialist. Now, we have two types of countries: imperialist and colony.
The colonies are distributed among the impe-rialists with respect to their power. To fulll this purpose, the normalized cost of an imperialist is dened by:
Cn= cn maxfcig
i i = 1; 2; ; Nimp; (3)
where cn and Cn are the cost of nth imperialist
and its normalized cost, respectively. Then, the normalized power of each imperialist is obtained as follows:
Pn=
Cn
PNimp
i=1 Ci
: (4)
In Eq. (4), Pn is the power of nth imperialist.
Finally, the initial number of colonies for nth empire is computed by:
NCn = round(Pn Ncol); (5)
where NCn is the initial number of colonies of
nth empire, and Ncol is the total number of initial
colonies. For each imperialist, NCn of the colonies
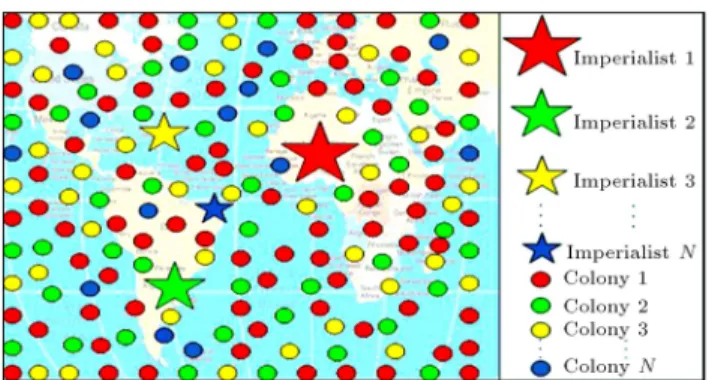
is randomly selected and assigned; then, all together constitute nth empire. Thus, if the empire is stronger, its colonies are greater; if the empire is weaker, its colonies are fewer. The initialization process is plotted schematically in Figure 2;
- Step 2: Assimilation
After all the colonies among imperialists are dis-tributed and the initial empires are created, the assimilation policy should be executed. According to this policy, all the colonies are moved and gotten closer to their relevant imperialist based on various socio-political axes (e.g., the culture, language, and economical policy). This movement is depicted in
Figure 2. Generating the initial empires [30].
Figure 3. Movement of colonies toward their relevant imperialist in a randomly deviated direction [30].
Figure 3. According to this gure, a colony mo-tion toward the imperialist by x units, where x is a random variable within uniform distribution, is considered to be between 0 and d:
x U(0; d); (6)
where and d represent a positive number greater than one and the distance between the colony and the imperialist, respectively. Much research was implemented on ICA with = 2 as an appropriate value [12,48,51]. Moreover, is a random variable with a uniform distribution between and :
x U( ; ); (7)
where is a control parameter that sets the deviation from the original direction. In order to increase the searching around the imperialist, a random amount of deviation is added to the direction of movement;
- Step 3: Revolution
Revolution is a powerful strategy that increases the power exploration of the algorithm and helps to escape from local minimums. This strategy is similar to the mutation process in the GA to create diversication in solutions. The probability of revolution in ICA illustrates the percentage of colonies that randomly change their position. The schematic of the revolution strategy is also shown in Figure 4. In this paper, an ecient revolution
Figure 4. Revolution as a sudden change in socio-political characteristics of a country [51].
strategy is proposed and described in detail in the next session;
- Step 4: Exchanging positions of the imperialist and colony
After applying revolution, a number of colonies may reach a better position (i.e., lower cost) in comparison with their imperialists. In such cases, the colony in each empire moves to the position of that imperialist. This process helps the optimization algorithm avoid getting stuck at locally optimal values;
- Step 5: Total power of an empire
The total power of an empire is dened as the summation of imperialist powers and a percentage of the mean power of its colonies:
T Cn =cost(imperialistn)
+ meanfcost(colonies of empiren)g; (8) where T Cn is the total cost of nth empire, and
is a positive small constant less than 1. The value of 0.1 for has led to good results in most of the implementations [51];
- Step 6: Imperialistic competition
Imperialistic competition is a key process in ICA framework in which all empires attempt to take over the possession of colonies from other empires and also control them. This event leads to the reduction of the power of weaker empires, while powerful empires tend to increase their powers. This strategy is formulated by choosing the poorest colony of the poorest empire and making a competition among all empires to possess these colonies. Figure 5 shows this competition, schematically. According to this gure, the more powerful empire is more likely to possess the weakest colony of the weakest empire [33].
To commence the competition, rst, the pos-session probability of each empire is provided as proportionate to the total power of the empire. The normalized total cost is computed by:
NT Cn= T Cn maxfT Cig
i ; (9)
where T Cn is the total cost of nth empire, and
Figure 5. Imperialistic competition [33].
NT Cn is its normalized cost. With regard to the
normalized total cost, the possession probability of each empire is obtained by:
PPn=
NT Cn
PNimp
i=1 NT Ci
: (10)
To divide colonies among empires, vector P is provided as follows:
P = [PP1; PP2; ; PPNimp]: (11)
Then, vector R is created as size P with random numbers within uniform distribution between zero and one.
R = [r1; r2; ; rNimp]: (12)
With regard to vectors R and P , vector D is determined as follows:
D = P R = [D1; D2; ; DNimp]: (13)
Finally, the highest value of vector D is found and its corresponding index species the empire that possesses the colony;
- Step 7: Eliminating the powerless empires
When the powerless empires lose all their colonies, they collapse in the imperialistic competition and their colonies are consequently divided among other empires;
- Step 8: Convergence
ICA is stopped when there is just one empire and all colonies are under the control of that empire. Many stopping criteria for ICA can be found in [51]. 3. An extended ICA
Since ICA is still in its infancy and intensive studies are needed to improve its performance, many novel operators are proposed [36,41,49]. In order to improve the performance of ICA and obtain better solution quality, in this paper, two steps of basic ICA, including assimilation and revolution, are modied.
3.1. Modifying colonies' movement
Considering the movement process of the original ICA, a point out of the colony-imperialistic contacting line can be obtained as shown in Figure 6. This algorithm not only uses dierent random values, but also utilizes the orthogonal colony-imperialistic contacting line in-stead of for deviating the colony [46]. To better un-derstand its action, the movement equation is reformed by:
fxgnew =fxgold+ d frandg fv1g
+ U( 1; 1) tan() d fv2g;
fv1g fv2g = 0; kfv2gk = 1; (14)
where frandg is a random vector, sign indicates an element-by-element multiplication, fv1g is the base
vector starting from the previous location of colony and being directed to the imperialistic contacting line; fv2g is perpendicular to fv1g. This equation uses both
dierent random values and utilizes the orthogonal colony-imperialistic contacting line instead of to deviate the colony.
3.2. Modifying revolution strategy
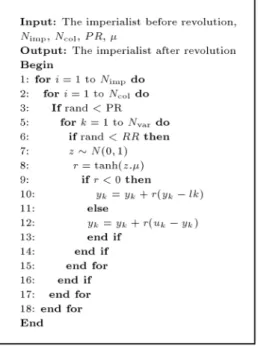
The second modication is related to revolution strat-egy. At each iteration (decade), the new revelation is applied as in the following steps:
- Step 1: Set Probability of Revolution (P R) and Revolution Ratio (RR) which depicts the percentage of colonies that randomly change their position and the percentage of the number of variables in each colony which randomly change their value, respectively;
- Step 2: Generate random numbers between zero and one for each colony;
- Step 3: Compare each value of the random numbers with P R. If the random numbers are lower than P R, the procedure of revolution is performed;
- Step 4: Generate random numbers between zero and one for each variable of colony;
- Step 5: Compare each value of the random numbers with RR. If the random number is lower than RR, the number of variables is changed;
Figure 6. Moving colonies to its next location [46].
- Step 6: Compute step length, r, as below:
r = tanh(z ); (15)
where `tanh' stands for the hyperbolic tangent func-tion and z shows a random number from a stan-dard normal distribution where the mean value and standard deviation are zero and one, respectively. Finally, is the search parameter which is calculated as a linear combination of initial search parameter (0) and nal search parameter (nal) as follows:
=(decade 1)max decadenal+(max decade decade)max decade 0:
(16) According to Eq. (16), when the number of decades of the algorithm is increased, the value of is decreased. This decrease is due to the fact that, in the nal decades, the algorithm has most likely obtained near-desired solutions. Therefore, the algorithm requires less variation than in its primary decades. In other words, to make a trade-o between the exploration and exploitation, big initial favors exploration in the initial steps of the search. As the iteration number increases, smaller facilitates the exploitation. Figure 7 shows that the diagram of changes in dierent decades of the proposed EICA;
- Step 7: Calculate new colony (y) based on Eq. (17) where uk and lk are upper and lower bounds in kth
variable. yk =
(
yk+ r(uk yk) if r > 0
yk+ r(yk lk) if r 0 (17)
To clarify the trend of the introduced operator for the evolution process in EICA, the pseudo-code is presented in Figure 8.
According to P R consideration, Figure 9 de-picts an example of the new revolution operator in which RR is 0.1. Therefore, due to the number intended for RR, in the uniform vector, the positions that are lower than RR are found. Then, the values of the same positions of the colony vector are
Figure 8. Pseudo-code of novel revolution operator.
Figure 9. An instance of the proposed revolution procedure.
changed (i.e., the 2th, 5th, and 7th bits of the colony vector). The changes are carried out based on Steps 6 to 8. Finally, the new colony is obtained.
4. Prototype classier based on EICA
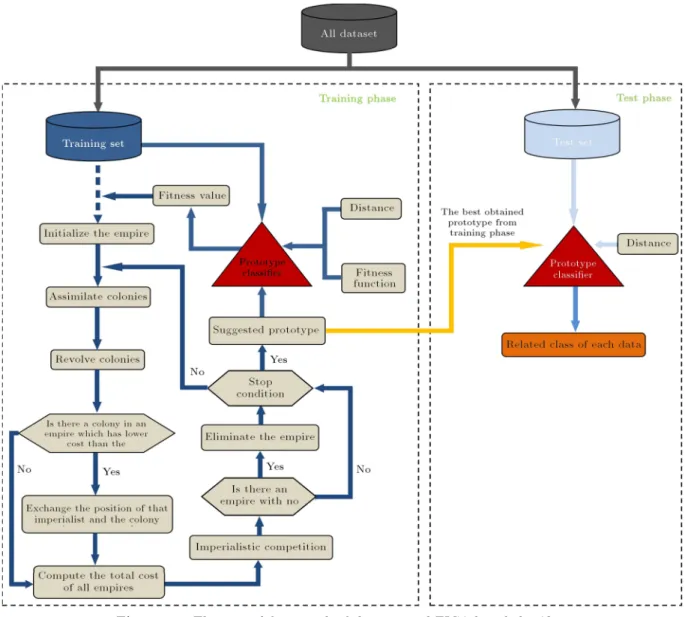
In this paper, an ecient prototype-based classication approach is proposed. The general framework of the proposed EICA-based classier is presented in Fig-ure 10. The details involved in the general framework are explained in the following subsections.
4.1. Solution structure
A one-dimensional array to represent the prototypes in a country in EICA is shown in Figure 11. The country is a vector with length of S K where K is the number of clusters and S is the dimensionality (attribute) of the considered datasets. Suppose countryi = fZ1; Z2; ; ZKg as ith country (i = 1; 2; ; Npop);
then, Zj = fZj1; Zj2; ; ZjSg is jth prototype for ith
country (j = 1; 2; ; K). 4.2. The training phase
Given a dataset representing K classes with S at-tributes, the goal of EICA in the training phase is
to determine K favorable prototypes in S-dimensional space for each class according to a specic tness function and to generate the classication model (i.e., one prototype for each class). To accomplish this goal, the search process to nd favorable prototypes in the training set is started by EICA as a global searcher. The procedure of the proposed EICA algorithm for the training process is provided as follows:
- Step 1: Retrieval data. Considering that some of these datasets include missing values, here, the missing values in each attribute are replaced by the average value of the attribute [52-54];
- Step 2: Prepare the needed data. The datasets are divided into the training and test datasets in the ratios of 75% and 25%. It should be noted that in glass, thyroid, and wine datasets, the dataset classes are in sequential list. Hence, the elements are shued;
- Step 3: Some random points are selected from the training set. The tness value of each country is computed, and the empire is initialized. Three tness functions, as reported in [37], are picked out, which are explained in Subsection 4.4;
- Step 4: All the colonies are moved and gotten closer to their relevant imperialist (assimilation). This movement is based on the orthogonal colony-imperialistic contacting line, as mentioned in Sub-section 3.1;
- Step 5: Evaluate cost function;
- Step 6: Change the position of colonies (revo-lution). This change is based on the proposed revolution, as mentioned in Subsection 3.2;
- Step 7: If there is a colony in an empire that has lower cost than that of the imperialist, then exchange positions of that colony and the imperialist;
- Step 8: Compute the total cost of all empires;
- Step 9: Start imperialist competition. Pick the weakest colony (colonies) from the weakest empires and give it (them) to the empires that have more likelihood to possess it (them);
- Step 10: Eliminate the powerless empires that have no colonies;
- Step 11: Termination criteria. The process is repeated and the prototypes positions are updated until the end of the training stage. Then, the best found values for the K prototypes are saved to be used for recall.
Since the training process is overly eective in the per-formance of the algorithms, an inappropriate training can be converted to a local optimum, and consequently, increase the number of misclassications.
Figure 10. The general framework of the proposed EICA based classier.
Figure 11. Representation of the prototypes in a country.
4.3. The test phase
In this phase, the found prototypes are evaluated with respect to class instances in a test set (the remaining 25% of dataset) to establish the recognition accuracy. So, for each instance from the test set, its distance from the prototypes is measured. Then, the instance is assigned to the prototype with the closest distance. In this paper, the Euclidian distance algorithm is applied in a way that is similar to the other algorithms. 4.4. Fitness function
In this study, three tness functions as minimization function (f1, f2, and f3) are applied to compare
the performance of the proposed EICA with other
classication algorithms. For more details about the tness functions, one can refer to [29]. These three tness functions are described as follows:
First tness functions (f1)
This tness function calculates the percentage of incorrectly assigned instances (misclassication) in the training set as follows:
f1=D100 Train
DXTrain
j=1
(~xj); (18)
where: (~xj) =
(
1 if CL(~xj) 6= CLknown(~xj);
0 otherwise (19)
where DTrain is the number of training patterns
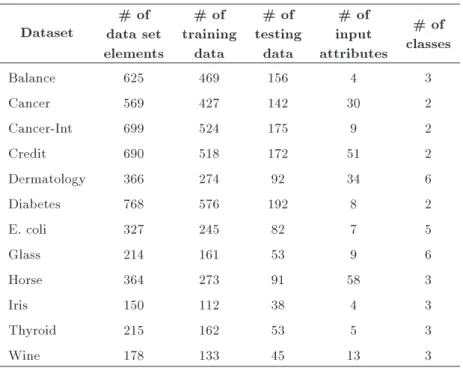
Table 1. Characteristics of the datasets. Dataset
# of data set elements
# of training
data
# of testing
data
# of input attributes
# of classes
Balance 625 469 156 4 3
Cancer 569 427 142 30 2
Cancer-Int 699 524 175 9 2
Credit 690 518 172 51 2
Dermatology 366 274 92 34 6
Diabetes 768 576 192 8 2
E. coli 327 245 82 7 5
Glass 214 161 53 9 6
Horse 364 273 91 58 3
Iris 150 112 38 4 3
Thyroid 215 162 53 5 3
Wine 178 133 45 13 3
CLknown(~xj) are the obtained class for the generic
instance ~xj and the class in which generic instance
~xj belongs to database, respectively. Eq. (18)
is multiplied by number 100 because the tness function can vary between [0, 100]. (~xj) represents
the presence (i.e., equal to one) or absence (i.e., equal to zero) of misclassication.
Second tness functions (f2)
Fitness function f2 denotes the Euclidean
dis-tance between generic insdis-tance ~xj and the center
of the cluster (prototype), belonging to database (~p CLknown(~xj)
i ) which is calculated as follows:
f2= D100 Train
DXTrain
j=1
d~xj; ~piCLknown(~xj)
: (20) Note that the objective value is normalized with DTrain;
Third tness functions (f3)
Fitness function f3 is divided into two phases. In
the rst phase, any training instance is assigned to cluster center of closer distance. In the second phase, tness function f3 is obtained as a linear
combination of f1 and f2 as follows:
f3= 12
f1
100+ f2
: (21)
5. Experimental implementation
In this section, we rst introduce 12 benchmark data sets to compare the performance of methods. Second,
we present a performance criterion to measure perfor-mance of the methods. Third, we determine proper values of EICA and ICA parameters for the classica-tion problem. Finally, the software and hardware used to implement EICA and ICA algorithms are present. 5.1. UCI datasets
For a better assessment of the proposed methodology, 12 real datasets are used. These datasets are obtained from the UCI Machine Learning repository that is used by many researchers to assess their algorithms [50]. The characteristics of these datasets are summarized in Table 1. These datasets have dierences in the number of objects, clusters, and attributes. Moreover, as mentioned previously, the datasets are divided into training and test datasets in the ratios of 75% and 25%. However, using a xed split may yield biased results [29]. The datasets used in this study are described below:
Balance dataset: This dataset consists of 625 el-ements which split into 469 for training and 156 for testing. Each instance is classied into three categories:
(I) Balance scale tip to the right;
(II) Balance scale tip to the left;
(III) Be balanced.
The dataset includes four attributes: the left weight, the left distance, the right weight, and the right distance;
Cancer dataset: This is the cancer dataset which is based on the \breast cancer Wisconsin - Diagnostic"
dataset. It includes classes with a tumor as either be-nign or malignant. This dataset contains 569 elements with 30 attributes. There are 16 instances containing missing data;
Cancer-Int dataset: This dataset is based on the \breast cancer Wisconsin-Original" dataset. It con-tains 699 elements, 9 inputs;
Credit dataset: This dataset is based on Australian Credit Card database to assess the applications for credit cards. It contains 690 elements with 14 at-tributes containing six numeric values and eight dis-crete formed into 51 input values;
Dermatology dataset: This is the dermatology dataset applied to the case of diagnosis of skin diseases. There are 366 elements, including 34 inputs and 6 classes: psoriasis, seboreic dermatitis, lichen planus, pityriasis rosea, cronic dermatitis, and pityriasis rubra pilaris;
Diabetes dataset: This dataset is the applied di-abetes diagnosis which consists of 768 elements from female patients of Pima Indian heritage. The rst 576 elements are considered as the training set and the remainder 192 as the test set. There are two classes and eight attributes in the dataset;
E. coli dataset: This dataset originally had 336 ele-ments and eight classes. Three classes are represented with only 2, 2, 5 instances. Therefore, the new dataset is used which contains 327 members, ve classes, and seven attributes. In the new dataset, the rst 245 elements are considered as the training set and the remainder 82 as the test set;
Glass dataset: This dataset contains samples from six dierent types of glass: building windows oat processed, vehicle windows, building windows non-oat processed, tableware, and headlamps. There are 214 elements with nice inputs which are split into 161 for training and 53 for testing;
Horse dataset: Horse dataset is used to predict the fate of a horse with colic and to classify whether the horse will survive, die, or be euthanized. The dataset is created based on Horse Colic data with 364 patterns, each of which has 58 inputs from 27 attributes and three outputs. In this dataset, 30% of the values are missing;
Iris dataset: The Iris ower dataset or Fisher's Iris dataset is a multivariate dataset introduced by Sir Ronald Fisher as an example of discriminate analysis.
This dataset contains three categories of 50 objects where each category refers to a type of iris plant. In the iris dataset, there are 150 instances with four attributes which are sepal length in centimeter (cm), sepal width in cm, petal length in cm, and petal width in cm, respectively;
Thyroid dataset: This dataset contains three cat-egories of human thyroid diseases, namely, euthy-roidism, hypothyeuthy-roidism, and hyperthyroidism. This dataset has 215 elements with ve attributes. These are the T3-resin uptake test, total serum thyroxin as measured by the isotopic displacement method, total serum triiodothyronine as measured by radioimmuno assay, basal thyroidstimulating hormone as measured by radioimmuno of 200 mg of thyrotropin releasing-hormone, and the basal value;
Wine dataset: These data are the results of a chem-ical analysis of wines grown in the same region in Italy extracted from three dierent cultivars. This dataset contains 178 elements by 13 attributes. The attributes are alcohol, malic acid, ash, alcalinity of ash, magne-sium, total phenols, avanoids, nonavanoid phenols, proanthocyanins, color intensity, hue, OD280/OD315 of diluted wines and proline.
5.2. Performance criteria
The performance of the algorithms is measured by Classication Error Percentage (CEP) criterion. The percentage of incorrectly classied patterns of the test datasets are shown as follows:
CEP = number of misclassied examplestotal size of test dataset 100: According to this criterion, each pattern is classied by assigning it to the class whose distance is closest to the prototype of the clusters. Then, the classied output is compared with the desired output. If they are not exactly the same, the pattern is separated as misclassied. The CEP creation is determined and reported for all test data. It should be noted that the CPU times of the techniques, as a competitive benchmark, are not considered.
5.3. Parameter setting
Determining proper values for the optimization algo-rithms parameters has played a key role in its perfor-mance. For tuning EICA and ICA for the classication problem, extensive experiments were conducted with diering sets of parameters. At the end, the following sets were found to be eective in terms of solutions quality: the maximum number of iterations (max decade), the number of countries (Npop), the number
of imperialists (Nimp), Probability of Revolution (P R),
Table 2. Values of parameters of EICA and ICA algorithms.
EICA ICA
Parameters Value Parameters Value
maxdecade 100 maxdecade 100
Npop 100 Npop 200
Nimp 5 Nimp 5
P R 0.1 P R 0.1
RR 0.3 RR 0.3
0 0.2
nal 0.05
and nal search parameter (nal). The values of EICA
and ICA parameters are represented in Table 2. 5.4. Hardware and software specications EICA and ICA algorithms were implemented in MAT-LAB software (version 7.10.0.499, R2010a) and run on a 1.6 GHz laptop with 6 GB of RAM under a 64-bit Windows operating system.
6. Experimental results and discussion
The experimental part of the paper is structured in ve subsections. First, in order to show the improvement obtained using EICA compared to the original ICA [33], we compare EICA with ICA. Second, we compare the performance of EICA with that of well-developed algorithms in classication (i.e., PSO [29], ABC [30], FA [31], GSA [28], and GGSA [32]). Third, the performance of EICA is compared against those of
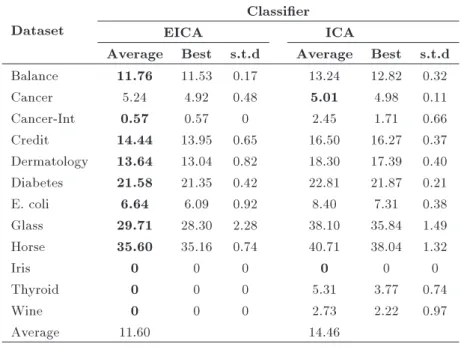
the other nine classication techniques well known in literature reported in [15] as: Bayes Net [55], Multi-Layer Perception articial neural network (MLP) [56], Radial Basis Function articial neural network (RBF) [57], K Star [58], Bagging [59], Multi Boost AB [60], Naive Bayes Bayes Tree (NB Tree) [61], ripple down rule (Ridor) [62], and Voting Feature Interval (VFI) [63]. Fourth, one additional comparison between all classication methods is considered. Finally, a dis-cussion section from the results obtained is considered. 6.1. Comparison between EICA and ICA In order to show the improvement obtained using EICA compared to ICA, the 12 datasets are used once more. The comparison of results for each dataset is based on the average CEP obtained after more than 20 dierent simulations. For any dataset, the best results (i.e., lowest) based on f1, f2, and f3 are indicated in bold
type. The results are summarized in Tables 3-5. As it can be easily seen in these tables, EICA performs consistently better than ICA in most of the datasets. For example, the results shown in Table 3 indicate that the proposed EICA algorithm outperforms the basic ICA algorithm for 11 datasets. Compared to the basic ICA classier, the proposed EICA algorithm has respectively improved the classication accuracy rates of the Horse dataset by 12.55%, the Glass dataset by 22.02%, the Dermatology dataset by 25.46%, and the Cancer dataset by 22.60%. These results are also depicted in Figure 12.
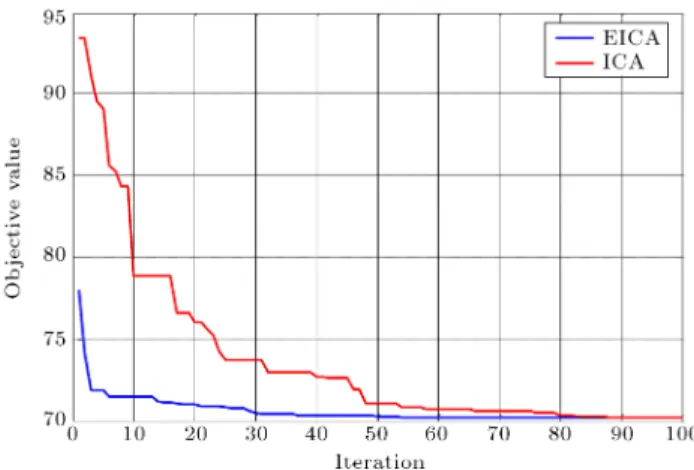
Figure 13 provides more insight into the conver-gence rate of EICA and ICA algorithms for the best solutions to Iris dataset. Simulation results of the gure show that EICA algorithm converges faster than
Table 3. Average classication error percentages of EICA and ICA based on f1.
Dataset
Classier
EICA ICA
Average Best s.t.d Average Best s.t.d Balance 11.76 11.53 0.17 13.24 12.82 0.32
Cancer 5.24 4.92 0.48 5.01 4.98 0.11
Cancer-Int 0.57 0.57 0 2.45 1.71 0.66
Credit 14.44 13.95 0.65 16.50 16.27 0.37
Dermatology 13.64 13.04 0.82 18.30 17.39 0.40 Diabetes 21.58 21.35 0.42 22.81 21.87 0.21
E. coli 6.64 6.09 0.92 8.40 7.31 0.38
Glass 29.71 28.30 2.28 38.10 35.84 1.49
Horse 35.60 35.16 0.74 40.71 38.04 1.32
Iris 0 0 0 0 0 0
Thyroid 0 0 0 5.31 3.77 0.74
Wine 0 0 0 2.73 2.22 0.97
Table 4. Average classication error percentages of EICA and ICA based on f2.
Dataset
Classier
EICA ICA
Average Best s.t.d Average Best s.t.d
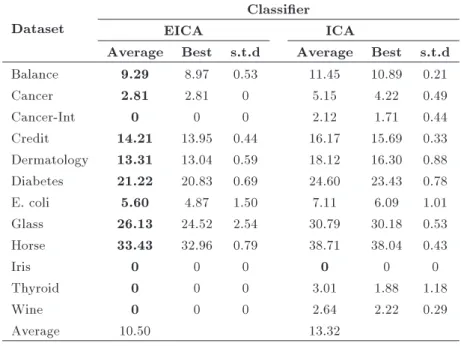
Balance 9.29 8.97 0.53 11.45 10.89 0.21
Cancer 2.81 2.81 0 5.15 4.22 0.49
Cancer-Int 0 0 0 2.12 1.71 0.44
Credit 14.21 13.95 0.44 16.17 15.69 0.33
Dermatology 13.31 13.04 0.59 18.12 16.30 0.88 Diabetes 21.22 20.83 0.69 24.60 23.43 0.78
E. coli 5.60 4.87 1.50 7.11 6.09 1.01
Glass 26.13 24.52 2.54 30.79 30.18 0.53
Horse 33.43 32.96 0.79 38.71 38.04 0.43
Iris 0 0 0 0 0 0
Thyroid 0 0 0 3.01 1.88 1.18
Wine 0 0 0 2.64 2.22 0.29
Average 10.50 13.32
Table 5. Average classication error percentages of EICA and ICA based on f3.
Dataset
Classier
EICA ICA
Average Best s.t.d Average Best s.t.d Balance 10.44 10.25 0.42 12.00 11.53 0.43
Cancer 3.69 3.52 0.38 4.88 4.22 0.62
Cancer-Int 0 0 0 2.55 2.28 0.24
Credit 14.30 13.95 0.47 16.20 15.69 0.71
Dermatology 13.42 13.04 0.63 17.92 16.30 1.08 Diabetes 20.37 20.31 0.15 23.05 21.87 0.81
E. coli 6.52 6.09 0.81 6.23 6.11 0.21
Glass 25.37 24.52 1.43 37.98 37.73 0.18
Horse 33.29 32.96 0.69 39.01 38.04 0.33
Iris 0 0 0 3.11 2.63 0.47
Thyroid 0 0 0 3.54 1.88 1.13
Wine 0 0 0 1.88 0 0.41
Average 10.62 14.02
ICA algorithm. EICA algorithm converges in about 50 iterations to the global optimum, while ICA converges to the global optimum after 90 iterations.
In order to illustrate the signicant dierences among the results obtained by the proposed EICA and ICA, statistical testing is used. Because the obtained results may present neither normal distribution nor ho-mogeneity of variance, we suggest using non-parametric tests [64]. Specically, the Friedman test [65], as well as the Iman-Davenport test [66], is employed to determine whether there are signicant dierences in the results of clustering algorithms or not.
Tables 6-8 present the p-value computed by the Friedman test and the Iman-Davenport test, which conrm the existence of signicant dierences between the performances of EICA and ICA algorithms. 6.2. Comparison between EICA and
well-developed algorithms
For a better comparison, the results of EICA and other optimization algorithms based on f1, f2, and f3 are
shown in Tables 9-11. For any dataset, the best results are indicated in bold type. The reason is that the number of classiers considered for comparison using
Figure 12. Comparison between EICA and ICA: (a) Based on f1, (b) based on f2, and (c) based on f3.
Figure 13. Convergence rate of EICA and ICA algorithms for the best solutions in Iris dataset.
three tness functions in the tables is not the same, which is due to the fact that there are no results on tness functions f1 and f3 in [30-32].
Table 6. Results of Friedman and Iman-Davenport's tests [64] based on f1.
Method Statistical
value p-value Hypothesis
Friedman 6.75 0.009 Rejected
Iman-Davenport 14.142 0.003 Rejected Table 7. Results of Friedman and Iman-Davenport's tests [64] based on f2.
Method Statistical
value p-value Hypothesis Friedman 10.08 0.001 Rejected Iman-Davenport 57.75 0.000 Rejected Table 8. Results of Friedman and Iman-Davenport's tests [64] based on f3.
Method Statistical
value p-value Hypothesis
Friedman 8.33 0.004 Rejected
Iman-Davenport 24.967 0.000 Rejected Table 9. Average classication error percentages of PSO, GSA, and EICA based on f1.
Dataset Classier
PSO GSA EICA
Balance 25.47 12.67 11.7608 Cancer 5.80 1.53 5.2464 Cancer-Int 2.87 0.97 0.5714 Credit 22.96 14.36 14.4447 Dermatology 5.76 3.80 13.6413 Diabetes 22.50 21.40 21.5883 E. coli 14.63 7.37 6.6463 Glass 40.18 33.01 29.7169 Horse 40.98 33.91 35.6043
Iris 2.63 1.84 0
Thyroid 5.55 3.14 0
Wine 2.22 0.90 0
In Table 9, EICA results are the best in compari-son with the other algorithms based on tness function f1. The proposed method obtained good results with
the dataset Balance, Cancer-Int, E. coli, Glass, Iris, Thyroid, and wine and outperformed other classiers.
In Table 10, the quality obtained by the proposed algorithm based on tness function f2 is much
bet-ter than the other algorithms in Balance and Glass datasets.
Finally, according to Table 11, in 75% of datasets (i.e., Balance, Cancer-Int, Credit, Diabetes, E. coli, Glass, Iris, Thyroid, and Wine), EICA algorithm
Table 10. Average classication error percentages of PSO, GSA, ABC, FA, GGSA, and EICA based on f2.
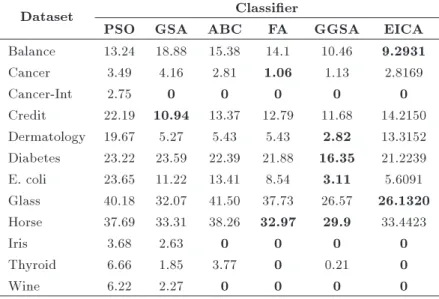
Dataset Classier
PSO GSA ABC FA GGSA EICA
Balance 13.24 18.88 15.38 14.1 10.46 9.2931
Cancer 3.49 4.16 2.81 1.06 1.13 2.8169
Cancer-Int 2.75 0 0 0 0 0
Credit 22.19 10.94 13.37 12.79 11.68 14.2150 Dermatology 19.67 5.27 5.43 5.43 2.82 13.3152 Diabetes 23.22 23.59 22.39 21.88 16.35 21.2239 E. coli 23.65 11.22 13.41 8.54 3.11 5.6091 Glass 40.18 32.07 41.50 37.73 26.57 26.1320 Horse 37.69 33.31 38.26 32.97 29.9 33.4423
Iris 3.68 2.63 0 0 0 0
Thyroid 6.66 1.85 3.77 0 0.21 0
Wine 6.22 2.27 0 0 0 0
Table 11. Average classication error percentages of PSO, GSA, and EICA based on f3.
Dataset Classier
PSO GSA EICA
Balance 13.12 12.92 10.4487 Cancer 3.49 1.39 3.6971 Cancer-Int 2.64 0.91 0 Credit 18.77 14.42 14.3022 Dermatology 6.08 4.12 13.4239 Diabetes 21.77 20.88 20.3770 E. coli 13.90 7.31 6.5241 Glass 38.67 31.89 25.3773 Horse 35.16 33.15 33.2960
Iris 5.26 2.89 0
Thyroid 3.88 3.14 0
Wine 2.88 1.58 0
has the best performance of the other optimization algorithms.
6.2.1. Comparison between EICA and GGSA algorithms
The results reported in Table 10 show that EICA obtained acceptable results in comparison with GGSA; GGSA gets better results in the case of the datasets Cancer, Credit, Dermatology, Diabetes, and E. coli, whereas both EICA and GGSA get the same results in the case of Iris, Wine, and Cancer-Int datasets.
To be able to make a good comparison between EICA and GGSA algorithms, we conduct Friedman's and Iman-Davenport's tests. Table 12 shows the re-sultant p-values when comparing among EICA and GGSA on the 12 benchmark datasets. Based on the
Table 12. Results of Friedman and Iman-Davenport's tests based on f2.
Method Statistical
value p-value Hypothesis Friedman 0.75 0.386 Not rejected Iman-Davenport 0.7333 0.4101 Not rejected
results, it can be seen that there is no statistical signicance between EICA and GGSA algorithms. 6.3. Comparison between EICA and
well-known classication techniques Table 13 shows the results of EICA and nine well-known classication techniques in the literature in each of the 12 databases with respect to the average CEP. For any dataset, the best results are indicated in bold type. As can be seen, in 58% of dataset (i.e., Balane, Cancer-Int, Diabetes, E.coli, Iris, Thyroid, and Wine), EICA algorithm has the best performance compared to the classication techniques.
6.4. General comparisons
Table 14 shows the average of CEP obtained by all algorithms in each dataset, and their corresponding rank is shown in bracket. For any dataset, the best results are indicated in bold type. Note that we consider the best sum average of CEP found algorithms based on f1, f2, and f3as a criterion for the comparison
being fair. For example, when we mention EICA performance, we will make reference to that of EICA based on f2.
Researchers were interested to nd out which algorithm, out of 16 algorithms, have superior classi-cation accuracy. Hence, two comparisons for evaluation between all algorithms can be considered. The rst comparison is based on average CEP in all datasets;
Table 13. Average classication error percentages of EICA and the classiers given in [29].
Dataset Bayes Classier
net
MLP
ANN RBF
K
Star Bagging
Multi boost
NB
tree Ridor VFI EICA Balance 19.74 9.29 33.61 10.25 14.77 24.20 19.74 20.63 38.85 9.29
Cancer 4.19 2.93 20.27 2.44 4.47 5.59 7.69 6.36 7.34 2.81
Cancer-Int 3.42 5.25 8.17 4.57 3.93 5.14 5.71 5.48 5.71 0
Credit 12.13 13.81 43.29 19.18 10.68 12.71 16.18 12.65 16.47 14.21 Dermatology 1.08 3.26 34.66 4.66 3.47 53.26 1.08 7.92 7.60 13.31 Diabetes 25.52 29.16 39.16 34.05 26.87 27.08 25.52 29.31 34.37 21.22 E. coli 17.07 13.53 24.38 18.29 15.36 31.70 20.7 17.07 17.07 5.60 Glass 29.62 28.51 44.44 17.58 25.36 53.70 24.07 31.66 41.11 26.13 Horse 30.76 32.19 38.46 35.71 30.32 38.46 31.86 31.86 41.75 33.44
Iris 2.63 0.00 9.99 0.52 0.26 2.63 2.63 0.52 0.00 0
Thyroid 6.66 1.85 5.55 13.32 14.62 7.40 11.11 8.51 11.11 0
Wine 0.00 1.33 2.88 3.99 2.66 17.77 2.22 5.10 5.77 0
Table 14. Achieved results in terms of average classication error percentages of the classiers given in [29] and the ve classiers PSO, GSA, ABC, FA, ICA, and GGSA.
Dataset Bayes Classier
net MLP
ANNRBF KStar Bagging Multiboost NB
tree Ridor VFI PSO GSA ABC FA ICA GGSA EICA Balance 19.74 9.29 33.61 10.25(11) (1) (15) (3) 14.77(9) 24.20 19.74 20.63 38.85 13.12 12.92 15.38 14.1 11.45 10.46(14) (11) (13) (16) (7) (6) (10) (8) (5) (4) 9.29(1)
Cancer 4.19(9) 2.93 20.27 2.44(7) (16) (4) 4.47(10) 5.59 7.69 6.36 7.34 3.49 1.39 2.81 1.06 5.15(12) (15) (13) (14) (8) (3) (5) (1) (11) 1.13(2) 2.81(5) Cancer-Int 3.42(8) (12) (16) (10)5.25 8.17 4.57 3.93(9) 5.14 5.71 5.48 5.71 2.64 0.91(11) (14) (13) (14) (7) (5) (1)0 (1)0 2.12(6) (1)0 (1)0
Credit 12.13 13.81 43.29 19.18 10.68(3) (8) (16) (15) (1) 12.71 16.18 12.65 16.47 18.77 14.42 13.37 12.79 16.17 11.68 14.21(5) (12) (4) (13) (14) (10) (7) (6) (11) (2) (9) Dermatology 1.08 3.26 34.66 4.66(1) (4) (15) (7) 3.47(5) 53.26 1.08 7.92 7.60 6.08 4.12 5.43 5.43 18.12 2.82(16) (1) (12) (11) (10) (5) (8) (8) (14) (3) 13.31(13)
Diabetes 25.52 29.16 39.16 34.05(8) (12) (16) (14) 26.87(10) 27.08 25.52 29.31 34.37 21.77 20.88 22.39 21.88 24.60 16.35 21.22(11) (8) (13) (15) (4) (2) (6) (5) (7) (1) (3) E. coli 17.07 13.53 24.38 18.29(10) (7) (15) (13) 15.36(9) 31.70 20.73 17.07 17.07 13.90 7.31 13.41 8.54 7.11 3.11(16) (14) (10) (10) (8) (4) (6) (5) (3) (1) 5.60(2)
Glass 29.62 28.51 44.44 17.58 25.36(7) (6) (15) (1) (3) 53.70 24.07 31.66 41.11 38.67 31.89 41.50 37.73 30.79 26.57 26.13(16) (2) (9) (13) (12) (10) (14) (11) (8) (5) (4)
Horse 30.76 32.19 38.46 35.71(3) (6) (13) (11) 30.32(2) 38.46 31.86 31.86 41.75 35.16 33.15 38.26 32.97 38.71 29.90 33.44(13) (4) (4) (16) (10) (8) (12) (7) (15) (1) (9) Iris 2.63(11) (1) (16)0 9.99 0.52(9) 0.26(8) 2.63 2.63 0.52(11) (11) (9) (1) (15) (14) (1) (1) (1)0 5.26 2.89 0 0 0 (1)0 (1)0
Thyroid (10)6.66 1.85 5.55 13.32(4) (9) (15) 14.62(16) 7.40 11.11 8.51 11.11 3.88 3.14 3.77(11) (13) (12) (13) (8) (6) (7) (1) (5)0 3.01 0.21(3) (1)0 Wine (1)0 1.33 2.88 3.99(6) (11) (13) 2.66(10) 17.77 2.22 5.10 5.77 2.88 1.58(16) (8) (14) (15) (11) (7) (1) (1) (9)0 0 2.64 (1)0 (1)0
Table 15. Average classication error percentages in all data sets for each of the 15 dierent classiers along with the new relative obtained ranks.
Dataset
Classier Bayes
net MLP
ANNRBF KStar Bagging Multiboost NB
tree Ridor VFI PSO GSA ABC FA ICA GGSA EICA Average 12.73 11.75 25.40 13.71 12.73 23.30 14.04 14.75 18.92 13.80 11.21 13.02 11.20 13.32 8.52 10.50
Rank 6 5 16 10 6 15 12 13 14 11 4 8 3 9 1 2
Table 16. The sum of rankings of Table 12 on each column. Dataset
Classier Bayes
net MLP
ANNRBF KStarBagging Multiboost NB
treeRidor VFI PSO GSA ABC FA ICA GGSA EICA
Average 80 78 154 114 92 152 113 126 151 114 80 78 52 95 25 50
Rank 6 4 16 11 8 15 10 13 14 11 6 4 3 9 1 2
the second one is based on the sum of ranking of the techniques. In Table 15, the rst and second rows are the average of each column of Table 14 and the general ranking achieved by techniques based on the rst row, respectively. Table 16 is also based on the sum of ranking of all the techniques in Table 14. It is obvious that the lower rank is better. At a glance, the proposed EICA algorithm stands alone in the second rank after GGSA algorithm compared to other algorithms.
The computational results demonstrate that the proposed classier is accurate and reliable. In other words, EICA obtains a good CEP value and ranks the rst in most of the datasets, while the other techniques that are specically tailored for classication do not achieve any rst-ranking (i.e., RBF, MultiBoost, Ridor, and PSO).
6.5. Discussion
In this paper, a prototype-based classication using extended imperialist has been proposed. According to the results of Subsection 6.2, EICA algorithm signicantly outperforms the traditional ICA. There are two major dierences that might contribute to the better performance of the EICA.
The rst reason is that EICA uses an ecient assimilation function to increase the searching around the imperialist. This function not only uses dierent random values, but also utilizes the orthogonal colony-imperialistic contacting line instead of for deviating the colony.
The second reason is the new revolution strategy in the EICA. In this strategy, in order to balance the trade-o between the exploration and exploitation of the EICA, a proper method is considered to control the usage rate of search parameter.
The proposed EICA algorithm, as a general-purpose technique, obtains good result, and shows that it can be successfully applied as classier to
classication problems. However, we cannot guarantee that our algorithm copes with all limitations.
For example, EICA behavior, in terms of problem size (H), in which H = OS, and the number of cluster (K) in dierent datasets are compared to those of other optimization algorithms. Consequently, it seems that the results of EICA are better for the datasets with intermediate H values, and its accuracy tends to decrease with an increasing number of cluster.
An important research issue is the investigation of the reasons for the above-mentioned behavior. A sensible hypothesis is that this depends on the number of prototypes used. Using one prototype per class is simple. But, when the class distributions dier from each other, either in the number of patterns, the density of the patterns, or the shape of the classes, the optimal number of prototypes may be dierent from each other.
Another hypothesis is that this behavior depends on the length of a solution. The length of a solution is proportional to the number of clusters. A large number of clusters complicate the search space, and more execution iteration is required to obtain a satisfying solution.
In the rst case, automatically learn the number of prototypes needed to represent every class if needed; allocate dierent number of prototypes for dierent classes with dierent distributions or shapes. In the second case, more iteration might be necessary to obtain a satisfying solution. Hence, the rst research issue for our future work should be to nd possible ways to get rid of this limitation.
7. Conclusion
Classication is one of the robust methods applied by many researchers in several scientic elds. Re-cently, many of optimization algorithms have been
proposed based on the simulation of the natural pro-cesses in some of the prototype based techniques. In this research, the Extended Imperialist Compet-itive Algorithm (EICA) is employed to solve the problem of classication. The eciency of the pro-posed EICA-based classier is compared with the best-developed optimization-based classiers including ABC, FA, PSO, GSA, GGSA, original ICA, and nine well-known classication techniques from the litera-ture; the following results were obtained.
The quality of the result obtained by our proposed algorithm based on the tness function f1, f2, and f3
is much better than the other optimization algorithms in some of datasets.
EICA algorithm signicantly outperforms tradi-tional ICA in terms of the best and average CEP found using f1, f2, and f3after more than 20 dierent
simulations in each dataset.
EICA algorithm has better performance than that of the classication techniques in about 40% of dataset. Some relationships between problem size, num-ber of cluster in dierent datasets, and optimization algorithm performance have been hypothesized in com-ments on experimental results. However, it seems that the accuracy of the optimization algorithms tends to decrease with increasing values' problem size and number of clusters. The rst research issue for our future work should be to nd possible ways to get rid of this limitation. Another suggestion for future research is to compare EICA with some relevant papers that modied revolution strategy.
References
1. Michie, D., Spiegelhalter, D.J. and Taylor, C.C., Ma-chine Learning, Neural and Statistical Classication, Englewood, NJ: Prentice Hall (1994).
2. Mitchell, T., Machine Learning, McGraw-Hill, ISBN 0070428077 (1997).
3. Duda, R.O., Hart, P.E. and Stork, D.G., Pattern Classication, Second Ed., Wiley, New York (2001).
4. Hastie, T., Tibshirani, R. and Friedman, J., The Ele-ments of Statistical Learning: Data Mining, Inference, and Prediction, Springer (2001).
5. Phyu, T. \Survey of classication techniques in data mining", Proceedings of the International Multi Con-ference of Engineers and Computer Scientists, I, IMECS 2009, Hong Kong, March, pp. 18-20 (2009).
6. Gun, G., Ma, C. and Wu, J. \Data clustering: Theory, algorithms, and applications", Asa-Siam Series on Statistics and Applied Probability (2007).
7. Jain, A. \Data clustering: 50 years beyond k-means", Pattern Recognition, Lett, 31, pp. 651-666 (2010).
8. Jain, A.K., Murty, M.N. and Flynn, P.J. \Data clustering: a review", ACM Comput. Surv., 3, pp. 264-323 (1999).
9. Wu, J.Y. \MIMO CMAC neural network classier for solving classication problems", Applied Soft Comput-ing, 2, pp. 2326-2333 (2011).
10. Lu, C.J. and Wu, J.Y. \An ecient CMAC neural network for stock index forecasting", Expert Systems with Applications, 38, pp. 15194-15201 (2011).
11. Justino, E.J.R., Bortolozzi, F. and Sabourin, R. \A comparison of SVM and HMM classiers in the o-line signature verication", Pattern Recognition Letters, 26, pp. 1377-1385 (2005).
12. Mousavi, S.M., Tavakkoli-Moghaddam, R., Vahdani, B., Hashemi, H. and Sanjari, M.J. \New support vec-tor model-based imperialist competitive algorithm for time estimation in new product development projects", Robotics and Computer-Integrated Manufacturing, 29, pp. 157-168 (2013).
13. Saavian, S.R. and Landgrebe, D. \A survey of deci-sion tree classier methodology", IEEE Transactions on Systems, Man, and Cybernetics, 3, pp. 660-674 (1991).
14. Kurzynski, M.W. \The optimal strategy of a tree classier", Pattern Recognition, 16, pp. 81-87 (1983).
15. Aha, D. and Kibler, D. \Instance-based learning algo-rithms", Machine Learning, 6, pp. 37-66 (1991).
16. Gagliardi, F. \Instance-based classiers applied to medical databases: Diagnosis and knowledge extrac-tion", Articial Intelligence in Medicine, 52, pp. 123-139 (2011).
17. Shen, F. and Hasegawa, O. \A fast nearest neighbor classier based on self-organizing incremental neural network", Neural Networks, 10, 1537-1547 (2008).
18. Chou, C.H., Lin, C.C., Liu, Y.H. and Chang, F. \A prototype classication method and its use in a hybrid solution for multiclass pattern recognition", Pattern Recognition, 39, pp. 624-634 (2006).
19. Vapnik, V.N., The Nature of Statistical Learning The-ory, Springer, Berlin, (1995).
20. Borgelt, C. \Prototype-based classication and clus-tering", Ph.D. Thesis, Ottovon-Guericke University Magdeburg (November 2005).
21. Nieddu, L. and Patrizi, G. \Formal methods in pattern recognition: A review", European Journal of Opera-tional Research, 120, pp. 459-495 (2000).
22. Gagliardi, F. \Instance-based classiers to discover the gradient of typicality in data", Articial Intelligence Around Man and Beyond, 6934, pp. 457-462 (2011).
23. Song, H.H. and Lee, S.W. \LVQ combined with simu-lated annealing for optimal design of large-set reference models", Neural Networks, 2, pp. 329-336 (1996).
24. Cover, T.M. and Hart, P.E. \Nearest neighbor pattern classication", IEEE Transactions, Inform. Theory, 13, pp. 21-27 (1967).
25. Veenman, C.J. and Reinders, M.J.T. \The nearest subclass classier: A compromise between the nearest mean and nearest neighbor classier", IEEE Transac-tions on Pattern Analysis and Machine Intelligence, 9, pp. 1417-1429 (2005).
26. Bezdek, J.C. and Kuncheva, L.I. \Nearest prototype classier design: An experimental study", Interna-tional Journal of Intelligent Systems, 16, pp. 1445-1473 (2001).
27. Wilson, D.R. and Martinez, T.R. \Reduction tech-niques for instance-based learning algorithms", Ma-chine Learning, 38, pp. 257-286 (2000).
28. Bahrololoum, A., Nezamabadi-pour, H., Bahrololoum, H. and Saeed, M. \A prototype classier based on grav-itational search algorithm", Applied Soft Computing, 12, pp. 819-825 (2012).
29. De Falco, I., Della Cioppa, A. and Tarantino, E. \Facing classication problems with particle swarm optimization", Applied Soft Computing, 3, pp. 652-658 (2007).
30. Karaboga, D. and Ozturk, C. \A novel clustering approach: Articial bee colony (ABC) algorithm", Applied Soft Computing, 11, pp. 652-657 (2011).
31. Senthilnath, J., Omkar, S.N. and Mani, V. \Clustering using rey algorithm: Performance study", Swarm and Evolutionary Computation, 1, pp. 164-171 (2011).
32. Dowlatshahi, M.B. and Nezamabadi-pour, H. \GGSA: A Grouping Gravitational Search Algorithm for data clustering", Engineering Applications of Articial In-telligence, 36, pp. 114-121 (2014).
33. Atashpaz-Gargari, E., and Lucas, C. \Imperialist competitive algorithm: An algorithm for optimization inspired by imperialist competitive", IEEE Congress on Evolutionary Computation, Singapore (2007).
34. Atashpaz-Gargari, E., Hashemzadeh, F., Rajabioun, R. and Lucas, C. \Colonial competitive algorithm: A novel approach for PID controller design in MIMO distillation column process", Int. J. Intell. Comput. Cybernet, 1, pp. 337-55 (2008).
35. Alaghebandha, M. and Hajipour, V. \A soft computing-based approach to optimise queuing in-ventory control problem", International Journal of Systems Science, 46, pp. 1113-1130 (2013).
36. Niknam, T., TaherianFard, E., Pourjafarian, N. and Rousta, A. \An ecient hybrid algorithm based on modied imperialist competitive algorithm and K-means for data clustering", Engineering Applications of Articial Intelligence, 24, pp. 306-317 (2011).
37. Behnamian, J. and Zandieh, M. \A discrete colonial competitive algorithm for hybrid ow shop scheduling to minimize earliness and quadratic tardiness penal-ties", Expert Systems with Applications, 12, pp. 14490-14498 (2011).
38. Afonso, L.D., Mariani, V.C. and Coelho, L.D.S. \Mod-ied imperialist competitive algorithm based on attrac-tion and repulsion concepts for reliability-redundancy optimization", Expert Systems with Applications, 40, pp. 3794-3802 (2013).
39. Rajabioun, R., Atashpaz-Gargari, E. and Lucas, C. \Colonial competitive algorithm as a tool for Nash equilibrium point achievement", Computational Sci-ence and Its Applications, 5073, pp. 680-695 (2008).
40. Naimi Sadigh, A., Mozafari, M. and Karimi, B. \Manufacturer-retailer supply chain coordination: A bi-level programming approach", Advances in Engi-neering Software, 45, 144-152 (2012).
41. Rahimi, A., Karimi, H. and Afshar-Nadja, B. \Using meta-heuristics for project scheduling under mode identity constraints", Applied Soft Computing, 13, pp. 2124-2135 (2013).
42. Hosseini, S., Khaled, A. and Vadlamani, S. \Hybrid imperialist competitive algorithm, variable neighbor-hood search, and simulated annealing for dynamic facility layout problem", Neural Computing and Ap-plications, 7, pp. 1871-1885 (2014).
43. Hosseini, S., Khaled, A.A. and Jin, M. \Solving Euclidean minimal spanning tree problem using a new meta-heuristic approach: Imperislist competitive algorithm (ICA)", IEEE International Conference on Industrial Engineering and Engineering Management, Hong Kong, pp. 10-13 (2012).
44. Khaled, A.A. and Hosseini, S. \Fuzzy adaptive impe-rialist competitive algorithm for global optimization", Neural Computing and Applications, 26(4), pp. 813-825 (2015).
45. Hosseini, S. and Khaled, A. \A survey on the imperi-alist competitive algorithm metaheuristic: Implemen-tation in engineering domain and directions for future research", Applied Soft Computing, 24, pp. 1078-1094 (2014).
46. Zhang, Y., Wang, Y. and Peng, C. \Improved im-perialist competitive algorithm for constrained op-timization", In Proceedings of International Forum on Computer Science-Technology and Applications, Chongqing, China, pp. 204-207 (2009).
47. Razzaghpour, M. and Rusu, A. \Analog circuit op-timization via a modied imperialist competitive al-gorithm", IEEE International Symposium on Circuits and Systems, pp. 2273-2276 (2011).
48. Duan, H.B., Xu, C.F., Liu, S.Q. and Shao, S. \Tem-plate matching using chaotic imperialist competitive algorithm", Pattern Recognition Lett, 13, pp. 1868-1875 (2010).
49. Kaveh, A. and Talatahari, S. \Optimum design of skeletal structures using imperialist competitive algo-rithm", Computers and Structures, 88, pp. 1220-1229 (2010).
50. Blake, C.L. and Merz, C.J. \University of California at Irvine repository of machine learning databases", http://www.ics.uci.edu/ mlearn/MLRepository. Html (1998).
51. Nazari-Shirkouhi, S., Eivazy, H., Ghodsi, R., Rezaie, K. and Atashpaz-Gargari, E. \Solving the integrated product mix-outsourcing problem using the Imperialist competitive algorithm", Expert Systems with Applica-tions, 37, pp. 7615-7626 (2010).
52. Ben-Arieh, D. and Gullipalli, D.K. \Data envelopment analysis of clinics with sparse data: Fuzzy clustering approach", Computers & Industrial Engineering, 63, pp. 13-21 (2012).
53. Hulse, J.V. and Khoshgoftaar, T.M. \Incomplete-case nearest neighbor imputation in software measurement data", Information Sciences, 259, pp. 410-596 (2014).
54. Eirola, E., Lendasse, A., Vandewalle, V. and Biernacki, V. \Mixture of Gaussians for distance estimation with missing data", Neurocomputing, 131, pp. 32-42 (2014).
55. Ensen, F., An Introduction to Bayesian Networks, UCL Press/Springer-Verlag (1996).
56. Rumelhart, D.E., Hinton, G.E. and Williams, R.J. \Learning representation by back-propagation errors", Nature, 323, pp. 533-536 (1986).
57. Hassoun, M.H., Fundamentals of Articial Neural Networks, The MIT Press, Cambridge, MA (1995).
58. Cleary, J.G. and Trigg, L.E. \K: An instance-based learner using an entropic distance measure", In Proceedings of the 12th International Conference on Machine Learning, pp. 108-114 (1995).
59. Breiman, L. \Bagging predictors", Machine Learn, 2, pp. 123-140 (1996).
60. Webb, G.I. \Multiboosting: A technique for combining boosting and wagging", Machine Learn, 2, pp. 159-196 (2000).
61. Kohavi, R. \Scaling up the accuracy of naive-bayes classiers: a decision tree hybrid", Proceedings of the Second International Conference on Knowledge Discovery and Data Mining, AAAI Press, pp. 202-207 (1996).
62. Compton, P. and Jansen, R. \Knowledge in context: a strategy for expert system maintenance", Proceedings of Articial Intelligence, 406, LNAI, Berlin, Springer-Verlag, Adelaide, Australia, pp. 292-306 (1988).
63. Demiroz, G. and Guvenir, A. \Classication by vot-ing feature intervals", In Proceedvot-ings of the Seventh European Conference on Machine Learning, pp. 85-92 (1997).
64. Garcia, S., Fernandez, A., Luengo, J. and Herrera, F. \Advanced nonparametric tests for multiple compar-isons in the design of experiments in computational intelligence and data mining: experimental analysis of power", Information Sciences, 180(10), pp. 2044-2064 (2010).
65. Friedman, M. \A comparison of alternative tests of signicance for the problem of m rankings", Annals of Mathematical Statistics, 11, pp. 86-92 (1940).
66. Iman, R. and Davenport, J. \Approximations of the critical region of the Friedman statistic", Communica-tions in Statistics, 9, pp. 571-595 (1980).
Biographies
Mohammad Hossein Fazel Zarandi is a Full Pro-fessor in the Department of Industrial Engineering at Amirkabir University of Technology, Tehran, Iran, and a member of the Knowledge-Intelligent Systems Laboratory at Department of Mechanical and Indus-trial Engineering of University of Toronto, Canada. His main research interests focus on: intelligent in-formation systems, soft computing and computational intelligence, Type-1 and Type-2 fuzzy sets and systems, articial intelligence and expert systems, multi-agent systems, networks, big data modeling, data mining, fuzzy rough sets, meta-heuristics, and optimization. Professor Fazel Zarandi has authored many books, scientic journal and referred international conference papers, and technical reports in the above areas, most of which are available on the web. He has taught several courses at several universities in Iran and North America on fuzzy systems engineering, decision support systems, management information systems, articial intelligence and expert systems, systems analysis and design, scheduling, neural networks, simulations, and production planning and control.
Mohammad Teimouri received his BSc in Shomal University on 2009 and MSc degrees in Industrial Engineering from Islamic Azad University, Qazvin Branch in 2013, respectively. His research interests are in data mining, combinatorial optimization, and reliability engineering.
Arash Zaretalab is a PhD candidate at the Depart-ment of Industrial Engineering at Amirkabir University of technology (Tehran polytechnic) in Iran. He received his BSc and MSc degrees in Industrial Engineering from Islamic Azad University, Qazvin Branch (IAU). His research interests are in reliability engineering, combinatorial optimization, multi-objective optimiza-tion, computational intelligence, and data mining. Mr. Zaretalab has published a number of papers in journals such as reliability engineering & safety system, computer operation research, computers & industrial engineering among others.
Vahid Hajipour is a PhD candidate in the depart-ment of Industrial Engineering at Bu-Ali Sina Univer-sity in Iran. He is also a Visiting Professor of Indus-trial and Mechanical Engineering at the Islamic Azad
University (IAU). He holds both MS and BS degrees in Industrial Engineering from the IAU. Mr. Hajipour is a member of the Iranian National Elite Foundation and Young Researchers Club. He is the recipient of the 2011, 2013, and 2014 Distinguished Young Researcher Award at the IAU. His areas of interest include queu-ing theory, facility location modellqueu-ing, supply chain network design, reliability theory, multi-objective op-timization, computational intelligence, and fuzzy sets
theory. Mr. Hajipour has published one book and more than 38 papers in reputable academic journals and conferences such as Applied Mathematical Modelling, Computer and Industrial Engineering, IEEE Transac-tion of Engineering Management, Journal of Intelligent Manufacturing, Applied Soft Computing, International Journal of System Science, Measurement, International Journal of Advanced Manufacturing Technology, and among others.
![Figure 5. Imperialistic competition [33].](https://thumb-us.123doks.com/thumbv2/123dok_us/8377350.2225289/5.892.64.416.151.280/figure-imperialistic-competition.webp)
![Figure 6. Moving colonies to its next location [46].](https://thumb-us.123doks.com/thumbv2/123dok_us/8377350.2225289/6.892.481.822.933.1132/figure-moving-colonies-location.webp)