Sharif University of Technology
Scientia IranicaTransactions E: Industrial Engineering www.scientiairanica.com
A framework for performance evaluation of energy
supply chain by a compatible network data
envelopment analysis model
S. Shaei Kaleibari
a;, R. Gharizadeh Beiragh
b, R. Alizadeh
cand M. Solimanpur
b a. Department of Industrial Engineering, Payam Nour University, Tabriz, Iran.b. Department of Industrial Engineering, Urmia University of Technology, Urmia, Iran.
c. Technology Foresight Group, Department of Management Science and Technology, Amirkabir University of Technology, Tehran, Iran.
Received 2 September 2014; received in revised form 31 May 2015; accepted 25 July 2015
KEYWORDS Network Data Envelopment Analysis (NDEA);
Assurance Region (AR);
Data Envelopment Analytic Hierarchy Process (DEAHP); Energy supply chain; Technical eciency.
Abstract.Inadequate supply of energy has become one of the major problems in societies due to consumers' increasing demand. Economic growth is a key reason for the increase in the energy consumption. Although dierent policies can be employed for resolving this problem, optimizing the eciency of energy suppliers can be addressed as a key policy in this regard. This paper presents an adjusted Network Data Envelopment Analysis (NDEA) model for evaluating performance of energy supply chain in Iran from production to distribution stages. Some suggestions have been proposed to optimize the performance of the energy supply chain. The NDEA model is adjusted by using Assurance Region (AR) to achieve more realistic and scientic results. Borders of the assurance region obtained from Data Envelopment Analytic Hierarchy Process (DEAHP) method are entered into the NDEA model. The results obtained from this model are compared with those of conventional NDEA and technical eciency in pairs. Finally, the Spearman and Kendall's-Tau correlation tests are used for validating the results.
© 2016 Sharif University of Technology. All rights reserved.
1. Introduction
There are several ways to meet the growing demands of energy and to achieve sustainable economic growth, such as rising energy generation, utilizing advanced technologies, and so forth. However, considering high energy intensity in Iran [1,2], improving the energy eciency can be considered as a cost-eective way to tackle this issue. The rst and necessary step for optimizing the eciency is to measure the
cur-*. Corresponding author. Tel.: +98 4135557489; Fax: +98 4135557489
E-mail addresses: sin shin [email protected] (S. Shaei Kaleibari); [email protected] (R. Gharizadeh Beiragh); [email protected] (R. Alizadeh);
[email protected] (M. Solimanpur)
rent eciency level of units to identify the inecient units. Identifying the most ecient units enables the decision makers to ascertain how inecient units, with similar structures and goals, cannot yield the same outputs. Energy eciency can be considered in dierent stages; the highest increase in performance will be achievable throughout the supply chain of energy. Having ecient systems and optimal use of resources can prevent losses and wastes. Therefore, a slight increase in performance will result in signicant savings. Many studies have been conducted in this area to achieve such important goals. In order to estimate the index, Zhou et al. [3] measured economy-wide energy eciency performance of a sample of OECD by the Shephard energy distance function to dene an energy eciency index and to adopt stochastic frontier
analysis technique. Hu et al. [4] applied the four-stage DEA procedure to calculate energy eciency of 23 regions in Taiwan from 1998 to 2007. Wang et al. [5] adopted the framework of total factor energy eciency index to determine the discrepancy of energy eciency in Chinese industrial sector based on the provincial statistical data of industrial enterprises in 30 provinces from 2005 to 2009. To evaluate the performance of 29 Electricity Distribution Divisions of Uttarakhand province, Yadav et al. [6] used DEA input-oriented model. They calculated technical and scale eciency of their decision units. In addition, they showed that the highest ineciency of the units is related to their scale ineciency rather than the technical one. See and Coelli [7] calculated the tech-nical eciency of thermal power plants of Malaysia using stochastic frontier analysis method from 1998 to 2005. They demonstrated that ownership, plant size, and fuel type have a signicant eect on technical eciency. Alizadeh et al. [8] analyzed Iran's contri-bution in energy eciency and the environmentally friendly projects supported by United Nations. Jarait_e and Di Maria [9] used DEA model to measure envi-ronmental eciency and productivity for enhancing the performance of the overall EU electricity pro-duction in Europe during 1996 to 2007. They also analyzed changes in productivity and eciency using econometric techniques. Solmes in [10], explained the electrical industry and consumer of energy supply chain by decomposing them into their components. Solmes showed how integration of these systems results in energy saving. In other parts of this book, the reason for ineciency of supply chain system and the increasing costs have been described. Omrani et al. [11] presented an integrated Data Envelopment Analysis (DEA), Corrected Ordinary Least Squares (COLS), Stochastic Frontier Analysis (SFA), Principal Compo-nent Analysis (PCA), and Numerical Taxonomy (NT) algorithm for performance assessment, optimization and policy making of 38 electricity distribution units in Iran. Fallahi et al. [12] made changes in terms of technical eciency and productivity in 32 power management companies in Iran during 2005 to 2009 using a DEA model, and subsequently, veried the sta-bility of their DEA model by a stasta-bility test. Vazhayil and Balasubramanian [13] discussed some strategies grouped into three portfolios; namely, power generation mix, demand side eciency group, and supply side eciency group. Moreover, an optimization model was used for cost, risk, and barrier reduction. this portfolio, subsequently, was combined with higher-level portfolios including economic growth, energy equity, energy security, and climate sustainability. Finally, optimization is done using DEA method, and the results were compared. Pardo Martnez [14] measured energy eciency development in non-energy-intensive
sectors in Germany and Colombia according to a production-based theoretical framework using DEA from 1998 to 2005. He compared performance eciency of the energy sector in Germany and Colombia at two aggregation levels, and then oered alternatives for improving the existing situation. Liang et al. [15] reviewed general equilibrium impact on improving en-ergy end-use eciency on China's economy, enen-ergy use, and CO2 emissions in 2002. To do so, they developed
a static, multi-sector computable general equilibrium model. Bas [16] proposed a hybrid approach by AHP method, combined with SWOT-fuzzy TOPSIS, to formulate strategies with higher priorities for electricity supply chain in Turkey. Huang et al. [17] calculated cost eciency and optimal scale of Taiwan's electricity distribution industry in short and long terms. The 24 units of distribution were studied using stochas-tic meta-frontier method during 1997 to 2002, and deregulation of the electricity distribution industry was analyzed.
Results of performance measurements and bench-marking methods help systems to detect ineciency in their subunits and to improve the eciency of entire units as well as entire supply chain. One of the most widely used methods for performance measurement is Data Envelopment Analysis (DEA), which is an approach based on linear programming developed by Charnes et al. [18]. Classical method of DEA in the performance evaluation of network and multi-step systems does not function properly as all these systems are considered as a whole; i.e. each Decision Making Unit (DMU) is considered as a black box in which interactions of subunits within the system are ignored. Briey, calculations are limited to initial inputs and nal outputs. To overcome this problem, NDEA was provided as a network DEA by Fare and Grosskopf [19] for the rst time. Unlike traditional models, these models do not have a formula and are dened based on the type and structure of their networks. This method can, in addition, show the interaction between the internal processes and compute the overall eciency and eciency of the subsystems. In recent years, extensive studies have been conducted to overcome the drawbacks of the classic DEA, and dierent solutions have been proposed. Castelli et al. [20] evaluated the eectiveness of specic and interdependent subunits for making larger decision-making units. Lewis and Sexton [21] oered a model in which units included a network of linked subunits, where some of the subunits pro-duced resources for other subunits, and other propro-duced resources were consumed by other subunits. They formulated NDEA model for the structure of their outputs and inputs. Prieto and Zofo [22] evaluated technical eciency by comparing appropriate technolo-gies of dierent economies, meanwhile by considering
an analytical framework, they let the input-output models to be regarded as a network. This network of inputs and outputs was optimized using produc-tion eciency measures. They, addiproduc-tionally, imple-mented an input-output model for OECD countries with a network data envelopment analysis. Bai-Chen et al. [23] obtained China's energy system eciency in both economic and environmental aspects using NDEA, and showed that form of production has a signicant impact on environmental performance. Chen and Yan [24] presented three NDEA models for evaluating supply chain performance, which consider the internal structure of supply chain and their in-teractions simultaneously. They calculated losses of internal sources in the supply chain. Kao [25] oered a relational NDEA that considered the interactions within the system. With the idea of dening a dummy process, the primary network could become a series network in which each of the series is considered as a parallel structure. Kao and Hwang [26] assessed the eect of IT on organizational performance in banking industry using an NDEA model. Tone and Tsutsui [27] proposed a slacks-based network DEA model, called network SBM, which could deal with intermediate products. This model can evaluate divisional and the overall eciency of decision-making units. Hsieh and Lin [28] used a model of NDEA to evaluate eciency and eectiveness of international hotels in Taiwan considering internal interactions. Moreover, they suggested some ways for increasing the eciency of their performance. Matthews [29] examined risk management of China's banks and divided units to environmental and organizational risk management. These units were, subsequently, entered as intermediate products into the NDEA model to calculate the amount of income eciency. Zhao et al. [30] presented a model for evaluating a downtown space reservation based on NDEA. Input of this model is obtained using trac microscopic simulation data. Finally, results were compared and evaluated using those of radial and slacks-based network DEA models to validate the model.
As there are many dierences between entities related to energy supply chain, a comprehensive evalu-ation that considers all these entities simultaneously in national scale is very challenging; there has not been notable study in this instance. This tool is mainly required for authorities of energy industry to evaluate and analyze the whole energy supply chain at the same time. A desired model for this purpose should yield summarized and integrated results, which facilitates decision making for managers and authorities as well as performing eective optimization. Therefore, in this paper, we aim to develop a model for evaluating energy supply chain including production, transmission, and distribution stages simultaneously by considering all
the interactions and relations throughout the supply chain stages. The model, additionally, has the ability to show which changes should be taken for inecient units to make them ecient. However, the real optimization will be achievable mainly by the discretion of upper level managers with the aid of these directions. The model proposed for this purpose is a compatible Net-work Data Envelopment Analysis, and the case study for practical implementation is Iran's energy supply chain during 2007 to 2011 in dealing with seventeen basic indices. The considered indices for production stage are the cost of fuel and labor as inputs, and the generated energy as output. For transmission stage, the inputs are the station capacity, the length of transmission lines, the imported energy from neigh-boring power companies, the labor and the delivered energy to this section; and the outputs are energy losses, exported energy, and the energy delivered to distribution companies. Finally, in distribution stage, the input is the delivered energy from this stage, and the outputs are the sold energy and the number of customers.
In DEA model, the obtained optimal weights totally depend on the amount and pattern of data and this characteristic sometimes leads to assigning unreasonable weights to some indices. Consequently, the obtained eciency values sometimes have a gap with reality. DEA does not consider how much an input or output is important for decision makers; it merely assigns weights in a way that enhances the output-input rate. This fact implies the objectiveness of DEA. The results obtained by objective method are based on the values of data and their distribution. To prevent obtaining objective results and utilizing ex-perts' viewpoint, assurance region can be applied in the DEA model. It leads to achieve more realistic results. In addition, it prevents DEA model from assigning irrational weights to indices, which are important for experts. Therefore, the results will be both subjective and objective. In addition, assurance region brings about more discriminative results.
In order to enter assurance region into DEA model, it is necessary to calculate the bounds for weights. For this propose, there are several methods for obtaining priorities in AHP. Wang et al. [31] used a DEA model with the assurance region known as DEA/AR to overcome limits of DEAHP method such as illogical local weights, high insensitivity to some comparisons, and the loss of data. They, rst, intro-duced the method of DEAHP, next provided a numer-ical example to discuss weaknesses of this method in terms of calculating weights of DEA models. In another article, to solve the problems of the previous article, Wang and Chin [32] proposed a new method of DEA to set priorities in the AHP, and developed it for grouped AHP. This model obtained the best weights of indices
from paired comparisons matrix. In this method, compatibility or incompatibility is not important, and both cases result in optimal weights. In this paper, the two ways developed by Wang and Chin have been explained and the last one is applied to the model for obtaining the weights. Obtained weights have been entered into the NDEA model as upper bounds of assurance region. In the next step, the eciency values were computed rst by using conventional NDEA, and then by bounded NDEA. Subsequently, to compare the results of these two methods, results of technical eciency were used. Technical eciency is dened as the ratio of weighted outputs to weighted inputs in which weights were obtained by the method of Wang and Chin [32]. The results were analyzed and their correlation was compared in pairs by Spearman and Kendal's-Tao correlation tests in order to verify and validate the results. Finally, some points are suggested in the case of optimization by analyzing amounts of slack and surplus values.
2. Methodology
2.1. Technical eciency as output to input ratio
Eciency index in units that include one input (x) and one output (y) is dened as yx; if multiple inputs and outputs exist in a unit or organization, coecients should be allocated to inputs and outputs. Inputs have dierent eects on making outputs. Therefore, they should be selected according to their coecients. Technical eciency can be dened as the ratio of weighted outputs to weighted inputs as addressed by Cooper et al. [33]. This index is expressed as follows:
T Ej= vu1y1j+ u2y2j+ + unynj 1x1j+ v2x2j+ + vmxmj =
n
P
r=1uryrj m
P
s=1vsxsj
; (1) where `x' and `y' are inputs and outputs, `v' and `u' are weights of inputs and outputs, respectively, `m' is the number of inputs, `n' is the number of outputs and `j' represents jth DMU. In this study, weights of inputs and outputs are obtained using Wang and Chin's method [28]. Thus, the weights of inputs, outputs, and obtained eciency scores are consistent and reliable. Eciency scores obtained by Eq. (1) is a basis for comparing the results of other methods. 2.2. Network data envelopment analysis
Network DEA has two overall structures: series and parallel. In a decision-making unit, when dierent parts of activities are placed along with each other, the system is series. In this case, total inputs of system enter from the rst part, and the nal outputs
exit from the end. However, in parallel networks, all processes within the system have a parallel structure. Using these two structures, Kao [25] developed models for evaluating network decision-making, which were dened based on multiplying eciency of subunits. The supply chain of this paper is a combination of both types of structures.
2.3. DEA/AR model
In order to avoid obtaining zero values for dened indexes' weights (weights of outputs and inputs for case), there should be some boundaries for optimal weights (v
i; uj) in DEA model. This will result in an
eciency score for each DMU in which all indexes have eects on the obtained score, and none of them gets zero weight in calculation of the eciency score. This is the reason that leads to the emergence of assurance region, which relatively limits the amount of assigned weights. In this paper, the model developed by Wang and Chin [32] is used to get the upper bounds of weights in NDEA. Let:
A = (aij)nn=
2 6 6 6 4
a11 a12 a1n
a21 a22 a2n
... ... ...
an1 an2 ann
3 7 7 7
5; (2)
be a pair-wise comparison matrix (obtained according to experts' opinions) in which aij is the importance
of ith index versus jth index with aii = 1, and
aji = 1=aij and W = (w1; ; wn)T is the priority
vector. Hereafter, algorithm for calculating weights is dierent from standard AHP method. In DEAHP, each row of the matrix A is presented as a DMU and each column is presented as an output, which assumes a dummy value of one as input for all DMUs. Each DMU has, therefore, an output and one dummy constant input based on which the following input-oriented CCR model is constructed to estimate local priorities (weights) of the pair-wise comparison matrix A:
max w1=
n
X
j=1
a1jvj;
subject to: u1= 1;
n
X
j=1
aijvj u1 0; i = 1; : : : ; n;
u1; vj 0; j = 1; ; n: (3)
In the above model, w1shows eciency score for DMU1
can be used instead of AHP priority weight for rst index. For each row, Model (3) is computed and run as a DMU. However, nal weights of indexes w =
(w
1; ; wn)T are calculated by Model (3) if pair-wise
comparison matrix A is fully consistent.
Wang and Chin (2009) [28] showed that Model (3) can sometimes be in conict with inconsistent pair-wise comparison matrix. To overcome the shortcomings of DEAHP, they developed a method of DEA to deter-mine priorities in AHP, which produced true weights for the perfectly consistent pair-wise comparison ma-trix. It, additionally, could produce the best local priorities for inconsistent pair-wise comparison matrix that were logical and consistent with the subjective judgments of decision-makers. The proposed model is as follows:
maximize w1= n
X
j=1
a1jvj;
subject to:
n
X
j=1 n
X
i=1
aij
! vj= 1;
n
X
j=1
aijvj nvi; i = 1; ; n;
vj 0; j = 1; ; n: (4)
Solving the above linear programming model for each wi will yield the best weight for each index or choice.
In this paper, to obtain upper bounds of weights for NDEA, Model (4) is used. Therefore, entering experts' viewpoint led to preventing unrealistic DMU eciency.
3. Case study
Generally, energy supply chain includes generation and distribution. Manufacturing power plants generate electricity and distribution companies distribute the generated electricity among consumers. In this chain, plants (regardless of the generating way) are considered as energy suppliers for the distribution section. In a similar way, distribution companies are electricity suppliers for consumers. Electricity generation and delivering have great complexity in the supply chain due to the climatic conditions and geographical speci-cations of the area. Regional power companies in Iran, which are responsible for electricity production and delivery to distribution companies, have similar goals, missions, tasks, and activities. The dierence is often in the volume of activities, the extent of geography, and the overall structure of companies which will follow the same structural pattern.
3.1. First part of supply chain structure: Regional electricity generation companies The prinicipal part of power industry is power gen-eration section. Management of regional electricity companies is responsible for constructing new power plants as well as maintaining and monitoring old ones. 3.2. Second part of supply chain structure:
Regional power transmission companies The location of electricity power plants is determined considering various technological, economic, and social factors such as fuel, water, and the distance to the residential areas (to prevent environmental pollution). Consequently, a standard distance is considered usual in terms of locating power plants, and it should be supported by transmission lines, which act as suppli-ers of power for consumption centsuppli-ers. In addition, transmission establishment is necessary for increasing or decreasing voltage and making adjustment with the centers of generation and consumption. In brief, the electricity generated by power plants is delivered to the distribution network by transmission facilities including posts and transmission lines.
3.3. Third part of supply chain structure: Power distribution companies
Distribution of power is the link between the power industry and customers, and has multiple roles; rst, supplies consumers and sells electricity as an economic goods; second, has a vital technical role in maintaining, operating, and developing the distribution networks; third, maintains communication and coordination with the upstream sectors of energy supply chain. Con-sidering the above description, Iran's electric power supply chain network was designed, in this paper, as follows.
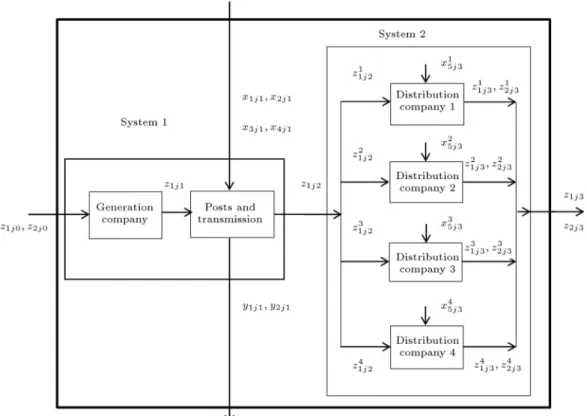
System 1 shows the regional power company and System 2 shows the electricity distribution network. The way that this network has been developed is based on the level of independency in the case of management. Obviously, the three major sections are independent in many elds as well as in management. However, for example, in distribution section, despite similarities between distribution subsystems, they were assigned to private organizations with dierent policies and management methods. Therefore, it is necessary to compare them with each other in order to nd the weaknesses and strengths of each one. There are 16 active regional power companies in Iran that all have been evaluated in this paper. Inputs and outputs of this network were considered according to Iran's Ministry of Energy eciency, and are presented as follows:
z1j0 Cost of fuel;
z2j0 Labor of generation section;
Figure 1. The energy supply chain network in Iran.
z1j2 Delivered energy to distribution
section; z1
1j2 Energy delivered to the rst
distribution company; z2
1j2 Energy delivered to the second
distribution company; z3
1j2 Energy delivered to the third
distribution company; z4
1j2 Energy delivered to the fourth
distribution company;
x1j1 Total station's capacity (mega volt
ampere);
x2j1 Length of transmission lines;
x3j1 Imported energy from neighboring
power companies;
x4j1 Labor of transmission section;
x5j1 Labor of distribution section;
y1j1 Energy losses of transmission;
y2j1 Exported energy to nearby companies;
z1j3 Total sold energy;
z2j3 Number of customers.
All indexes of distribution section, i.e. labor, total sold energy, and number of customers, are dened separately for each of the parallel subsystems of this section. Energy losses of transmission index (y1j1) is an
undesirable output, and lower values for this index are more desirable for decision-makers. Since the objective function in this study was to maximize output, the original values for y1j1 were converted to (y1j1) 1 for
maximizing it, which is desired for this index.
In Figure 1, the second system of supply chain has parallel subsystems. The number of subsystems (distribution companies) is not the same in all DMUs and according to the data, each DMU may have 1, 2, 3, or 4 subsystems as distribution companies. Therefore, the mark \-" is used for some units to indicate the absence of subsystem for distribution section of that DMU. The raw data of this case study belongs to a ve-year period from 2007 to 2011, which have not been brought for saving space. Due to the increasing number of indexes compared to the number of DMUs, thus reducing discriminative power of NDEA, these data were used as time series for ve consecutive years. In fact, each year is considered as one DMU for regional electricity companies. Therefore, the total number of DMUs in this article is 80. Finally, the mean values of eciency of regional power company in the past ve years are considered as the company's eciency score for analyzing the results.
4. Modeling the designed network
According to the descriptions, a comprehensive model, which is a combination of series and parallel structures model, is presented. Iran's energy supply chain
net-Table 1. Weights of indexes.
z1j0 z2j0 z1j1 x1j1 x2j1 x3j1 x4j1 x5j3 y1j1 y2j1 z1j2 z1j3 z2j3
0.1837 0.0167 0.2280 0.1418 0.0225 0.0283 0.0381 0.0104 0.0127 0.088 0.0470 0.1146 0.0682
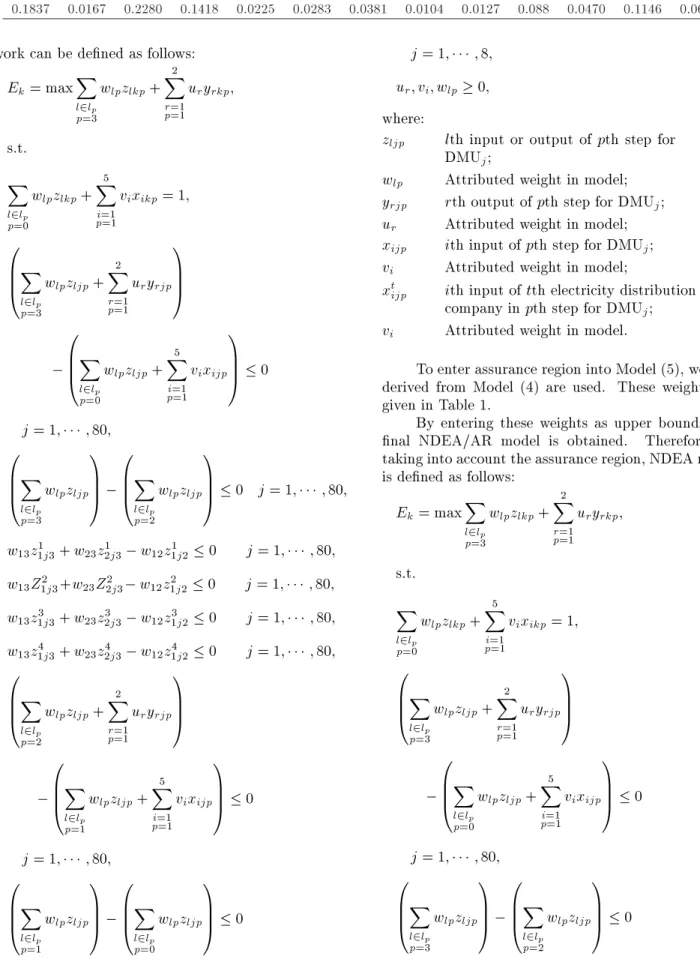
work can be dened as follows: Ek= max
X
l2lp
p=3
wlpzlkp+ 2
X
r=1 p=1
uryrkp;
s.t. X
l2lp
p=0
wlpzlkp+ 5
X
i=1 p=1
vixikp= 1;
0 B B @ X l2lp p=3
wlpzljp+ 2
X
r=1 p=1
uryrjp
1 C C A 0 B B @ X l2lp p=0
wlpzljp+ 5
X
i=1 p=1
vixijp
1 C C A 0 j = 1; ; 80;
0 B B @ X l2lp p=3
wlpzljp
1 C C A 0 B B @ X l2lp p=2
wlpzljp
1 C C
A 0 j = 1; ; 80; w13z1j31 + w23z12j3 w12z11j2 0 j = 1; ; 80;
w13Z1j32 +w23Z2j32 w12z21j2 0 j = 1; ; 80;
w13z1j33 + w23z32j3 w12z31j2 0 j = 1; ; 80;
w13z1j34 + w23z42j3 w12z41j2 0 j = 1; ; 80;
0 B B @ X l2lp p=2
wlpzljp+ 2
X
r=1 p=1
uryrjp
1 C C A 0 B B @ X l2lp p=1
wlpzljp+ 5
X
i=1 p=1
vixijp
1 C C A 0 j = 1; ; 80;
0 B B @ X l2lp p=1
wlpzljp
1 C C A 0 B B @ X l2lp p=0
wlpzljp
1 C C A 0
j = 1; ; 8;
ur; vi; wlp 0; (5)
where:
zljp lth input or output of pth step for
DMUj;
wlp Attributed weight in model;
yrjp rth output of pth step for DMUj;
ur Attributed weight in model;
xijp ith input of pth step for DMUj;
vi Attributed weight in model;
xt
ijp ith input of tth electricity distribution
company in pth step for DMUj;
vi Attributed weight in model.
To enter assurance region into Model (5), weights derived from Model (4) are used. These weights are given in Table 1.
By entering these weights as upper bounds, the nal NDEA/AR model is obtained. Therefore, by taking into account the assurance region, NDEA model is dened as follows:
Ek= max
X
l2lp
p=3
wlpzlkp+ 2
X
r=1 p=1
uryrkp;
s.t. X
l2lp
p=0
wlpzlkp+ 5
X
i=1 p=1
vixikp= 1;
0 B B @ X l2lp p=3
wlpzljp+ 2
X
r=1 p=1
uryrjp
1 C C A 0 B B @ X l2lp p=0
wlpzljp+ 5
X
i=1 p=1
vixijp
1 C C A 0 j = 1; ; 80;
0 B B @ X l2lp p=3
wlpzljp
1 C C A 0 B B @ X l2lp p=2
wlpzljp
1 C C A 0
j = 1; ; 80;
w13z1j31 + w23z2j31 w12z11j2 0 j = 1; ; 80;
w13Z1j32 +w23Z2j32 w12z21j2 0 j = 1; ; 80;
w13z1j33 + w23z2j33 w12z31j2 0 j = 1; ; 80;
w13z1j34 + w23z2j34 w12z41j2 0 j = 1; ; 80;
0 B B @ X l2lp p=2
wlpzljp+ 2
X
r=1 p=1
uryrjp
1 C C A 0 B B @ X l2lp p=1
wlpzljp+ 5
X
i=1 p=1
vixijp
1 C C A 0 j = 1; ; 80;
0 B B @ X l2lp p=1
wlpzljp
1 C C A 0 B B @ X l2lp p=0
wlpzljp
1 C C A 0 j = 1; ; 80;
0 u1 weight y1; 0 u2 weight y2;
0 v1 weight x1; 0 v2 weight x2;
0 v3 weight x3; 0 v4 weight x4;
0 v5 weight x5; 0 w10 weight w10;
0 w20 weight w20; 0 w11 weight w11;
0 w12 weight w12; 0 w13 weight w13;
0 w23 weight w23: (6)
Let u
r, vi and wlp be the optimal multipliers obtained
from running Model (6). Subsequently, the eciency of each unit and subunit for DMUj can be dened as below:
EDistribution (1)= w13z11j3+ w23z2j31
w
12z11j2;
j = 1; ; 80;
EDistribution (2)= w13Z1j32 + w23Z2j32
w
12z1j22 ;
j = 1; ; 80;
EDistribution (3)= w13z31j3+ w23z2j33
w
12z1j23 ;
j = 1; ; 80;
EDistribution (4)= w13z41j3+ w23z2j34
w
12z1j24 ;
j = 1; ; 80;
Etransmition=
0 B B @ X l2lp p=2 w lpzljp+
2
X
r=1 p=1
u ryrjp
1 C C A ,0 B B @ X l2lp p=1 w lpzljp+
5
X
i=1 p=1
v ixijp
1 C C A ; j = 1; ; 80;
Egeneration=
0 B B @ X l2lp p=1 w lpzljp
1 C C A ,0 B B @ X l2lp p=0 w lpzljp
1 C C A ;
j = 1; ; 80: (7)
5. Optimization
The optimization process presented in this article is based on the values of slack and surplus variables for indexes. As NDEA models are linear programing, they can be used to ascertain the indexes of units that should increase or decrease according to their reference sets. The inecient units can be ecient similar to the units in their reference set, if they can produce the target values of output using the target level of inputs. The target pointsx^
oand ^
y
oare calculated using the following
equation [34]: (xio; yro) !
^
x
io= oxio si ; ^
y
io= yio+ s + r
: (8)
ois the eciency score of DMUo that can be obtained
from dual or primary model. Input slacks (si ) indicate needed reductions in related inputs, and output slacks (s+
i ) represent needed increase in related outputs.
The dierence between the actual values and target values of inputs (xio io^x) shows the reduction, while
the dierence between the target values and observed values of outputs (yio ^y
io) represents the amount of
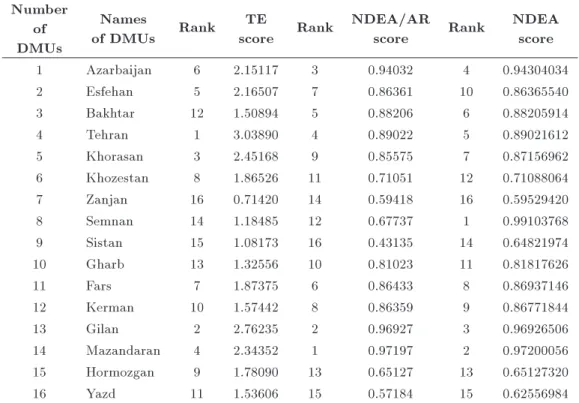
Table 2. Obtained results from all three models. Number
of DMUs
Names
of DMUs Rank
TE
score Rank
NDEA/AR
score Rank
NDEA score
1 Azarbaijan 6 2.15117 3 0.94032 4 0.94304034
2 Esfehan 5 2.16507 7 0.86361 10 0.86365540
3 Bakhtar 12 1.50894 5 0.88206 6 0.88205914
4 Tehran 1 3.03890 4 0.89022 5 0.89021612
5 Khorasan 3 2.45168 9 0.85575 7 0.87156962
6 Khozestan 8 1.86526 11 0.71051 12 0.71088064
7 Zanjan 16 0.71420 14 0.59418 16 0.59529420
8 Semnan 14 1.18485 12 0.67737 1 0.99103768
9 Sistan 15 1.08173 16 0.43135 14 0.64821974
10 Gharb 13 1.32556 10 0.81023 11 0.81817626
11 Fars 7 1.87375 6 0.86433 8 0.86937146
12 Kerman 10 1.57442 8 0.86359 9 0.86771844
13 Gilan 2 2.76235 2 0.96927 3 0.96926506
14 Mazandaran 4 2.34352 1 0.97197 2 0.97200056
15 Hormozgan 9 1.78090 13 0.65127 13 0.65127320
16 Yazd 11 1.53606 15 0.57184 15 0.62556984
6. Results and discussion
Results of the three models using Lingo software are shown in Table 2.
According to NDEA principles, a system is e-cient if only all its subsystems are ee-cient. As a result, in such a wide network, obtaining eciency with the score of 1 is extremely unlikely. In general, it can be said that this is a frequent event in NDEA application. Thus, the criterion for judging the eectiveness of DMUs is higher scores of eciency. The rst column of Table 2 shows the number of DMUs, the second is the names of DMUs, columns 3, 5, and 7 indicate ranks of units based on three proposed models. Columns 4, 6, and 8 are eciency scores of DMUs. In this study, the basis for ranking is the results of NDEA/AR model. Two other methods were used for comparison and validation. Results of the fth column of Table 2 demonstrate that DMU13 and DMU14 in NDEA/AR method are the most ecient units. These units, too, achieved high eciency scores in two other methods. In addition, according to these results, DMU9 and DMU16 are the most inecient units while having lower eciencies in other methods.
To verify the results of three models, non-parametric Spearman correlation test (rs) and
Kendall's Tau correlation test () were employed in SPSS Software. Table 3 reports rs between rankings
of the models, which resulted in the rejection of H0 at 0.01 level. Moreover, Kendall's Tau test conrmed this nding at the same level of signicance.
Table 3. Correlation between models. NDEA/AR
& NDEA
NDEA & TE
NDEA/AR & TE
Kendal's Tau 0.7 0.42 0.55
Spearman 0.77 0.52 0.74
According to Table 3, it can be clearly seen that the correlation rate between NDEA/AR and TE is higher than that between NDEA and TE. Furthermore, according to NDEA results (i.e. eighth column in Table 2), DMU8, DMU14 and DMU13 ranked rst, second, and third, respectively, however according to NDEA/AR (i.e. seventh column), DMU14 and DMU13 ranked rst and second, respectively, and DMU8 ranked 12th which indicates that DMU8 has performed poorly in the indexes important to the experts. The most important index in terms of expertise was generating energy (z1j1) and DMU8
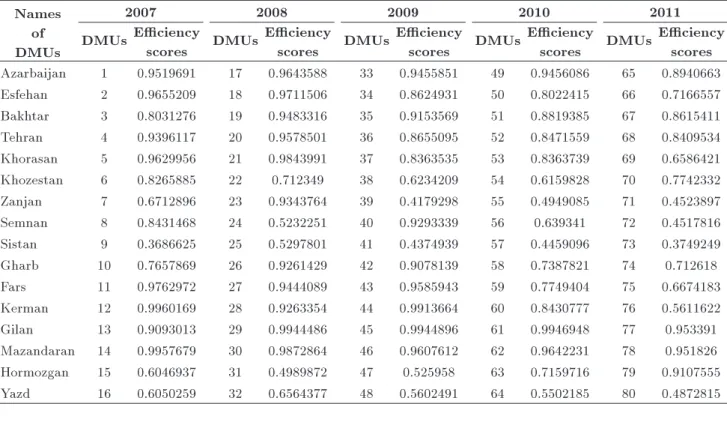
was found very weak according to this index. These outcomes, besides the higher correlation rate, indicate that using assurance region in NDEA methods led to achieving better and more realistic results. In other words, the NDEA/AR model was eective according to the experts' viewpoints. To analyze the increasing and decreasing trends of eciency for regional electricity companies, calculated eciencies from NDEA/AR in the last ve years are given in Table 4.
Table 4 shows that Kerman Regional Electric Company (DMU12) and Gillan (DMU13) had the top
Table 4. Eciency score of NDEA/AR model. Names
of DMUs
2007 2008 2009 2010 2011
DMUs Eciency
scores DMUs Eciencyscores DMUs Eciencyscores DMUs Eciencyscores DMUs Eciencyscores Azarbaijan 1 0.9519691 17 0.9643588 33 0.9455851 49 0.9456086 65 0.8940663 Esfehan 2 0.9655209 18 0.9711506 34 0.8624931 50 0.8022415 66 0.7166557 Bakhtar 3 0.8031276 19 0.9483316 35 0.9153569 51 0.8819385 67 0.8615411 Tehran 4 0.9396117 20 0.9578501 36 0.8655095 52 0.8471559 68 0.8409534 Khorasan 5 0.9629956 21 0.9843991 37 0.8363535 53 0.8363739 69 0.6586421 Khozestan 6 0.8265885 22 0.712349 38 0.6234209 54 0.6159828 70 0.7742332 Zanjan 7 0.6712896 23 0.9343764 39 0.4179298 55 0.4949085 71 0.4523897 Semnan 8 0.8431468 24 0.5232251 40 0.9293339 56 0.639341 72 0.4517816 Sistan 9 0.3686625 25 0.5297801 41 0.4374939 57 0.4459096 73 0.3749249 Gharb 10 0.7657869 26 0.9261429 42 0.9078139 58 0.7387821 74 0.712618 Fars 11 0.9762972 27 0.9444089 43 0.9585943 59 0.7749404 75 0.6674183 Kerman 12 0.9960169 28 0.9263354 44 0.9913664 60 0.8430777 76 0.5611622 Gilan 13 0.9093013 29 0.9944486 45 0.9944896 61 0.9946948 77 0.953391 Mazandaran 14 0.9957679 30 0.9872864 46 0.9607612 62 0.9642231 78 0.951826 Hormozgan 15 0.6046937 31 0.4989872 47 0.525958 63 0.7159716 79 0.9107555 Yazd 16 0.6050259 32 0.6564377 48 0.5602491 64 0.5502185 80 0.4872815
Figure 2. Eciency comparison between four best DMUs.
performances in 2007 and during 2008-2011, respec-tively. For further analysis, eciencies of the rst four highly ranked regional electricity companies (DMU14, DMU13, DMU1, and DMU4) using NDEA/AR are shown in Figure 2.
According to Figure 2, during 2007 to 2011, performance of Mazandaran and Gilan companies (DMU14 and DMU13) are almost one. During ve years, Mazandaran Regional Electric Company has had less variation and could get the best ranks. Moreover, it is clear from Table 4 that performance of Mazandaran Company in 2007 had the highest value (0.9957679);
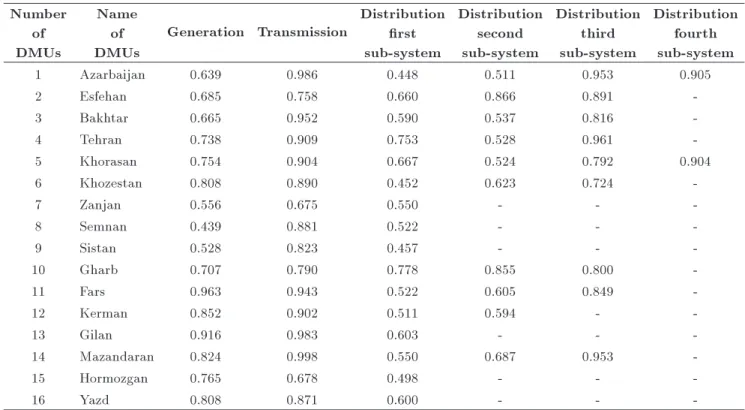
however, its eciency has been reduced over time. According to Figure 2, DMU13 from 2008 to 2011 had fewer variations in terms of eciency score. However, in 2007, it had the lowest eciency score (0.9093013), which is the main reason for its decline in the overall eciency scores. Nevertheless, its performance has improved since 2007, and it has been the best DMU in the recent years. Table 5 shows eciency values calculated for subsystems of energy supply chain using Models (7) for 5 years. The second column of the table demonstrates regional electricity companies, the third column is the eciency of generation section, the fourth column is the eciency of transmission, and the fth to eighth columns indicate eciency of distribution subsystems. In this table, mark \-" implies absence of subsystems for that particular DMU; for example, Azerbaijan and Khorasan had four distribution companies, while Zanjan, Semnan, Sistan, Gilan, Yazd, and Hormozgan had only one distribution subsystem.
The third column of Table 5 shows that, in generation sector, Fars (DMU11), Gilan (DMU13), and Mazandaran (DMU14) are the most ecient units, whereas Semnan company is an inecient DMU in generating energy. According to the fourth column, Mazandaran (DMU14), Azerbaijan (DMU1), and Gi-lan (DMU13) are the most ecient companies in transmitting energy, while Zanjan (DMU7) stands in the opposite point. Results from the fourth to eighth columns of distribution section show that the third subsystem of distribution section (i.e. Mazandaran
Table 5. Eciency of the sub-system. Number
of DMUs
Name of DMUs
Generation Transmission
Distribution rst sub-system
Distribution second sub-system
Distribution third sub-system
Distribution fourth sub-system
1 Azarbaijan 0.639 0.986 0.448 0.511 0.953 0.905
2 Esfehan 0.685 0.758 0.660 0.866 0.891
-3 Bakhtar 0.665 0.952 0.590 0.537 0.816
-4 Tehran 0.738 0.909 0.753 0.528 0.961
-5 Khorasan 0.754 0.904 0.667 0.524 0.792 0.904
6 Khozestan 0.808 0.890 0.452 0.623 0.724
-7 Zanjan 0.556 0.675 0.550 - -
-8 Semnan 0.439 0.881 0.522 - -
-9 Sistan 0.528 0.823 0.457 - -
-10 Gharb 0.707 0.790 0.778 0.855 0.800
-11 Fars 0.963 0.943 0.522 0.605 0.849
-12 Kerman 0.852 0.902 0.511 0.594 -
-13 Gilan 0.916 0.983 0.603 - -
-14 Mazandaran 0.824 0.998 0.550 0.687 0.953
-15 Hormozgan 0.765 0.678 0.498 - -
-16 Yazd 0.808 0.871 0.600 - -
-(DMU14) and Azerbaijan (DMU1) with the values of 0.953) are the most ecient subsystems in this section. According to the results of the overall eciencies and subsystems eciencies for this supply chain, Mazan-daran, Gilan, and Azerbaijan Companies were superior in terms of performance.
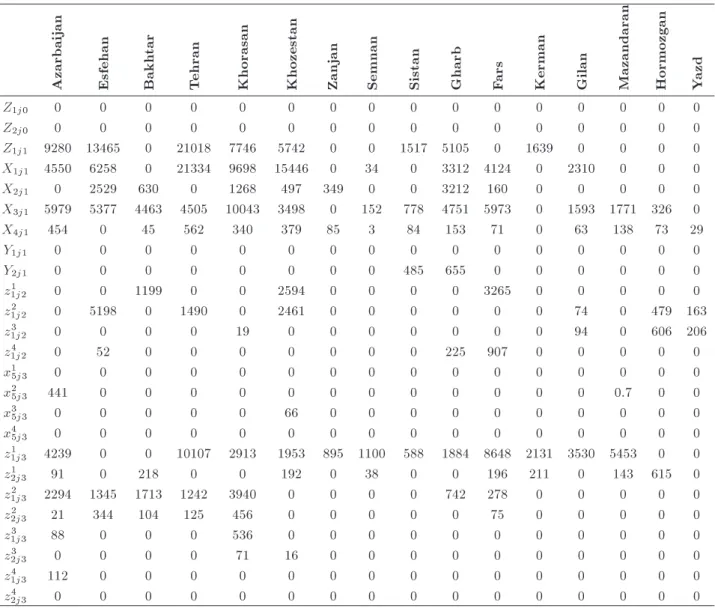
For optimization, ineciency sources have to be identied according to these results. Next, their per-formance should be improved properly by authorities using the slack and surplus values of units which have been shown in Table 6 for 2011. For other years, the process is the same; however, to prevent extensive amounts of data, only the latest year's values have been presented.
These results also were obtained by Lingo Soft-ware according to Eq. (8). As can be seen in Table 6, even for most ecient units, increasing outputs and/or decreasing inputs according to s+ and s values should be taken into account since these units are not quite ecient. For instance, the results for Mazandaran (DMU14) show that, for optimizing, this unit needs to decrease the x3j1 (imported energy from neighboring
power companies) and x4j1 (labor of transmission
section) to 1771 and 138, respectively. In addition, it is required to increase the z1
1j3 (total sold energy
of the rst distribution company) and z1
2j3 (number
of customers of the rst distribution company) to 5453 and 143, respectively. However, for x2
5j3, the calculated
value is not signicant, and this index does not need any essential change. For intermediate indexes like z1j1
(generated energy), which is, simultaneously, output
for generation section and input for transmission sec-tion, the calculated slack or surplus values should be considered in one of the sections. For example, the value of this index for Azerbaijan (DMU1) is 9280, which means 9280 units increase in generation section as an output or 9280 units decrease in transmission section as an input.
7. Conclusion
Many methods have been proposed for evaluating performance of supply chain subsystems. However, in practice, the subsystems of each system are correlated and have interactions with each other throughout the system. Therefore, for performance assessment, the utilized methods must be able to model these interactions all together at the same time. Evaluat-ing performance of the whole supply chain includEvaluat-ing its subsystems and interactions between them as an integrated system will be possible by using NDEA models. This research provided a comprehensive NDEA/AR model to evaluate energy supply chain including subsystems of generation, transmission and distribution in which experts' viewpoints have ideal eects on the results. In other words, results have been calculated by combining experts' opinions and NDEA/AR method, and thus, are more scientic and reliable. In this regard, not only experts' intelligence are properly utilized, but also entering these direc-tions to the model, as assurance region, enhances the discriminative power of NDEA model and prevents
Table 6. The slacks and surpluses values for the NDEA/AR in 2011.
Azarbaijan Esfehan Bakh
tar
T
ehran
Khorasan Khozestan Zanjan Semnan Sistan Gharb Fars Kerman Gilan Mazandaran Hormozgan Yazd
Z1j0 0 0 0 0 0 0 0 0 0 0 0 0 0 0 0 0
Z2j0 0 0 0 0 0 0 0 0 0 0 0 0 0 0 0 0
Z1j1 9280 13465 0 21018 7746 5742 0 0 1517 5105 0 1639 0 0 0 0
X1j1 4550 6258 0 21334 9698 15446 0 34 0 3312 4124 0 2310 0 0 0
X2j1 0 2529 630 0 1268 497 349 0 0 3212 160 0 0 0 0 0
X3j1 5979 5377 4463 4505 10043 3498 0 152 778 4751 5973 0 1593 1771 326 0
X4j1 454 0 45 562 340 379 85 3 84 153 71 0 63 138 73 29
Y1j1 0 0 0 0 0 0 0 0 0 0 0 0 0 0 0 0
Y2j1 0 0 0 0 0 0 0 0 485 655 0 0 0 0 0 0
z1
1j2 0 0 1199 0 0 2594 0 0 0 0 3265 0 0 0 0 0
z2
1j2 0 5198 0 1490 0 2461 0 0 0 0 0 0 74 0 479 163
z3
1j2 0 0 0 0 19 0 0 0 0 0 0 0 94 0 606 206
z4
1j2 0 52 0 0 0 0 0 0 0 225 907 0 0 0 0 0
x1
5j3 0 0 0 0 0 0 0 0 0 0 0 0 0 0 0 0
x2
5j3 441 0 0 0 0 0 0 0 0 0 0 0 0 0.7 0 0
x3
5j3 0 0 0 0 0 66 0 0 0 0 0 0 0 0 0 0
x4
5j3 0 0 0 0 0 0 0 0 0 0 0 0 0 0 0 0
z1
1j3 4239 0 0 10107 2913 1953 895 1100 588 1884 8648 2131 3530 5453 0 0
z1
2j3 91 0 218 0 0 192 0 38 0 0 196 211 0 143 615 0
z2
1j3 2294 1345 1713 1242 3940 0 0 0 0 742 278 0 0 0 0 0
z2
2j3 21 344 104 125 456 0 0 0 0 0 75 0 0 0 0 0
z3
1j3 88 0 0 0 536 0 0 0 0 0 0 0 0 0 0 0
z3
2j3 0 0 0 0 71 16 0 0 0 0 0 0 0 0 0 0
z4
1j3 112 0 0 0 0 0 0 0 0 0 0 0 0 0 0 0
z4
2j3 0 0 0 0 0 0 0 0 0 0 0 0 0 0 0 0
ignoring some indexes' roles in calculating eciency score. Another important capability of the proposed model was that it calculated eciency of the whole system and subsystems simultaneously. Calculated scores for subsystems' eciencies will identify ine-cient units. Subsequently, optimization measurements can be done within these subsystems by analyzing slack and surplus values. Finally, if these actions were done systematically for all of the inecient units, an ecient supply chain will be achievable. Reaching such results is the goal of all sectors, and this model has the ability to produce a brief and monolithic data for authorities to detect and optimize weaknesses in the supply chain. Furthermore, according to the dierences in available resources, geographical conditions and current policies between countries, weights of index may not be the same for all regions. However, they can be dened based on decision-makers' preferences. Owing to exibility of NDEA, the presented model is highly adaptable and can be implemented for every
supply chain. Considering these issues, it seems fair to suggest that the presented model can be used as a framework for evaluating supply chain in each system regardless of its size and location; however, it is more eective in policy and decision making in bigger scales. Acknowledgement
The authors are cordially grateful for the anonymous reviewers, as this paper could not have reached this quality without their constructive comments and useful remarks.
References
1. Panjeshahi, M.H.P., Harati, F. and Nouzari, M.M. \Improving energy eciency in natural gas reneries, using energy analysis", Chem. Eng. Trans., 21, pp. 121-126 (2010).
con-sumption on economic growth in industrialized G8 countries", Int. J. Acad. Res. Bus. Soc. Sci., 4(5), pp. 355-369 (2014).
3. Zhou, P., Ang, B.W. and Zhou, D.Q. \Measuring economy-wide energy eciency performance: A para-metric frontier approach", Appl. Energy, 90(1), pp. 196-200 (2012).
4. Hu, J.-L., Lio, M.-C., Yeh, F.-Y. and Lin, C.-H. \Environment-adjusted regional energy eciency in Taiwan", Appl. Energy, 88(8), pp. 2893-2899 (2011). 5. Wang, Z.-H., Zeng, H.-L., Wei, Y.-M. and Zhang,
Y.-X. \Regional total factor energy eciency: An empirical analysis of industrial sector in China", Appl. Energy, 97(0), pp. 115-123 (2012).
6. Yadav, V.K., Padhy, N.P. and Gupta, H.O. \A micro level study of an Indian electric utility for eciency enhancement", Energy, 35(10), pp. 4053-4063 (2010). 7. See, K.F. and Coelli, T. \An analysis of factors that inuence the technical eciency of Malaysian thermal power plants", Energy Econ., 34(3), pp. 677-685 (2012).
8. Alizadeh, R., Majidpour, M., Maknoon, R. and Shaei Kaleibari, S. \Clean development mechanism in Iran: Does it need a revival?", Int. J. Global Warm. (In Press).
9. Jarait_e, J. and Di Maria, C. \Eciency, productivity and environmental policy: A case study of power generation in the EU", Energy Econ., 34(5), pp. 1557-1568 (2012).
10. Solmes, L. Real Time Energy Infrastructure Invest-ment and Risk ManageInvest-ment. Energy Ecien, L. Solmes, Springer Netherlands, pp. 1-212 (2009). 11. Omrani, H., Gharizadeh Beiragh, R. and Shaei
Kaleibari, S. \Performance assessment of Iranian elec-tricity distribution companies by an integrated co-operative game data envelopment analysis principal component analysis approach", Int. J. Elect. Power Energy Syst., 64(0), pp. 617-625 (2015).
12. Fallahi, A., Ebrahimi, R. and Ghaderi, S.F. \Mea-suring eciency and productivity change in power electric generation management companies by using data envelopment analysis: A case study", Energy, 36(11), pp. 6398-6405 (2011).
13. Vazhayil, J.P. and Balasubramanian, R. \Optimiza-tion of India's power sector strategies using weight-restricted stochastic data envelopment analysis", En-ergy Policy, 56(0), pp. 456-465 (2013).
14. Pardo Martnez, C. \Energy eciency development in German and Colombian non-energy-intensive sectors: a non-parametric analysis", Energy Ecien., 4(1), pp. 115-131 (2011).
15. Liang, Q.-M., Fan, Y. and Wei, Y.-M. \The eect of energy end-use eciency improvement on China's energy use and CO2 emissions: a CGE model-based
analysis", Energy Ecien., 2(3), pp. 243-262 (2009).
16. Bas, E. \The integrated framework for analysis of electricity supply chain using an integrated SWOT-fuzzy TOPSIS methodology combined with AHP: The case of Turkey", Int. J. Elect. Power Energy Syst., 44(1), pp. 897-907 (2013).
17. Huang, Y.-J., Chen, K.-H. and Yang, C.-H. \Cost eciency and optimal scale of electricity distribution rms in Taiwan: An application of metafrontier anal-ysis", Energy Econ., 32(1), pp. 15-23 (2010).
18. Charnes, A., Cooper, W.W. and Rhodes, E. \Measur-ing the eciency of decision mak\Measur-ing units", Eur. J. Oper. Res., 2(6), pp. 429-444 (1978).
19. Fare, R. and Grosskopf, S. \Network DEA", Socio. Econ. Plan. Sci., 34(1), pp. 35-49 (2000).
20. Castelli, L., Pesenti, R. and Ukovich, W. \DEA-like models for eciency evaluations of specialized and interdependent units", Eur. J. Oper. Res., 132(2), pp. 274-286 (2001).
21. Lewis, H.F. and Sexton, T.R. \Network DEA: e-ciency analysis of organizations with complex internal structure", Comput. Oper. Res., 31(9), pp. 1365-1410 (2004).
22. Prieto, A.M. and Zofo, J.L. \Network DEA eciency in input-output models: With an application to OECD countries", Eur. J. Oper. Res., 178(1), pp. 292-304 (2007).
23. Bai-Chen, X., Ying, F. and Qian-Qian, Q. \Does generation form inuence environmental eciency per-formance? An analysis of China's power system", Appl. Energy, 96(0), pp. 261-271 (2012).
24. Chen, C. and Yan, H. \Network DEA model for supply chain performance evaluation", Eur. J. Oper. Res., 213(1), pp. 147-155 (2011).
25. Kao, C. \Eciency decomposition in network data envelopment analysis: A relational model", Eur. J. Oper. Res., 192(3), pp. 949-962 (2009).
26. Kao, C. and Hwang, S.-N. \Eciency measurement for network systems: IT impact on rm performance", Decis. Support Syst., 48(3), pp. 437-446 (2010). 27. Tone, K. and Tsutsui, M. \Network DEA: A
slacks-based measure approach", Eur. J. Oper. Res., 197(1), pp. 243-252 (2009).
28. Hsieh, L.-F. and Lin, L.-H. \A performance evaluation model for international tourist hotels in Taiwan-An application of the relational network DEA", Int. J. Hosp. Manag., 29(1), pp. 14-24 (2010).
29. Matthews, K. \Risk management and managerial e-ciency in Chinese banks: A network DEA framework", Omega, 41(2), pp. 207-215 (2013).
30. Zhao, Y., Triantis, K., Murray-Tuite, P. and Edara, P. \Performance measurement of a transportation network with a downtown space reservation system: A network-DEA approach", Transp. Res. Part E: Logist. Transp. Rev., 47(6), pp. 1140-1159 (2011).
31. Wang, Y.-M., Chin, K.-S. and Poon, G.K.K. \A data envelopment analysis method with assurance region for weight generation in the analytic hierarchy process", Decis. Support Syst., 45(4), pp. 913-921 (2008). 32. Wang, Y.-M. and Chin, K.-S. \A new data
envel-opment analysis method for priority determination and group decision making in the analytic hierarchy process", Eur. J. Oper. Res., 195(1), pp. 239-250 (2009).
33. Cooper, W.W., Seiford, L.M. and Tone, K., A Compre-hensive Text with Models, Applications, References and DEA-Solver Software. Data Envelopment Analysis, Springer US: 1-490 (2007).
34. Azadeh, A., Ghaderi, S.F., Omrani, H. and Eivazy, H. \An integrated DEA-COLS-SFA algorithm for op-timization and policy making of electricity distribution units", Energy Policy, 37(7), pp. 2605-2618 (2009).
Biographies
Saeed Shaei Kaleibari received his BSc degree in Industrial Engineering from Payam Noor Univer-sity of Tabriz, Iran. His research interests include supply chain management and logistics, optimization methods, eciency and productivity analysis (DEA, SFA, etc.), decision support systems, multiple criteria decision making, game theory, simulation, renewable energies and climate policy. He has also several publications in international journals.
Ramin Gharizadeh Beiragh received his BSc and MSc degrees in Industrial Engineering from Payam Noor University of Tabriz, Iran, and from Urmia
University of Technology, Urmia, Iran respectively. His research interests are multiple criteria decision mak-ing, dame theory, eciency and productivity analysis (DEA, SFA, etc.), production planning, and control. He has several publications in international journals. Reza Alizadeh received his BSc degree in Industrial Engineering from Urmia University of Technology, Urmia, Iran, and holds a Master degree in Technology Foresight from Amirkabir University of Technology (AUT), Tehran, Iran. He has been honored through receipt of the distinguished Master's Thesis Award of AUT in 2014. He is a researcher at Future Studies Research Institute of AUT and Sustainability Oce of AUT. Also, he is a member of Iranian National Elite Foundation. His research interests include energy and climate policy, strategic management, technology pol-icy and foresight, decision-making, and sustainability. He has more than ten papers in international journals and conferences.
Maghsud Solimanpur is a Professor of Industrial Engineering in the Faculty of Engineering at Urmia University, Urmia, Iran. He received his BSc and MSc degrees from Sharif University of Technology in 1994 and 1997, respectively. Subsequently, he received his PhD from the Indian Institute of Technology Delhi, New Delhi, India, in 2003. His research interests are design of cellular manufacturing systems, facilities planning and layout, optimization of manufacturing processes, meta-heuristics, etc. He has published more than 100 papers in dierent journals of repute and conferences.