Viscous Sheet Retraction
The MIT Faculty has made this article openly available.
Please share
how this access benefits you. Your story matters.
Citation
NIKOS SAVVA and JOHN W. M. BUSH (2009). Viscous sheet
retraction. Journal of Fluid Mechanics, 626 , pp 211-240 doi:10.1017/
S0022112009005795
As Published
http://dx.doi.org/10.1017/s0022112009005795
Publisher
Cambridge University Press
Version
Final published version
Citable link
http://hdl.handle.net/1721.1/58206
Terms of Use
Article is made available in accordance with the publisher's
policy and may be subject to US copyright law. Please refer to the
publisher's site for terms of use.
doi:10.1017/S0022112009005795 Printed in the United Kingdom
Viscous sheet retraction
N I K O S S A V V A†A N D J O H N W. M. B U S H‡
Department of Mathematics, Massachusetts Institute of Technology, Cambridge, MA 02139, USA
(Received11 December 2007 and in revised form 19 November 2008)
We present the results of a combined theoretical and numerical investigation of the rim-driven retraction of flat fluid sheets in both planar and circular geometries. Particular attention is given to the influence of the fluid viscosity on the evolution of the sheet and its bounding rim. In both geometries, after a transient that depends on the sheet viscosity and geometry, the film edge eventually attains the Taylor– Culick speed predicted on the basis of inviscid theory. The emergence of this result in the viscous limit is rationalized by consideration of both momentum and energy arguments. We first consider the planar geometry considered by Brenner & Gueyffier (Phys. Fluids, vol. 11, 1999, p. 737) and deduce new analytical expressions for the speed of the film edge at the onset of rupture and the evolution of the maximum film thickness for viscous films. In order to consider the expansion of a circular hole, we develop an appropriate lubrication model that predicts the form of the early stage dynamics of film rupture. Simulations of a broad range of flow parameters confirm the importance of geometry on the dynamics, verifying the exponential hole growth reported in early experimental studies. We demonstrate the sensitivity of the initial retraction speed on the film profile, and so suggest that the anomalous rate of retraction reported in these experiments may be attributed in part to geometric details of the puncture process.
1. Introduction
Sheet retraction arises in a wide range of physical settings, ranging from fuel injectors to foams in the food industry to biological membranes (for an overview see de Gennes, Brochart-Wyart & Qu´er´e 2003). The disintegration of fluid sheets is of primary importance in the context of fluid fragmentation or atomization (Lefebvre 1989; Bayvel & Orzechowski 1993; Villermaux 2007). Commonly, such atomization processes involve a cascade from fluid volumes to sheets to filaments to droplets, a route that depends critically on the dynamics and stability of fluid sheets and their bounding rims. Depending on the application at hand, film rupture can be either desirable, as in spray formation (e.g. Pomeau & Villermaux 2006), or undesirable, as in curtain coating (e.g. Miyamoto & Katagiri 1997).
The initial observations of soap film rupture were reported by Dupr´e (1867) and Rayleigh (1891). Their studies motivated the experimental work of Ranz (1950), who observed that, following puncture, the film recedes under the influence of surface tension at a constant speed, and that fluid accumulates in a roughly circular rim as
†Present address: Department of Chemical Engineering, Imperial College London, London SW7 2AZ, UK.
2 cm
Figure 1. The bursting of a soap film. Times are indicated in each frame. The sequence lasts
approximately 7.6 ms.
it is drawn away from the point of puncture (see figure 1). Dupr´e (1867) incorrectly deduced the retraction speed of the film, based on the erroneous assumption that the surface energy lost due to retraction is converted purely into kinetic energy
U =
4γ ρH =
√
2uc, (1.1)
where ρ, γ , H correspond to the density, surface tension and thickness of the film, respectively. Taylor (1959) and Culick (1960) independently corrected Dupr´e’s calculation using an argument based on the conservation of momentum of the film and found that the retraction speeduc was a factor of
√
2 less than that predicted by Dupr´e, as will be reviewed in §2.1.
McEntee & Mysels (1969) confirmed experimentally the Culick–Taylor theory for soap films of thickness greater than 0.1μm. Keller (1983) extended the previous work of Taylor (1959) and Culick (1960) by considering sheets of non-uniform thickness and Keller & Miksis (1983) considered time-dependent inviscid potential flows in which a wedge-shaped initial free surface profile admits self-similar solutions. In§2.1 we shall demonstrate whyuc is achieved even in the viscous limit, where there is fluid
motion upstream of the tip.
While the bulk of experiments on retracting fluid sheets have been conducted with water sheets or soap films in air, Debr´egeas, Martin & Brochard-Wyart (1995) and Debr´egeas, de Gennes & Brochard-Wyart (1998) presented a series of experiments using films with viscosity of the order of one million times that of water. They used polymer polydimethylsiloxane (PDMS) films obtained by dipping a ring into an isopentane solution of the polymer. After lifting the ring from the solution, the solvent evaporated, leaving behind a suspended film of pure PDMS with thickness of the order of 10–50μm, much thicker than a typical soap film (of characteristic thickness
∼1μm). Accurate measurements of the retraction process revealed behaviour that was markedly different from that predicted by inviscid theory. In particular, they found that the fluid no longer collects in a rim as it retracts. Moreover, the rim does
not retract at a constant speed; rather, the hole radius grows exponentially as
r0exp(t) =R0exp
t
1.4τ
, (1.2)
where τ=μH /2γ , with R0 being the initial hole size and μ the film’s dynamic
viscosity. The exponential hole growth was also supported by a simple theoretical argument, in which surface energy released during retraction was equated to the energy dissipated through the action of viscosity, that predicted:
r0(t) =R0exp
t
2τ
. (1.3)
While Debr´egeas et al. (1995) did not consider viscoelastic effects in deriving (1.3), they did suggest that the exponential behaviour may be due in part to the viscoelasticity of the films. However, the typical shear rate of the PDMS films was below those at which non-Newtonian behaviour sets in (e.g. Deyrailet al.2007). In the subsequent experimental studies of Dalnoki-Veresset al.(1999) and Rothet al.(2005), film rupture was used as a means to measure the viscosity of molten polystyrene films with viscosities of the order of 1012 times that of water. Dalnoki-Veresset al. (1999)
probed the nonlinear viscoelastic regime, where it was found that the viscous time scale τ decreased markedly with decreasing film thickness. This effect was attributed to the reduction in film viscosity caused by the large shear strain rates caused by the hole expansion. Roth et al. (2005) found an initial transient regime where the expansion of the hole was faster than exponential; fitting to the data was achieved by introducing a time-dependent viscosity.
Following the work of Debr´egeas et al.(1995), Brenner & Gueyffier (1999) studied the retraction of a two-dimensional planar sheet numerically using a one-dimensional Trouton-type lubrication model. They were able to identify three distinct regimes depending on the Ohnesorge number, defined as
Oh= √ μ
2Hργ (1.4)
that expresses the relative importance of viscous resistance to surface tension forces (see figure 2). In the low Oh regime (Oh<0.1), they found that capillary wave disturbances are generated ahead of the retracting rim. As the Ohnesorge number is increased, the capillary waves disappear and the rim diffuses in towards the bulk of the sheet. Finally in the high Oh regime (Oh10), they found that no rim forms at all, in accord with Debr´egeas’ observations. In all cases considered, the sheet edge was found to approach the Culick–Taylor speed in the long time limit.
The retraction time scales are different in the high and low Oh regimes. Since numerical simulations indicate that the characteristic speed uc is independent of Oh,
the length scale prescribes the characteristic retraction time. Naturally, this length scale is a measure of the distance from the tip over which the film is disturbed, and depends on the relative importance of viscosity to surface tension, as quantified through Oh. In the low Oh regime, the motion is primarily concentrated near the tip, so that the characteristic length scale is prescribed by H. This implies that the characteristic time scale is
τinv = H uc
=
ρH3
2γ , (1.5)
which is of the order of microseconds for the soap films in the experiments of Ranz (1950). Conversely, in the viscous, high Oh limit, a larger portion of the film
Oh < 0.1
0.1 < Oh < 10
10 < Oh
Figure 2.Schematic illustration of the three distinct regimes obtained for a retracting sheet
by Brenner & Gueyffier (1999). As Oh progressively increases, the capillary waves and then the rim disappear through the action of viscosity.
is accelerated by the unbalanced surface tension force near the tip and the flow is characterized by a length scaleOhH equivalent to the Stokes lengthμ/ρucidentified
by Brenner & Gueyffier (1999). Hence the characteristic retraction time is given by
τvis = OhH
uc
= μH
2γ . (1.6)
This time was of the order of seconds for the PDMS films used in Debr´egeas et al.
(1995) and hours for the polystyrene films used in the experiments of Roth et al.
(2005).
Following the work of Brenner & Gueyffier (1999), two-dimensional simulations of planar sheet retraction were presented by Song & Tryggvason (1999), who took into account the effect of the ambient fluid. They found that even when the ratio of ambient to sheet viscosity isO(0.1), the influence of the ambient fluid is minor. Their results however were somewhat limited due to the short extent of the fluid sheet, and no conclusion could be drawn concerning the dynamics in the long time limit. More recently, S¨underhauf, Raszillier & Durst (2002) performed two-dimensional simulations of the Navier–Stokes equations, but neglected the ambient fluid on the basis of the prior work of Song & Tryggvason (1999). They focused primarily on exploring the acceleration phase of the film edge towards the terminal Taylor–Culick speed and provided some insights into the stability of falling liquid sheets. Critically, these previous works were not able to capture the exponential regime observed by Debr´egeas et al. (1995), a shortcoming that, as suggested by Brenner & Gueyffier (1999) and demonstrated here, can be attributed to the planar geometry considered.
We here elaborate on the retraction dynamics of flat sheets by building upon the work of Brenner & Gueyffier (1999); specifically, we clarify the effects of viscosity and geometry by solving the appropriate Trouton-type model for both planar and circular geometries. In §2, we further explore the model of Brenner & Gueyffier (1999) for planar sheets in order to obtain several new insights. In§2.1 we present the conservation laws and use them to clarify why (2.3) adequately describes flow with viscous dissipation, despite the fact that viscosity was neglected in its derivation. In
z
x h(∞, t) = H x0 (t)
h(x, t)
Figure 3.Planar sheet geometry. The sheet retracts from left to right under the influence of
the capillary force acting at its edge.
§2.2, we calculate an analytic expression for the hole growth during the early stages of retraction and the maximum film thickness in the highOh limit. In§3, we develop a new theoretical model that allows us to investigate the expansion of a circular hole for arbitrary Ohnesorge number. By examining the lubrication equations in the high Oh limit, we demonstrate that the exponential hole growth in the highOh limit can be deduced directly from the lubrication equations, thus providing an alternative derivation to the energy argument of Debr´egeas et al. (1995). Our model is solved numerically to elucidate the effects of viscosity, geometry and initial conditions. We conclude in §4 with a discussion of the potential importance of three-dimensional and other effects neglected in our model.
2. Planar sheets
We proceed by considering the model of Brenner & Gueyffier (1999) for the retraction of a planar semi-infinite viscous sheet under the influence of surface tension (figure 3). For a planar sheet of thickness h(x, t) moving under the influence of surface tension forces along thex-axis with speedu(x, t)
ut+uux =
4μ
ρh(hux)x+ γ
ρκx, (2.1a)
ht+ (hu)x = 0, (2.1b)
whereκ(x, t) corresponds to the curvature of the film profile,
κ= (1/2)hxx 1 + (1/4)h2
x
3/2. (2.2)
Experimental study of the retraction of a planar film is impractical owing to unavoidable edge effects and the difficulties inherent in producing a perfectly linear rupture. For films bound between two parallel wires, edge effects can become dominant and the retraction rate significantly reduced (Chepushtanova & Kliakhandler 2007). Nevertheless the planar geometry is governed by relatively simple equations that we show yield analytic solutions for the early expansion. Moreover, it yields physical insight that shall guide us in modelling the more experimentally feasible circular geometry.
uc = δl/δt
δm = ρHδl
H
δl
γ, ρ
Figure 4.Retraction of a planar film. In time δt, the tip of the film moves by a distance
δl=Ucδt.The mass of the fluid (per unit length) accumulated in the rim during that time is
δm=ρH δl.
2.1. Conservation laws
Taylor (1959) and Culick (1960) deduced the constant speed of retraction by assuming that the film preceding the rim is at rest and expressing the force balance on the rim as a balance between the rate of change of rim momentum Prim and the surface
tension force exerted on the rim dPrim
dt =uc
dm
dt = 2γ , (2.3)
whereuc is the constant rim speed andmthe rim mass per unit length (see figure 4).
The rate of change of the rim mass satisfies dm
dt =ρH uc. (2.4)
Henceforth, the constant speed
uc=
2γ
ρH (2.5)
found from (2.3) and (2.4) became known to be the Taylor–Culick speed.
To demonstrate that (2.3) arises at arbitrary viscosities, we consider a planar sheet of finite initial length L. At any instant, the edge of the sheet is located at x0(t).
Imposing the conditions
h(x0,0) =hx(L, t) =hxx(L, t) = 0, (2.6a)
u(L, t) =ux(L, t) = 0 and (2.6b)
h(L, t) =H, (2.6c)
we can deduce the conservation laws for the mass, momentum and energy. The total mass of the fluid (per unit length) is
m=ρ
L
x0
hdx. (2.7)
Mass conservation trivially follows from (2.1b) since dm
dt =ρ
L
x0
ht dx=−ρ hu| L
x0 = 0. (2.8)
More importantly, an expression for the total sheet momentum,
Ptot =ρ
L
x0
can be found by multiplying (2.1b) by u and (2.1a) byh and adding them together. Thus, we obtain the equation
(ρhu)t+
ρhu2−4μhux−γ hκ−2γ
1 +1 4h
2
x −1/2
x = 0. (2.10)
Integrating the first term fromx0 toLgives ρ
L
x0
(hu)t dx=
dPtot
dt +ρu(x0) 2
h(x0) =
dPtot
dt . (2.11)
Combining this with the integral of the second term fromx0 toL, evaluated by using
(2.6), yields
dPtot
dt = 2γ , (2.12)
under the assumption that hx → ∞ as x → x0. Hence, we find that even though
the dissipation due to viscosity is not directly described by Taylor’s and Culick’s momentum balance, its inclusion does not alter the veracity of their result. With this simple calculation, we see the role of viscosity in the dynamics of retraction: it affects how the momentum is distributed through the film, but does not affect its terminal speed uc. As also pointed out in the two-dimensional numerical calculations
of S¨underhauf et al. (2002), in the long time limit, half of the surface energy is converted to kinetic energy, while the other half is ultimately dissipated through the action of viscosity.
To obtain the corresponding energy equation, we multiply (2.1b) by u2 and (2.1a)
by hu and add them, which yields, after some algebra:
1 2ρhu
2+ 2γ 1 +1
4h
2
x
t
+
1 2ρhu
3−4μhuu
x−γ uhκ−
(1/2)γ hxht
1 + (1/4)h2
x 1/2
x
=−4μhu2x. (2.13)
Integration with respect tox and use of the boundary conditions (2.6) yields d
dt(Ek+Eγ) =D, (2.14)
where we identify
Ek=
1 2ρ
L
x0
hu2 dx, (2.15)
Eγ = 2γ
L
x0
1 +14h2
x dx, (2.16)
D=−4μ
L
x0
hu2x dx, (2.17)
as the total kinetic energy, surface energy and viscous dissipation of the sheet, respectively. This approach reveals why Dupr´e’s original argument of balancing surface energy lost and kinetic energy gained by the retracting film predicted an incorrect retraction speed. Culick (1960) argued against the prediction of Dupr´e (1867) on physical grounds, attributing the discrepancy to the energy lost while the undisturbed film accelerates to the constant Taylor–Culick speed. We now see that the momentum conservation equation yields the correct expression for uc, since the
viscous forces are internal to the film and so do not contribute to the momentum budget (2.12).
2.2. Early stages of retraction
We proceed by deducing a new analytic expression that describes the initiation of sheet retraction in the highOh limit. Non-dimensionalizing the equations by
t =τvist∗, x=OhH x∗, h=H h∗ andu=ucu∗,
we can write the momentum equation in non-dimensional form as
u∗t∗+u∗u∗x∗ =
4
h∗(h ∗u∗
x∗)x∗+
1 2Oh
−2
κx∗∗. (2.18)
If we assume that the fluid sheet consists of a nearly semi-circular cap followed by a straight edge, there occurs a singularity in the curvature at xs∗= (2Oh)−1, since at
t∗= 0 it satisfies
κ∗ =
−2Oh2 06x∗<(2Oh)−1
0 x∗>(2Oh)−1 . (2.19) Therefore, we can approximateκx∗∗ initially by a delta function
κx∗∗ = 2Oh
2
δ(x∗−xs∗). (2.20)
We further assume that during the initial stages of retraction, the film thickness remains uniform to leading order, xs∗ is small compared to the axial extent of the film, the delta-function structure of the curvature gradient κx∗∗ is preserved and
the fluid contained in the semi-circular cap moves at the tip speed. By neglecting the convective term, we thus reduce the problem to
ut = 4uxx+δ(x−xs), (2.21)
where we have dropped the stars for convenience. These simplifying assumptions are expected to be strictly valid only in the high Oh regime, where the viscous effects dominate inertia at the onset and resist the shape change of the fluid film, specifically the development of a pronounced rim.
The velocity is assumed to be continuous, which allows us to integrate (2.21) from
xs−εtoxs+εfor some smallε >0. Taking the limit asε→0 yields a jump condition
forux
[ux] =−14. (2.22)
Away from the discontinuity atxs (which without loss of generality we set as xs= 0)
we are left with the heat equation
ut = 4uxx, x >0, (2.23)
which we solve subject to the conditions
u(x,0) = 0, ux(0, t) =−41, u(x, t)→0 asx→ ∞, (2.24)
the second of which comes from the jump inux atxs and is obtained when there are
no velocity gradients within the fluid cap. The solution to (2.23) can be obtained by the method of Laplace transforms that yields
u(x, t) = t
πexp
− x2
16t
− 1
4xerfc
x
4√t
0.7
0.6
0.5 0.4
u* = u/u
c
0.3 0.2 0.1
0.1 0.2 0.3 0.4
Theory u* =
Oh > 100
Oh = 5
Oh = 1
Oh = 0.5
0.5 0.6 0.7 0.8 0.9 1.0 0
t*
π
t* = t/τ
vis
√
Figure 5. Plot of the tip velocity versus time during the early stages of retraction for different
Ohnesorge numbers. The plots forOh= 100, 500, 1000 and 10000 are indistinguishable. The dotted curve shows the theoretical resultu∗=√t∗/π, which is in good agreement with numerics up to a timet≈0.4τvis,whereτvis=μH /2γ.
In dimensional variables, the tip speed and displacement may be expressed as
u(0, t) =uc
t
πτvis
, x0=
2 3√π
t τvis
3/2
H. (2.26)
Solving (2.1) together with conditions (2.6) in a similar manner as described in the Appendix for the axisymmetric case, we show in figure 5 the evolution of the tip speed for various Ohnesorge numbers that verifies the validity of our calculation for short times. This result supports the suggestion of Brenner & Gueyffier (1999) that the geometry plays an important role in the retraction dynamics. The edge of a planar film initially recedes with a displacement that scales as t3/2 while in the
experiments reported in Debr´egeas et al. (1995), Dalnoki-Veress et al. (1999) and Rothet al. (2005), the initial retraction of a circular hole follows an exponential law. Despite our simplifying assumptions, the analytical solution obtained matches perfectly the numerical simulations at early times (t <0.2τvis). At later times and
for Oh>50, the agreement is quite good with an error of less than 6 % at t≈τvis.
Beyond that time, a number of neglected effects become significant, such as hx and
the convective term, thus rendering our approximation invalid. In figure 6, we plot the evolution of the tip speed for various Oh. We see that for films of Oh>100, the tip speeds converge. This behaviour could be anticipated from (2.21), whereOh does not appear.
2.3. Maximum film thickness
In the high Oh limit, no visible rim forms as the sheet retracts; therefore, by mass conservation, the film thickness must increase with time. To find the evolution of the film thickness hm(t), we examine (2.18). We assume that the semi-circular cap is
1.0 0.9 0.8 0.7 0.6 0.5 0.4 0.3 0.2 0.1
0 5 10 15 20
Oh = 100, 1000
Oh = 10
Oh = 1
Oh = 0.5
25 30
u* = u/u
c
t* = t/τ
vis
Figure 6. Velocity of the film edge for different Ohnesorge numbers. In the highOh limit
the velocity curves become indistinguishable.
preserved at all times. The dimensionless curvature is thus assumed to be
κ∗ =
⎧ ⎨
⎩−
2Oh2 h∗m(t)
06x∗< 12h∗m(t)/Oh
0 x∗ > 12h∗m(t)/Oh
. (2.27)
The maximum film thickness is expected to be at the point of discontinuity in curvature, the centre of the semi-circular cap, wherex∗0= (1/2)h∗m(t)Oh. Plugging this
expression forκ∗ into (2.18), integrating over an interval aroundx0∗ and shrinking the interval to zero yields the jump condition atx0∗
[h∗u∗x∗] =−14. (2.28)
Just to the right ofx0∗,we use mass conservation (2.1b) and the jump condition (2.28) to find
hm(t) =H
1 +1 4
t τvis
, (2.29)
whereH is the initial film thickness. The linear increase in film thickness is confirmed with the numerical results shown in figure 7. Since having a discontinuity in curvature would complicate the implementation of a numerical solution, we smooth the initial curvature gradient as discussed in the Appendix. The slope of the line is corrected to account for this smoothing by writing
hm=H
1 +1 8H κ0
t τvis
, (2.30)
whereκ0 corresponds to the initial curvature at the tip. It is also important to note
0 5 10 15 20 25 30 1
2 3 4 5 6 7 8 9
Oh = 1000
Oh = 100
Oh = 10
Oh = 1
Oh = 0.5
Theory
u* = h
m/H
t* = t/τvis
Figure 7. Maximum film thickness hm versus time for different Ohnesorge numbers. In the
highOh limit,hmgrows linearly in time, confirming the theory represented by the dotted line
that corresponds to (2.28). The numerical results (solid curves) at Oh= 0.5,1.0,10,100 and 1000 correspond to profiles withκ0= 2.1.
z
r r0 (t)
h(r, t)
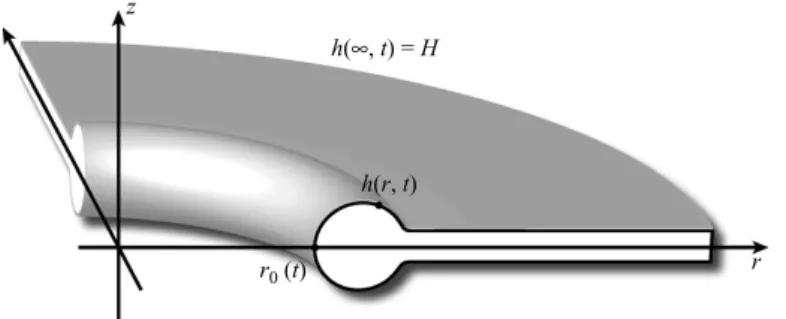
h(∞, t) = H
Figure 8.Circular sheet geometry. A circular hole expands on a flat fluid sheet owing to the
radial surface tension force that acts on its toroidal edge.
circular, so mass conservation dictates that the maximum film thickness, specifically the rim radius, increases according to√t/τinv.
3. Circular hole expansion
We now turn our attention to flow in flat films initiated by nucleating a hole of radius R0 at time t= 0 (see figure 8). To complement the numerous experimental
studies on film rupture (see for example Ranz 1950; McEntee & Mysels 1969; Debr´egeas et al. 1995; Roth et al. 2005), we develop a new theoretical model that allows us to investigate the film motion for arbitrary Ohnesorge numbers.
Holes in thin films do not necessarily open. In an axisymmetric configuration, the azimuthal curvature contributes a component to the surface tension force that opposes hole expansion. Depending on the initial film shape and hole radius, situations may arise where the hole will contract and close, and film rupture is averted (Taylor & Michael 1973). We shall henceforth proceed by considering configurations for which holes expand.
3.1. Derivation of the film equations
We consider the Navier–Stokes equations in cylindrical coordinates (Batchelor 1967)
Ut+U Ur+V Uz=−Pr/ρ+ν(Urr+Uzz+Ur/r−U/r2), (3.1)
Vt+U Vr+V Vz=−Pz/ρ+ν(Vrr +Vzz+Vr/r), (3.2)
whereU is the radial velocity,V the velocity along the axis andP the fluid pressure. We neglect any azimuthal dependence on the basis of the experiments of Debr´egeas
et al. (1995), who confirmed that the resulting motion is purely radial via particle tracking. We also have the continuity equation
(U r)r+ (V r)z= 0, (3.3)
together with the normal and tangential stress boundary conditions at z=h(r, t)/2, respectively,
−P ρ + 2ν
Ursin2θ−(Vr+Uz) sinθcosθ+Vz cos2θ z=h/2
= γ
ρκ, (3.4a)
2 (Vz−Ur) sinθcosθ+ (Vr+Uz) (cos2θ−sin2θ)z=h/2 = 0, (3.4b)
where tanθ=hr/2 is the slope of the interface andκ is the curvature of the boundary:
κ(r, t) = (1/2)hrr 1 + (1/4)h2
r 3/2 +
(1/2)hr
r1 + (1/4)h2
r
1/2. (3.5)
Finally the kinematic boundary condition may be written as
ht +U|z=h/2hr = V|z=h/2. (3.6)
For a slender sheet, assumed to be symmetric aboutz= 0, we use a Taylor expansion aboutz= 0, to write
U(r, z, t) =u(r, t) +u2(r, t)z2+· · ·, (3.7a) V(r, z, t) =v1(r, t)z+v3(r, t)z3+· · ·, (3.7b) P(r, z, t) =p(r, t) +p2(r, t)z2+· · · . (3.7c)
This approach was successfully used in the past to study jet breakup (Eggers & Dupont 1994; Eggers & Brenner 2000). Matching powers ofzin (3.3) we find that to the lowest order inz
v1=−
ur +
u r
, (3.8)
v3=−
1 3
u2r+
u2 r
Similarly, (3.1) and (3.2) yield
ut+uur =−pr/ρ+ν(urr+ur/r−u/r2+ 2u2), (3.10) v1t+uv1r+v12=−2p2/ρ+ν(v1rr+v1r/r+ 6v3). (3.11)
In the long wavelength limit,hhr we find that to leading order inhthe boundary
and kinematic conditions, (3.4a), (3.4b) and (3.6) become, respectively,
−p ρ =
γ
ρκ−2νv1, (3.12)
2u2 =−2 hr
h (v1−ur)−v1r, (3.13)
ht+uhr =v1h. (3.14)
We eliminatev1 in (3.14) using (3.8) to find ht+
1
r (urh)r = 0. (3.15)
Similarly, elimination of u2 andp from (3.10) using (3.12), (3.13) and (3.8) yields ut+uur =
4ν h
h r (ur)r
r
−uhr
2r
+ γ
ρκr. (3.16)
Equations (3.15) and (3.16) constitute a system of lubrication equations that describe the retraction of a circular sheet. However this long-wavelength approximation is not valid everywhere and the equations become singular as we approach the film tip. Similar difficulties arise in various applications of the lubrication approximation; nevertheless, such models perform surprisingly well. For instance, in Eggers & Dupont (1994), the lubrication model yields excellent agreement with experimental observations of jet breakup and pendant drop formation.
3.2. Early stages of expansion
We proceed by performing an early-time analysis of the governing equations (3.15) and (3.16) in the high Oh limit, by following the ideas developed in §2.2 for planar sheets. Introducing the scalings
r =OhH r∗, h=H h∗, u=ucu∗, R0=OhH R0∗ andt =τvist∗, (3.17)
we write (3.16) in non-dimensional form as
u∗t∗+u∗u∗r∗ =
4
h∗
h∗ r∗(u
∗r∗)
r∗
r∗
− u∗hr∗
2r∗
+ 1 2Oh
−2κ∗
r∗. (3.18)
We assume that initially the rim corresponds to the inner portion of a torus and matches onto a flat sheet. The film curvature thus becomes
κ∗=
2Oh2−1 +r∗s−r r
R∗0 6r∗< rs∗
0 r∗> rs∗ , (3.19)
wherers∗=R∗0+(1/2)Oh−1is the point where the rim and the flat sheet meet. Note here
the second term in the expression for the curvature that arises from the axisymmetry of the problem. Dropping the stars for convenience, we find that in the same limit considered for early-stage planar sheet retraction (i.e. convective terms negligible, and
hconstant forr > rs) the same jump condition arises, namely,
To the right of the jump,hvariations are neglected, so we consider (ur)t = 4
(ur)rr−
(ur)r
r
, (3.21)
which can be solved by separation of variables to yield
u=Aeλ2t
K1
1
2λr
, (3.22)
whereAandλare constants to be determined andK1 is the modified Bessel function
of the second kind of order 1. Note that the modified Bessel function of the first kindI1 diverges as r → ∞and is thus dropped sinceu→0 at infinity. Denoting the
radius of the punctured hole and its time derivative byr0 and ˙r0, respectively, we take rs ≈r0(t) to obtain
˙
r0=Aeλ
2t
K1
1
2λr0
(3.23) upon application of the boundary condition u(r0, t) = ˙r0(t). To proceed further, we
note that the argument of K1, λr0/2, is small during early stages of retraction. By
retaining only the first-order term in the small argument expansion ofK1, we find
˙
r0=
2Aeλ2t
λr0
, (3.24)
which givesr0(t) =R0eλ
2t/2
. This allows us to write the sheet speed to the right of the cap as
u= λ
3R2 0
4 e λ2t
K1
1 2λr
. (3.25)
Just to the right of the jump, we calculate the velocity gradient at r=rs ≈ r0 and
expand the derivative ofK1 to obtain
ur(rs+) =−λ2/2 (3.26)
to leading order in r0. Thus far, λ remains unknown and needs to be determined
by the jump condition. Unlike the planar case, there are non-zero velocity gradients within the cap whenr0 is sufficiently small. Solving for the flow within the cap cannot
be done analytically, but we note that the term hr/ h dominates the other terms in
(3.18), which thus assumes the form
hr
h
(ur)r
r − u
2r
= 0. (3.27)
By requiring the continuity of u(r, t) at r=r0, this equation may be solved for u to
yield
u= λ
2R3/2 0
2r1/2 . (3.28)
The velocity gradient atr=rs− is thus
ur(rs−) =−λ2/4. (3.29)
Using (3.26) and (3.29) in (3.20) we find that λ= 1. We therefore conclude that the hole grows exponentially during the early stages of retraction
r0(t) =R0exp
t
2τvis
as expressed in dimensional variables. Hence the exponential hole growth reported by Debr´egeas et al. (1995) need not be attributed to viscoelastic effects; rather, it is a generic feature of circular hole retraction on a viscous sheet. We note that our approach, based entirely on the lubrication equations, complements the energy argument of Debr´egeaset al. (1995).
3.3. Simulation results
The governing equations are solved numerically as described in the Appendix. Even though we explored a wide range of Oh, particular attention was given to the high
Oh regime, in order to make comparisons with recently reported experimental work (e.g. Debr´egeaset al.1995; Dalnoki-Veresset al.1999; Rothet al.2005). The regimes identified in the work of Brenner & Gueyffier (1999) are also present in the retraction of circular sheets (figure 2). While the differences between the two geometries are not significant at low Oh, there are striking differences in the retraction dynamics in the high Oh regime. For the sake of clarity of presentation, we devote § §3.3.1, 3.3.2 and 3.3.3 to discussions of the high (Oh10), moderate (0.01<Oh<10) and low (Oh<0.01) Ohnesorge number regimes, respectively.
3.3.1. High Oh simulations
Experiments in the high Oh limit have been limited to fluids with long chain polymers, specifically PDMS in Debr´egeas et al. (1995) and molten polystyrene in Dalnoki-Veress et al. (1999) and Roth et al. (2005). We proceed by demonstrating that the essential features of retraction reported are captured by a Newtonian fluid description.
Figure 9 illustrates the evolution of typical film profiles and midplane velocities at various Oh. As Oh increases beyond 100, the rim diffuses towards the bulk of the film, thus making the film appear to be of uniform thickness. We note that even at high Oh, the film is slightly thicker near the rim and very gradually thins further away from the tip. It is also important to note that the region of influence of the tip motion, which grows in time as more fluid is set into motion, is directly proportional toOh.
Just as the velocity curves for a planar sheet asymptote to a single curve in the high Oh limit (see figure 6), something similar can be said for the circular sheet. However, the initial size of the nucleated hole must now be considered. In particular, having written the momentum equations in non-dimensional form using (3.17) and by assuming that the film profile near the tip is preserved, we can replace the derivative of the film curvature with the approximate expression
κr∗∗ ≈2Oh2δ
r−r0∗, (3.31)
provided that the azimuthal curvature term in (3.5) is much smaller than the curvature of the film profile, i.e. H /R0 1. Doing so leaves us with a set of dimensionless
equations that are independent of Oh. Therefore, different simulations will yield almost identical results provided that r0∗, the dimensionless initial hole radius, is the same. In other words, curves that have the same ratio HOh/R0 will yield virtually
indistinguishable self-similar velocity curves, as confirmed by our simulations. For example, tip speeds of a simulation withOh= 104andR
0= 50H are indistinguishable
from these with Oh= 103 and R 0= 5H.
Figure 10 indicates the dependence on Oh of the approach of the sheet tip to the Taylor–Culick speed. High Oh films require substantially more time than low Oh
5 Oh = 10 E F E E F F E F D D D D C C C C B B B B Oh = 100
Oh = 1000
Oh = 10 000
Oh = 10
Oh = 100
Oh = 1000
Oh = 10 000 1.0
0.8 0.6
u/uc
u/uc
u/uc
u/uc
0.4 0.2
0 50 100 150 200 250 300
500 1000 1500 2000 2500 3000
0.5 1.0 1.5 2.0 2.5 3.0
× 104
0.5 1.0 1.5 2.0 2.5 3.0
(a) (b)
0
0 10 20 30 40 50
0 10 20 30 40 50
0 10 20 30 40 50
0 10 20 30 40 50
h/H
–5
5 0
h/H
–5
5 0
h/H
–5
5 0
h/H
r/H r/H
–5 1.0 0.8 0.6 0.4 0.2 0 1.0 0.8 0.6 0.4 0.2 0 1.0 0.8 0.6 0.4 0.2 0 A F A F A F A F
Figure 9.Evolution of the film boundaries (panela) and midplane speeds (panelb) for high
Ohand initial hole sizeR0= 50H in time increments ofδt= 10τvis. Curves A to F correspond to times t∗=t/τvis= 0, 10, 20, 30, 40 and 50, respectively. Distances are scaled by the film thicknessH. AsOh is progressively increased from 10 to 104, the rim becomes less pronounced and diffuses towards the bulk. Concurrently, the region of influence of the disturbance caused by the tip motion extends further into the film and its lateral extent is proportional toOh.
amount of fluid needs to be accelerated by surface tension forces concentrated near the film edge.
In figure 11 we confirm the exponential retraction rate observed in the experiments (see Debr´egeas et al. 1995; Dalnoki-Veress et al. 1999; Rothet al. 2005) during the early stages of retraction. We note that the higher theOh, the longer the hole grows according to the exponential law. By comparison with figure 10, we infer from our simulations that the deviation from the exponential behaviour occurs quite early in the retraction process, typically when the rim speed is of the order of 0.2uc.
In order to assess how Oh affects the acceleration phase, we plot in figure 12 the time required for the tip to attain 30 %, 60 % and 90 % of the Taylor–Culick speed for different Oh. Each simulation was initialized with a hole radius ofR0= 50H.As
can be inferred from the theoretically predicted exponential law (1.3), the times t1,2
needed for the tip to attain the speed of a certain fraction ofuc that correspond to
Oh1,2 satisfy the relation t1 Oh1 −
t2 Oh2
= 2 log
Oh1 Oh2
, (3.32)
provided Oh1,2 > 100 and the punctured hole is not large. At lower Oh, there is a
clear deviation from this relation, which indicates that the rim acceleration is different from that predicted in the viscous limit.
1.0
0.9 G
F
E D
C B
A 0.8
0.7 0.6 0.5 0.4 0.3 0.2 0.1
5 10 15 20 25 30 35 40
A: Oh = 10 000 B: Oh = 5 000 C: Oh = 1 000 D: Oh = 500 E: Oh = 100 F: Oh = 50 G: Oh = 10
45 50 0
u* = u/u
c
t* = t/τ
vis
Figure 10. Speed at the film edge as a function of time for different values of Oh, with
initial hole radius of R0= 50H. The higher the Oh the slower the approach towards the Taylor–Culick speeduc.
104
103
Theory Oh = 10 000
Oh = 5000
Oh = 1000
Oh = 500
Oh = 100
Oh = 50
Oh = 10 = et*/2
102 r0 (t)/R0
101
100
5 10 15 20 25 30 35 40 45 50 0
r0 (t) R0
t* = t/τ
vis
Figure 11. Hole growth versus time for differentOh, for an initial hole sizeR0= 50H. The
higher theOh, the longer the hole grows according to the exponential law (1.3) as deduced by Debr´egeaset al.(1995).
35
30
30 % 60 % 90 %
Slope = 2
Slope = 2
Slope = 2 25
20
15
10
101 102 103
Oh
104
5
0
t/τvis
Figure 12.Time to reach 30 %, 60 % and 90 % of the Taylor–Culick speed versus Oh for
simulations withR0= 50H.ForOh>100,there is logarithmic dependence on the Ohnesorge number, confirming the theoretically predicted retraction rate (1.3).
104
(a) (b)
103
102
R0/H = 5
R/0 H = 5000
R/0 H = 500
R/0 H = 50
R/0 H = 5 R0/H = 50
R0/H = 500
R0/H = 5000 101
100
0 10 20 30 40 50 Theory
Planner Limit
= et*/2
r0 (t)/R0
r0 (t)
R0
0 0.1 0.3 0.2 0.4 0.5 0.6 0.7 0.8 0.9 1.0
10 20 30 40 50
u* = u/uc
t* = t/τvis t* = t/τvis
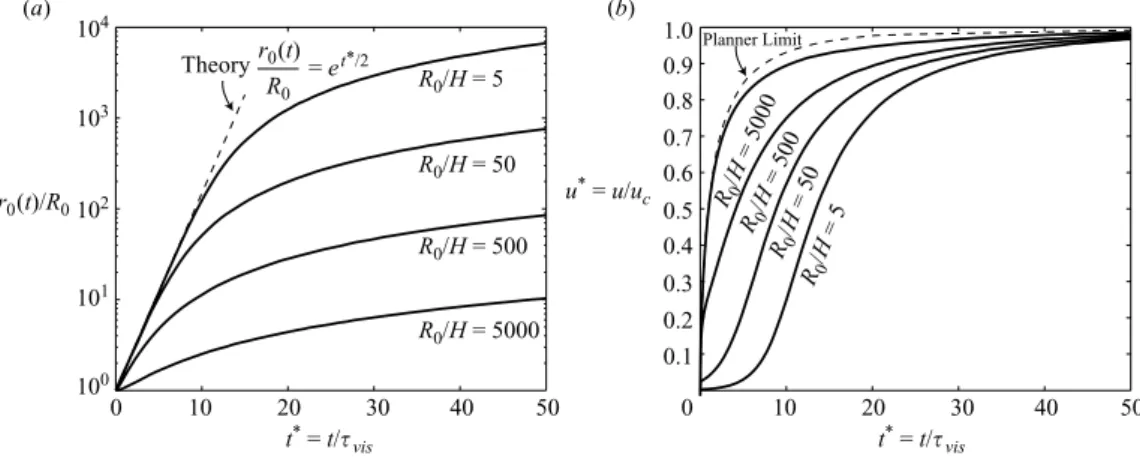
Figure 13.Variation of initial hole size forOh= 1000: (a) hole radius versus time and (b) tip
speed versus time. For small initial hole radii, the agreement with the theoretically predicted exponential rate lasts for longer times. For larger initial radii, the retraction speed rapidly approaches the planar limit considered in§2.
We proceed by looking at the effect of the initial hole size on the retraction dynamics. Figure 13(a) shows the evolution of the hole radius for a number of different initial radii, whenOh= 1000. The calculations indicate that the smaller the initial hole size, the longer the hole radius grows exponentially according to (1.3). As expected, the circular geometry is thus influencing the dynamics for longer when the initial hole radius is smaller: when the hole radius is large, the film motion rapidly
102
101
–0.6
0 0.5 1.0 1.5 2.0 –0.4
–0.2 0
H
H
0.2 0.4 0.6
α = 15
α = 3
α = 0
α = 0
α = 3
α = 15
100
0 1 2 3 4
Theory Debre´geas et al.
5 6
r0 (t)/R0
t* = t/τ
vis
Figure 14. Effect of the initial film profile (as specified byα) on sheet retraction. Hole radius
versus time for Oh= 8×10³ and R
0= 40H. The inset shows the corresponding initial film profiles in the vicinity of the tip. A more pointed initial film profile retracts faster until its tip relaxes to a semi-circular cap; thereafter, the film retracts at the theoretically predicted rate shown by the dashed curve, corresponding to (3.30). The dotted line indicates the experimentally observed retraction rates reported by Debr´egeaset al.(1995).
approaches the planar limit considered in §2 (see figure 13b). Variations in the initial hole radius affect the low Oh films to a lesser extent, mainly due to the shorter time scales involved in the approach touc.
The discrepancy between the time scale of hole growth deduced by Debr´egeaset al.
(1995), 1.4τ (see (1.2)), and that predicted by theory, 2τ (see (1.3)), prompts us to look at the effect of the initial film profile on the initial stages of retraction. The initial film profile near the tip need not be semi-circular. We adopt the film profile of (A 8) discussed in the Appendix, whose sharpness can be conveniently modified via a single parameter,α >0. Asα→0, the tip approaches a circular cap; the curvature at the tip increases with αaccording to (A 9). In figure 14, we show the effect on the retraction rate as the initial tip profile becomes progressively more pointed. Sheets with more pointed tips initially retract faster owing to the enhanced surface tension force. Eventually as the rim acquires a more circular form, the retraction slows down to the rate predicted by theory. Whether the pointed initial profile is the source of the anomalously large retraction rate observed by Debr´egeas et al. (1995) cannot be assessed due to uncertainty in the film shape and the limited duration over which their data was collected.
Rothet al.(2005) similarly observed that the rate of retraction is faster at the onset of retraction; fitting of the experimental data was achieved by assuming an empirically deduced time-dependent viscosity. However, our calculation yields a behaviour that
2.5
2.0
1.5 ln r0 (t)/R0
1.0
0.5
0.5 1.0 1.5 2.0 2.5 3.0 3.5 4.0 0
t* = t/τ
vis
Figure 15.Hole radius versus time. The experimental data of Rothet al.(2005) is presented as
circles, and our simulations forOh= 1000 andα= 32 by a solid line. After an initial transient of orderτvis=μH /2γ, the retraction rate decreases to that predicted by (3.30), corresponding to the dashed line.
is similar to their experimental observations, suggesting that the initial retraction rate they observe might be reasonably attributed to the initial puncture shape. This is demonstrated in figure 15, where we show the experimental results of Roth et al.
(2005) with the results of our simulations. As a caveat, we note that the Ohnesorge number of the experiments was of the order of 1012, a value not attainable in our
simulations. Nevertheless, using a pointed initial profile forOh= 1000 andα= 32 we confirm that the behaviour observed in the experiments of Rothet al.(2005) can also arise for Newtonian films.
3.3.2. Moderate Oh simulations
Moderate Oh films (0.01<Oh<10) arise in most configurations of practical importance, for example the bursting of soap films. In figure 16 we show the evolution of the tip velocity for differentOh, when the initial hole radius isR0= 50H. Not much
can typically be said about the acceleration phase of the film edge because it happens extremely rapidly, on a timescale of the order of microseconds. For comparison, we included the calculation for a highOh film (Oh= 100) to illustrate that the transition touc happens on a much longer time scale at moderate Oh. It is also worth noting
that in theOh= 0.04 case, there is temporarily a slight reduction in the acceleration of the tip, because of the capillary waves generated ahead of the rim. These waves transfer momentum upstream of the advancing rim and the associated wave drag presumably slows down the rim.
In figure 17 we show the evolution of typical film profiles and radial midplane velocities. At low Oh, the motion is more localized to the vicinity of the edge. The
0 10 20 30 40 50 60
t/τinv
70
A: Oh = 0.04 B: Oh = 0.20 C: Oh = 1.00 D: Oh = 10.00 E: Oh = 100.00 80 90 100 0.1
0.2 0.3 0.4 0.5
u/uc
0.6
1.0 0.8 0.6 0.4 0.2
2 4 6 8 10 0
0.7 0.8 0.9
B
B A
A A
C
C
D
D
E
E 1.0
Figure 16. Speed of the film tip versus time since rupture for moderateOh. Note the relatively
slow retraction of the Oh= 100 film. (Inset) Early stages of retraction. WhenOh= 0.04, there is a brief reduction in the rate at which the film approaches uc, due to the production of
capillary waves ahead of the rim.
surface tension forces impart acceleration to the rim, which in turn collides with the quiescent fluid in the bulk of the film. The inertia of the fluid ahead of the advancing edge is thus responsible for rim growth. Film retraction at Oh<0.1 is accompanied by capillary waves that precede the rim. We note that similar behaviour was reported in the inertial dewetting of thin films by Buguin, Vovelle & Brochard-Wyart (1999). The work of Song & Tryggvason (1999) provided some physical insights regarding rim and capillary wave formation on planar sheets. In particular, via two-dimensional simulations, they argued that the curvature variations near the tip generate local vorticity that initiates the retraction of the edge. For high Oh films, this vorticity diffuses through the bulk of the film so that no rim forms.
While the study of vorticity in our one-dimensional model is not possible, we can gain some insights into the flow by constructing an approximation to the velocity field using the expansions from §3.1. Using the velocity u and film thickness h obtained from our simulations, we plot the velocity field (U, V) along the (r, z) directions in polar coordinates and the pressure along the midplane of the film using the set of equations (3.7). Even though the computation ofuand his second-order accurate in
δr and the computations for U and V involve the evaluation of higher derivatives of u, it is possible to capture the essential features of the flow. Figure 18 shows the velocity field in the film together with the pressure along the midplane for films in the three regimes of interest. In the highOh regime (Figure 18a), the pressure field attains its maximum near the film tip and monotonically decreases towards the bulk. This pressure gradient essentially generates the flow that drives the retraction. As the Oh
5 Oh = 0.04 F E F D C B
B C DEF
B B C C D D E E F F Oh = 0.1
Oh = 0.2
Oh = 1
Oh = 0.04
Oh = 0.1
Oh = 0.2
Oh = 1 1.0
0.5 0
u/uc
u/uc
u/uc
u/uc
–0.5 –1.0
0
0 5 10 15 20 25 30 35 40 5 10 15 20 25 30 35 40 0 5 10 15 20 25 30 35 40 0 5 10 15 20 25 30 35 40
(a) (b)
0
0 5 10 15 20 25 30
0 5 10 15 20 25 30
0 5 10 15 20 25 30
0 5 10 15 20 25 30
h/H
–5 5 0
h/H
–5 5 0
h/H
–5 5 0
h/H
r/H r/H
–5 1.0 0.5 0 –0.5 1.0 0.5 0 –0.5 1.0 0.8 0.4 0.6 0.2 A A A A B CDE F B C D E F B C D E F B C D E F
Figure 17.Evolution of the film boundaries and midplane velocities for moderateOh in time
increments of δt= 20τinv. Curves A to F correspond to times t∗=t/τinv= 0, 20, 40, 60, 80 and 100, respectively. The initial hole radius isR0= 50H.Note the generation of the capillary waves that are most pronounced forOh= 0.04 and the associated oscillations in the midplane velocities. As Oh is increased, the capillary waves diminish and the rim begins to diffuse towards the bulk of the film.
then drops at the junction of the rim and the sheet. From the velocity field in the lab frame we notice a weak backflow towards the rim that necessarily contributes to rim growth. For the low Oh film (Figure 18c) at each successive neck there are pressure drops and we see circulating flow, confirming the local generation of vorticity. 3.3.3. Low Oh simulations
The situation is markedly different for Oh<0.04. A simulation was run for
Oh= 0.01, frames of which are shown in figure 19. As expected, the capillary waves generated are of higher amplitude than theOh= 0.04 case. When these waves grow sufficiently in amplitude, they begin to interact with the growing rim. As time progresses, this interaction becomes more violent, causing the thickness of the neck near the rim to approach zero. Att= 100τinv, when the simulation was terminated, the
film was on the verge of pinch-off: a sharp curvature arose that was barely resolved with our grid spacing.
The inset of figure 19 shows the evolution of the tip speed, which oscillates with an amplitude that increases over time, as the rim interacts with the waves it generates. This can be compared with the Oh= 0.04 film in figure 16, where the influence of waves is only apparent during a short initial interval, and the tip speed increases monotonically towards uc. An indication exists in the work of Song & Tryggvason
(1999) that this wave–rim interaction can occur forOh=O(0.01); however, their two-dimensional simulations were not carried out long enough to see whether it becomes
3 (a)
2 1 0
P∗
(z/H)
–1 –2 –3
0 5 10 15
Oh = 1
3 (b)
2 1 0
P∗
(z/H)
–1 –2 –3
0 5 10 15
Oh = 0.2
3 (c)
2 1 0
P∗
(z/H) –1
–2 –3 –4
0 5 10 15
Oh = 0.01
r/H
Figure 18. Velocity field and midplane pressure for (a)Oh= 1.0, (b)Oh= 0.2 and (c)Oh= 0.01.
The velocity field is depicted by the arrows and the curve corresponds to the dimensionless pressure P∗=Hp/γ along the film midplane. For Oh= 1 (a), a monotonic decrease in the pressure prohibits the formation of a rim, which diffuses towards the bulk of the film. AsOh
decreases, a rim begins to form due to the pressure drop at the rim neck (b). ForOh= 0.01 (c), vorticity generates capillary waves that are connected to the rim via a neck region. Note the pressure lows in the neck regions produced by the high local curvatures.
more violent at later times. Such increasing oscillations of the tip speed were also observed at the edge of a contracting filament in the simulations of Notz & Basaran (2004) (figure 20). Depending on the Ohnesorge number, there were cases where the filament profiles they obtained were not single-valued functions of r near pinch-off. As a caveat, we note that our lubrication model presumes a single-valued film profile and so cannot always accurately predict pinch-off times. Simulations at even lower
Oh (Oh= 0.005) reveal that sheet breakup can swiftly follow the initiation of sheet retraction.
1.4 1.2 1.0 0.8 0.6 0.4 0.2
0 20 40 60 80 100
u∗=u/uc
t* = t/τ
inv
Figure 19.Sequence of the film profiles for Oh= 0.01 in time increments ofδt= 5tinv; (inset)
tip speed versus time. The capillary waves are more pronounced and begin to interact with the rim after an initial transient. This interaction becomes more violent as time progresses and eventually causes breakup. (Inset) The evolution of the tip speed resulting from the rim–wave interaction.
Figure 20. A contracting filament atOh= 0.001 can exhibit similar breakup characteristics
4. Discussion
We have presented the results of a combined theoretical and numerical examination of the retraction of fluid sheets, giving particular attention to elucidating the influence of the sheet viscosity. First, we have clarified the shortcomings of the attempt of Dupr´e (1867) to use an energy principle to obtain the retraction speed, and corrected it by appropriate manipulation of the lubrication equations. In the planar geometry, half of the surface energy is converted to kinetic energy, and the other half dissipated through the action of viscosity, as was demonstrated numerically by S¨underhaufet al.
(2002). We found that viscous forces do not contribute to the total momentum of the film; consequently our formulation yields the same long time limit deduced by Taylor (1959) and Culick (1960) from inviscid theory. This result can also be understood on the grounds that the viscous forces within the film are internal forces that do not contribute to the film’s momentum budget. Most significantly, our study has yielded insight into the transient approach to the Taylor–Culick speed, a transient influenced by both geometry and viscosity.
In the lowOh regime (Oh<0.01), sheet retraction is inertia-dominated and capillary waves form ahead of a growing rim. For moderate Oh (0.01<Oh<10), no capillary waves form ahead of the rim and for the high Oh (Oh10) films, the retraction is dominated by viscosity and no rim forms. Brenner & Gueyffier (1999) were the first to identify these regimes in the two-dimensional planar geometry. We have extended their work on retraction in this geometry by predicting analytically the dynamics in the high Oh regime at the onset of rupture. In particular, we deduced that the edge of the film recedes initially according to t3/2, and that the maximum film thickness grows linearly in time. The retraction dynamics are markedly different in the circular geometry.
We have developed a lubrication model that allows us to investigate the retraction dynamics of a circular hole and made comparisons of our model with the experimental investigations of Debr´egeaset al.(1995), Dalnoki-Veresset al.(1999) and Rothet al.
(2005). Our direct manipulation of the lubrication equations to deduce the early stage dynamics in the high Oh limit provides an alternative to the energy argument presented by Debr´egeaset al.(1995). Our results have also confirmed the conjecture of Brenner & Gueyffier (1999) that geometry is important in sheet retraction especially in the highOh regime. During the initial stages of retraction, the circular hole punctured on a sheet expands with a radial speed ∼et/2τ, while the planar sheet recedes with a
speed∼√t/τ. This difference is associated with the contribution to the surface tension force coming from the azimuthal curvature that opposes the initial expansion of the circular hole and the viscous stresses that are relatively large when the punctured hole is small. In the long time limit the governing equations asymptote to those arising in the planar geometry and the rim speed approaches uc.
We suggest that the discrepancy between the predicted and observed retraction rates in the study of Debr´egeas et al. (1995) may be attributed in part to the details of the puncture, specifically the initial film profile. We have demonstrated that the initial retraction rate could be made faster with a slightly pointed initial film profile, but as time progresses, the retraction rate approaches that of a film with a nearly semi-circular initial profile. Similar observations were made by Roth et al. (2005) in their experiments on polystyrene films, but were not attributed to the film profile. It is hoped that our findings may motivate and inform further experiments on the early stages of film retraction.
Finally, we note that our model neglects any three-dimensional effects; specifically, variations in rim radius expected to accompany capillary instability of the rim (e.g.
McEntee & Mysels 1969; Pandit & Davidson 1990). While rim instability is related to the Rayleigh–Plateau instability, the physical picture is more complex owing to rim growth. For instance in the moderateOh regime, if a rim of radius R were to pinch off due to the capillary instability, it would do so after a timeτc∼
ρR3/2γ, which
can be comparable to the appropriate time scale of retraction,τinv=
ρH3/2γ .This
is especially true at the onset of retraction, where H and R are comparable. The tendency of the rim growth to suppress the onset of this instability was apparent in the experiments of McEntee & Mysels (1969) and demonstrated in the numerical simulations (at Oh= 0.1 and 0.03) of Fullana & Zaleski (1999), who suggested that the rim will eventually become unstable to perturbations with wavelengths that are typically a few orders of magnitude larger than the film thickness. The stability of the rim is enhanced not only by rim growth, but by the action of viscosity as was confirmed in the experiments of Debr´egeaset al. (1995), Dalnoki-Veresset al. (1999) and Rothet al.(2005). Improved understanding of the rim stability will contribute to our ability to predict drop sizes resulting from film disintegration (see Bush & Hasha 2004; Bremond & Villermaux 2006; Roisman, Horvat & Tropea 2006; Villermaux 2007).
John W. M. Bush gratefully acknowledges the financial support of the NSF through Career Grant CTS-0130465. The authors thank Jens Eggers for a number of valuable exchanges.
Appendix. Numerical method
In non-dimesionalizing the governing equations (3.15) and (3.16), the time scale is chosen according to the Ohnesorge number. By selecting the larger time scale ofτinv
and τvis, we facilitate the computations since with the same computational cost, we
can integrate the equations further in physical time. Sinceτvis=Oh τinv, τinv and τvis
are the appropriate time scales for, respectively,Oh<1 andOh>1.
Equations (3.15) and (3.16) are rearranged to solve forf =h2, because the slope of
h, which goes like√r−r0(t) near the tip, becomes infinite there. Doing so avoids the
difficulties in taking the derivatives of h to evaluate the curvature at the tip, which now transforms to
κ = 8 2ffrr−f
2
r
16f +f2
r
3/2 +
fr
r16f +f2
r
1/2. (A 1)
In their examination of jet breakup, Eggers & Dupont (1994) remedied the difficulty of hr blowing up at the tip by fitting an even quartic polynomial to the jet profile
in this region. Our approach is more natural in terms of implementation as the discretization of the equations is done without resorting to polynomial fits.
Since this is a free boundary problem, where the tip of the film moves, solving the system of equations requires the remeshing of the domain at each time step. To avoid this difficulty, we map the computational domain (r, t) to the physical (r, t)-plane via the transformation
r =
1− r0(t)
L
r+r0(t), (A 2a)
t =t, (A 2b)
where 06r6L and L is the radial extent of the film. Under this mapping, the edge of the film is always located at r= 0 in the computational domain and r=L