ORIGINAL ARTICLE
Meta-barcoding in combination
with palynological inference is a potent
diagnostic marker for honey floral composition
Rama Chandra Laha
1*†, Surajit De Mandal
1†, Lalhmanghai Ralte
1, Laldinfeli Ralte
1, Nachimuthu Senthil Kumar
1,
Guruswami Gurusubramanian
1, Ramalingam Satishkumar
2, Raja Mugasimangalam
3and Nagesh Aswathnarayana Kuravadi
4Abstract
Identification of floral samples present in honey is important in order to determine the medicinal value, enhance the production of honey as well as to conserve the honey bees. Traditional approaches for studying pollen samples are based on microscopic observation which is laborious, time intensive and requires specialized palynological knowl-edge. Present study compares two composite honey metagenome collected from 20 samples in Mizoram, Northeast India using three gene loci- rbcL, matK and ITS2 that was sequenced using a next-generation sequencing (NGS) platform (Illumina Miseq). Furthermore, a classical palynology study for all 20 samples was carried out to evaluate the NGS approach. NGS based approach and pollen microscopic studies were able to detect the most abundant floral components of honey. We investigated the plants that were frequently used by honey bees by examining the results obtained from both the techniques. Microscopic examination of pollens detected plants with a broad taxonomic range covering 26 families. NGS based multigene approach revealed diverse plant species, which was higher than in any other previously reported techniques using a single locus. Frequently found herbaceous species were from the family Poaceae, Myrtaceae, Fabaceae and Asteraceae. The future NGS based approach using multi-loci target, with the help of an improved and robust plant database, can be a potential replacement technique for tedious microscopic studies to identify the polleniferous plants.
Keywords: Honey, Multilocus target, DNA barcoding, Palynology
© The Author(s) 2017. This article is distributed under the terms of the Creative Commons Attribution 4.0 International License (http://creativecommons.org/licenses/by/4.0/), which permits unrestricted use, distribution, and reproduction in any medium, provided you give appropriate credit to the original author(s) and the source, provide a link to the Creative Commons license, and indicate if changes were made.
Introduction
Honey has been used for centuries as a complex natural sweetener having therapeutic properties. Bees obtain pollen and nectar from flowers and hence the plant com-position varies due to different topography, climate and farming practices. The knowledge of flora in a region is essential for successful bee keeping, management of bee colonies and production of other bee products.
Conventional methods to analyze the association between plants and pollinators depend on time inten-sive observation of individual interaction (Mitchell et al.
2009). Few methods have been proposed for the deter-mination of botanical and geographical origin of honey. The conventional approach used microscopic observa-tion of pollens present in honey (palynology), which is very tedious and time consuming process. The other common chemical methods based on aroma compounds, free amino acids or minerals and trace element were also developed, but requires sophisticated and expen-sive instruments (Hermosín et al. 2003; Fernández-Tor-res et al. 2005; Anklam et al. 1998). Moreover, all these methods provide only limited information on the plant composition of honey samples. While some efforts have
Open Access
*Correspondence: [email protected]
†Rama Chandra Laha and Surajit De Mandal contributed equally to this work
been made to develop protocols to ascertain the ento-mological sources of honey (Schnell et al. 2010), most have focused on identifying its plant origin. Past studies have often relied upon diagnostic phytochemicals (Cotte et al. 2004; Tosun 2013) or the study of pollen in honey (melissopalynology) (Alves and Santos 2014). Although the latter approach requires considerable expertise and cannot distinguish many plant species (Kaškonienė and Venskutonis 2010), yet it is a powerful diagnostic tool, especially when used with other methods (Hawkins et al.
2015). However, melissopalynology is ineffective in cases where low value honey is filtered to remove its source pollen and spiked with pollen from the desired mono-flora (Kaškonienė and Venskutonis 2010).
With the advancement in next generation sequencing technology, study of the botanical and geographical ori-gin of honey is much easier since it is fast, precise and reliable. Both Roche 454 and Illumina sequencing has been successfully used in analysing mixed species in var-ious applications. Metabarcoding, identification of gen-era or species present in a composite DNA sample has been introduced by Richardson et al. (2015a) targeting the ITS2 marker using Illumina sequencing technology. This also had higher sensitivity and resolution in iden-tification of plant species than microscopic analysis of the pollen samples. Ion Torrent platform was used to evaluate the DNA barcoding technology for quantify-ing airborne pollen (Richardson et al. 2015b), whereas pyrosequencing was also successfully used to analyse pollen from honey samples (Sickel et al. 2015; Keller et al. 2015).
Here, we evaluated the botanical composition of honey samples to verify the hypothesis that the metabarcoding will reveal more information congruent with the palyno-logical study. To test this multigene Illumina approach along with microscopic observation were used.
Materials and methods
Study site and honey sampling
Twenty different honey samples were collected from Aizawl and Champhai districts of Mizoram, an eastern Himalayan biodiversity hotspot, Northeast India. The honey samples were obtained from bee keepers during February to June 2014 (Table 1). Mizoram state is situ-ated in the extreme end of the Himalayan ranges and is predominantly mountainous terrain. The region enjoys a moderate climate, tropical location and due to its high elevation with an annual average rainfall of 250 cm.
Palynological study
Preparation of pollen slides from honey: acetolysis method
One millilitre of honey sample was taken in a test tube and diluted to 10 ml by hot distilled water of 40 °C. The diluted honey was sieved through a mesh of 100 µm. The suspension thus obtained was centrifuged at 3000 rpm for 5 min. The pellet of pollen sediment was subjected for acetolysis (Louveaux et al. 1978). Pollen grains were examined and identified under the light microscope. Per-centage occurrence of pollen was used to determine their frequencies for determining the major and minor honey-bee plants. Fresh flower of known plant pollen slides was prepared according to same acetolysis method as refer-ence for identification (Louveaux et al. 1978).
Pollen spectrum study
The pollen grains were identified using local flora and confirmed by comparing pollen types with reference pol-len slides. Based on the frequencies of polpol-len grain in various honey samples, the pollen count and percentage of pollen types were calculated and pollen spectra were prepared (Erdtman 1960). These pollen types were clas-sified based on the recommendation of the International Commission for bee-Botany: “secondary pollen type (S)”
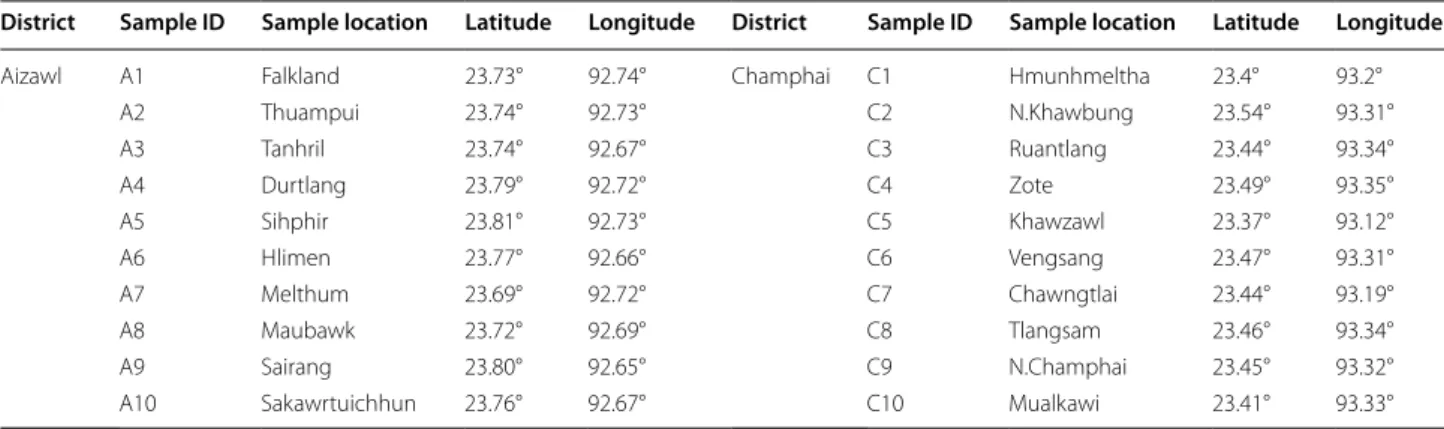
Table 1 Geographical location of the honey samples used in this study
District Sample ID Sample location Latitude Longitude District Sample ID Sample location Latitude Longitude
Aizawl A1 Falkland 23.73° 92.74° Champhai C1 Hmunhmeltha 23.4° 93.2°
A2 Thuampui 23.74° 92.73° C2 N.Khawbung 23.54° 93.31°
A3 Tanhril 23.74° 92.67° C3 Ruantlang 23.44° 93.34°
A4 Durtlang 23.79° 92.72° C4 Zote 23.49° 93.35°
A5 Sihphir 23.81° 92.73° C5 Khawzawl 23.37° 93.12°
A6 Hlimen 23.77° 92.66° C6 Vengsang 23.47° 93.31°
A7 Melthum 23.69° 92.72° C7 Chawngtlai 23.44° 93.19°
A8 Maubawk 23.72° 92.69° C8 Tlangsam 23.46° 93.34°
A9 Sairang 23.80° 92.65° C9 N.Champhai 23.45° 93.32°
(16–45%), “important minor pollen type (I)” (3–15%) and “minor pollen type (M)” (<3%).
Preparation of honey for DNA extraction
Honey samples were dissolved in 1 ml sterile water, incubated at 65 °C for 30 min followed by centrifugation at 5000 rpm for 10 min. The supernatant was discarded, and the pellet was dried for 5 min at room tempera-ture and further dissolved in 500 µl extraction buffers (100 mM Tris–HCl, 50 mM EDTA, 50 mM NaCl, 10% SDS, pH 7.5). 0.5 g of sterilized glass beads (0.5–1 mm diameter) was added and the pellet was ground with a glass rod for 5–10 min. 100 µl DTT (110 mM) and 10 µl proteinase K (10 mg/ml) were added to the mixture and incubated at 56 °C for 1 h. A second incubation (65 °C for overnight) was performed by adding 500 µl cetyltri-methyl ammonium bromide (CTAB) extraction buffer (20 mM Tris–HCl, pH 8.0, 10 mM EDTA, pH 8.0, 10% CTAB, 5% polyvinylpyrrolidone), 10 µl proteinase K, and 50 µl DTT. Phenol–chloroform–isoamyl alcohol (500 µl) was added and centrifuged at 10,000 rpm for 10 min. DNA was precipitated using 500 µl isopropanol and 100 µl sodium acetate (3 mM) (Lalhmangaihi et al.
2014). The extracted DNA was checked by agarose gel electrophoresis and stored at −20 °C prior to subsequent analysis.
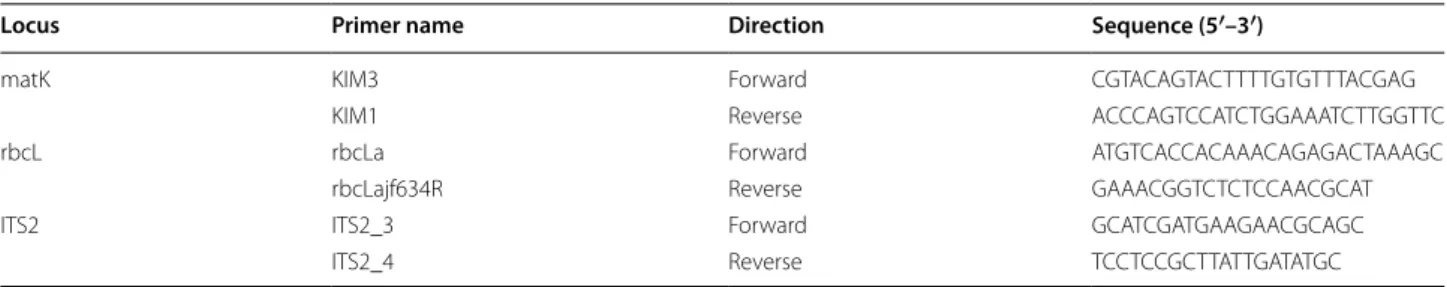
Amplification of the DNA barcode genes
For Illumina sequencing, all ten honey DNA samples from each district were pooled to make a composite DNA sample (Chp = composite DNA sample from Champhai district and Azl = composite honey DNA sample from Aizawl district). DNA from the two composite honey DNA samples (Chp and Azl) was amplified using three candidate DNA barcode gene primers: matK, rbcL and ITS2 (Table 2) (18, 19). PCR was performed in a total of 50 µl reaction volume consisting of 50 ng of DNA, 1X PCR buffer (75 mM Tris–HCl (pH 9.0), 50 mM KCl, 20 mM (NH4)2SO4), 2.5 mM MgCl2, 0.125 mM of each
dNTPs, 0.5 µM of each primer and 0.5 U of Taq Polymer-ase (3B DNA polymerPolymer-ase, 3B Black Bio Biotech India). All
PCR reactions was performed in an Agilent Sure Cycler 8800 using a touchdown amplification profile consisting of an initial denaturation at 95 °C for 5 min followed by 40 cycles of denaturation at 95 °C for 2 min, annealing at 65 °C for 90 s, extension at 72 °C for 2 min with a final extension at 72 °C for 10 min. In this touchdown proto-col, the annealing temperature was uniformly decreased from 65 °C to 45 °C at the rate of 1 °C per cycle. The PCR products were resolved using 2% Agarose gel at 120 V till the samples reached 3/4th of the gel. The gel was visu-alized under UV light and the image was captured. The PCR products from each sample with the three primers was pooled in an equal concentration and preceded for NGS sequencing.
Illumina sequencing
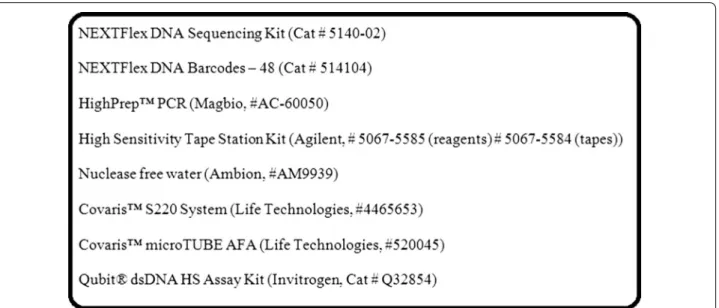
An Illumina-compatible library was prepared at Geno-typic Technology, Bangalore, India according to manu-facturer recommended protocol (Fig. 1). In brief, pooled amplicons were sheared to generate fragments of approx-imately 200–500 bp in a Covaris micro tube with the E220 system (Covaris, Inc., Woburn, MA, USA). The fragment size distribution was confirmed with Agilent High Sensitivity DNA Tape station (Agilent Technolo-gies, Santa Clara, CA). Next, the fragmented DNA was cleaned up using HighPrep beads (MagBio Genomics, Inc, Gaithersburg, Maryland) followed by end-repair, A-tailing, and ligation of the Illumina multiplexing adapt-ers. The adapter-ligated DNA was cleaned up using HighPrep beads (MagBio Genomics, Inc, Gaithersburg, Maryland). Then, the adapter ligated fragments were subjected to 10 rounds of PCR (denaturation at 98 °C for 2 min, cycling (98 °C for 30 s, 65 °C for 30 s and 72 °C for 1 min) and final extension at 72 °C for 5 min) and the amplicons were purified with HighPrep beads. The Illumina-compatible libraries were quantified with Qubit flourometer and their fragment length distribution was analyzed on Agilent High Sensitivity DNA Tape station (Agilent Technologies, California, USA). The Illumina sequencing was carried out using Illumina Nextseq 500 platform.
Table 2 Primers used for PCR amplification
Locus Primer name Direction Sequence (5′–3′)
matK KIM3 Forward CGTACAGTACTTTTGTGTTTACGAG
KIM1 Reverse ACCCAGTCCATCTGGAAATCTTGGTTC
rbcL rbcLa Forward ATGTCACCACAAACAGAGACTAAAGC
rbcLajf634R Reverse GAAACGGTCTCTCCAACGCAT
ITS2 ITS2_3 Forward GCATCGATGAAGAACGCAGC
Data analysis
The Illumina raw reads were quality checked using Fast QC followed by adapter clipping and trimming of low quality bases trimming towards 3′-end using fastx toolkit (Andrews and Fast 2010; Martin 2011; Gordon and Hannon 2010). De novo assemblies of quality fil-tered reads were carried out using velvet assembler (Zerbino and Birney 2008). The kmer value was opti-mized to select the best kmer for the assembly. The contigs were analysed by BLAST against NCBI Vir-idiplantae database to annotate the sequences in the assembly (Altschul et al. 1990). The annotation results were analysed and removed any duplicates to identify the species present in the sample.
Results
Pollen spectrum analysis of honey samples
Polleniferous plants were classified based on nature of vegetation such as wild plants, horticultural plants, orna-mental plants and agricultural plants. Under wild plants, 42 species were identified majority of them taxonomically belongs to the family Fabaceae followed by Asteraceae, Euphorbiaceae, Malvaceae, Myrtaceae, Lamiaceae, Rosaceae, Combretaceae, Verbenaceae, Betulaceae,
Polygonaceae, Amaranthaceae, Oxalidaceae, Bom-bacaceae, Fagaceae, Rubiaceae, Cyperaceae, Elaeocar-paceae, Lythraceae, Solanaceae and Bignoniaceae. Eleven species falls under the horticultural plants taxonomically classified under the family Myrtaceae, Caricaceae, Ruta-ceae, Arecaceae, Rubiaceae, Lythraceae, Anacardiaceae,
Musaceae and Vitaceae. Ornamental plants consist of 8 species, major two falls under the family Malvaceae
followed by each from Asteraceae, Rubiaceae, Euphor-biaceae and Rosaceae. While agricultural plants were represented by 15 species classified under the family
Cucurbitaceae, Brassicaceae Poaceae, Malvaceae, Api-aceae, Moringaceae, Solanaceae (Additional file 1: Table S1).
Analyses of pollen types
In the present study, the study area consists of mixed vegetation with multi-floral honey samples. Analysis of pollen count revealed that some plant species were more frequently represented in the honey sample. This is due to their readily available nectar coming from longer flow-ering periods for the particular plant species in available in the studied area. During the study period, the second-ary pollen type (16–45%) was dominated by the families
Fabaceae, Asteraceae and Myrtaceae. Other family identi-fied under the secondary pollen types were Poaceae, Api-aceae, Arecaceae, Betulaceae, Brassicaceae, Caricaceae,
Fig. 1 NEXTFlex DNA sample preparation guide. Illumina-compatible libraries were prepared using the above procedure
Table 3 Sequence characteristics of the composite honey samples
Sequence characteristics Aizawl dt. Champhai dt.
Kmer 123 127
Number of contigs 43 30
Assemply length 32,855 16,832
N50 contigs 16 12
N50 length 673 bp 625 bp
Min contig length 281 389
Max contig length 3818 920
Combretaceae, Cucurbitaceae, Cyperaceae, Datiscaceae,
Euphorbiaceae, Lythraceae, Malvaceae, Moringaceae, Musaceae and Rubiaceae. Plant species identified under
the important minor pollen types (3–15%) were mostly represented by family Fabaceae, Asteraceae, Malva-ceae, Myrtaceae, Cucurbitaceae, Euphorbiaceae, Rubi-aceae, Brassicaceae, Combretaceae, Lamiaceae, Poaceae,
Rosaceae, Solanaceae and Verbenaceae. While minor pol-len types (<3%) were dominated by the family Fabaceae
followed by Asteraceae, Malvaceae, Myrtaceae, Cucur-bitaceae and Euphorbiaceae and Rubiaceae (Additional file 1: Table S1). Other detected families under minor pollen types were represented by ≤3 plant species. Plant species identified under all the pollen types is shown in Additional file 1: Table S1.
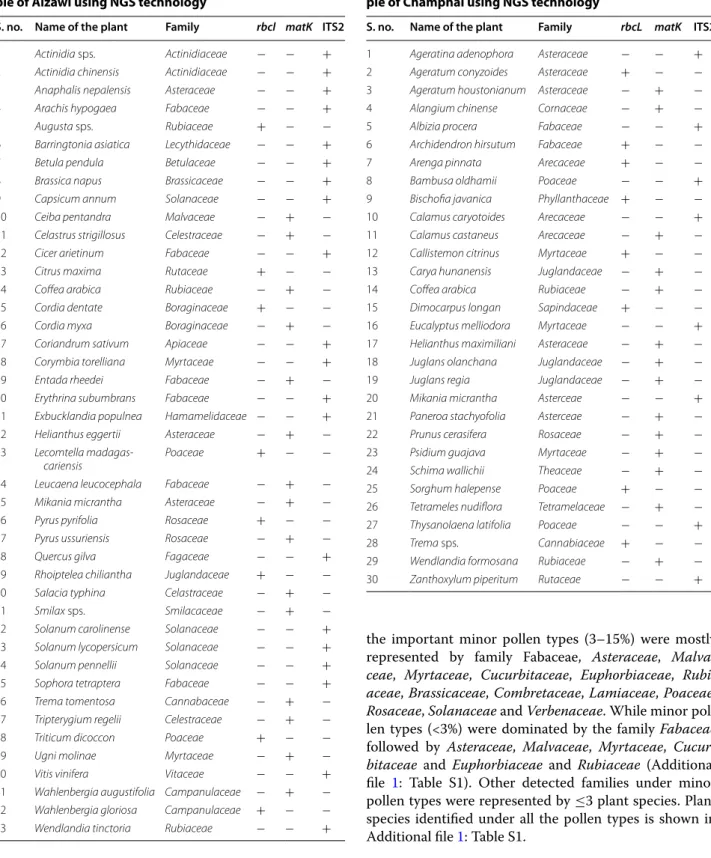
Identification of plant species using NGS technology Present analysis detected 52 and 30 contigs from Aizawl and Champhai district respectively (Table 3). Based upon the NGS study, a total of 73 plant species were
Table 4 Plant species found in the composite honey sam-ple of Aizawl using NGS technology
S. no. Name of the plant Family rbcl matK ITS2
1 Actinidia sps. Actinidiaceae − − +
2 Actinidia chinensis Actinidiaceae − − +
3 Anaphalis nepalensis Asteraceae − − +
4 Arachis hypogaea Fabaceae − − +
5 Augusta sps. Rubiaceae + − −
6 Barringtonia asiatica Lecythidaceae − − +
7 Betula pendula Betulaceae − − +
8 Brassica napus Brassicaceae − − +
9 Capsicum annum Solanaceae − − +
10 Ceiba pentandra Malvaceae − + −
11 Celastrus strigillosus Celestraceae − + −
12 Cicer arietinum Fabaceae − − +
13 Citrus maxima Rutaceae + − −
14 Coffea arabica Rubiaceae − + −
15 Cordia dentate Boraginaceae + − −
16 Cordia myxa Boraginaceae − + −
17 Coriandrum sativum Apiaceae − − +
18 Corymbia torelliana Myrtaceae − − +
19 Entada rheedei Fabaceae − + −
20 Erythrina subumbrans Fabaceae − − +
21 Exbucklandia populnea Hamamelidaceae − − +
22 Helianthus eggertii Asteraceae − + −
23 Lecomtella
madagas-cariensis Poaceae + − −
24 Leucaena leucocephala Fabaceae − + −
25 Mikania micrantha Asteraceae − + −
26 Pyrus pyrifolia Rosaceae + − −
27 Pyrus ussuriensis Rosaceae − + −
28 Quercus gilva Fagaceae − − +
29 Rhoiptelea chiliantha Juglandaceae + − −
30 Salacia typhina Celastraceae − + −
31 Smilax sps. Smilacaceae − + −
32 Solanum carolinense Solanaceae − − +
33 Solanum lycopersicum Solanaceae − − +
34 Solanum pennellii Solanaceae − − +
35 Sophora tetraptera Fabaceae − − +
36 Trema tomentosa Cannabaceae − + −
37 Tripterygium regelii Celestraceae − + −
38 Triticum dicoccon Poaceae + − −
39 Ugni molinae Myrtaceae − + −
40 Vitis vinifera Vitaceae − − +
41 Wahlenbergia augustifolia Campanulaceae − + −
42 Wahlenbergia gloriosa Campanulaceae + − −
43 Wendlandia tinctoria Rubiaceae − − +
Table 5 Plant species found in the composite honey sam-ple of Champhai using NGS technology
S. no. Name of the plant Family rbcL matK ITS2
1 Ageratina adenophora Asteraceae − − +
2 Ageratum conyzoides Asteraceae + − −
3 Ageratum houstonianum Asteraceae − + −
4 Alangium chinense Cornaceae − + −
5 Albizia procera Fabaceae − − +
6 Archidendron hirsutum Fabaceae + − −
7 Arenga pinnata Arecaceae + − −
8 Bambusa oldhamii Poaceae − − +
9 Bischofia javanica Phyllanthaceae + − −
10 Calamus caryotoides Arecaceae − − +
11 Calamus castaneus Arecaceae − + −
12 Callistemon citrinus Myrtaceae + − −
13 Carya hunanensis Juglandaceae − + −
14 Coffea arabica Rubiaceae − + −
15 Dimocarpus longan Sapindaceae + − −
16 Eucalyptus melliodora Myrtaceae − − +
17 Helianthus maximiliani Asteraceae − + −
18 Juglans olanchana Juglandaceae − + −
19 Juglans regia Juglandaceae − + −
20 Mikania micrantha Asterceae − − +
21 Paneroa stachyofolia Asterceae − + −
22 Prunus cerasifera Rosaceae − + −
23 Psidium guajava Myrtaceae − + −
24 Schima wallichii Theaceae − + −
25 Sorghum halepense Poaceae + − −
26 Tetrameles nudiflora Tetramelaceae − + −
27 Thysanolaena latifolia Poaceae − − +
28 Trema sps. Cannabiaceae + − −
29 Wendlandia formosana Rubiaceae − + −
identified in two composite honey metagenome from two different districts of Mizoram, North-East India (Tables 4, 5). It was found that all the three genes used during NGS study (rbcL, matK, and ITS2) were the important marker for identification of plant species. A total of 16 plants were identified using rbcL gene,
29 species using matK and 29 species using ITS2 gene sequences.
At the species level, only five plant species were found to be the common in both palynological and NGS stud-ies, whereas 12 common genera were identified in both the approaches. This might be due to the inadequate
information on gene information, which hinders the identification of all the polleniferous plant species using NGS approach (Fig. 2a, b). The only species Coffea ara-bica was found to be commonly present in both Cham-phai and Aizawl district.
Discussion
Next generation sequencing (NGS) has been successfully used for taxonomic assessment of polleniferous plant from honey samples (Richardson et al. 2015a, b; Sickel et al. 2015; Keller et al. 2015). Present study combines traditional microscopic analysis with DNA metabarcod-ing to understand the scope of identifymetabarcod-ing the pollenifer-ous plants from honey samples.
The two approach for study DNA metabarcoding iden-tified 74 number of polliniferous plant species from the two districts of the state Mizoram, while melissopa-lynological study identified 76 numbers of plant species. Hence, the two techniques are important and relevant for identifying the polliniferous plants. Rechardson et al. (2015b) studied honey pollen samples using three meta-barcoding targeting (ITS2, matK, and rbcL) as well as by light microscopy and found a significant correlation between the relative abundance of the pollen types in the studied samples with both metabarcoding and micro-scopic observation (Richardson et al. 2015b). They also denoted that multilocus metabarcoding is more reliable than single-locus analyses (Sickel et al. 2015).
Mizoram falling under the Indo-Burma Biodiversity hotspot zone is possessing large forest coverage. Due to Jhum cultivation, forests in Mizoram are degraded and analyzing pollen present in honey samples will help to understand the effect of such anthropogenic activi-ties that affect the diversity of plant species and floral resource quality. This will also help in habitat restoration and conservation efforts (Myers et al. 2000; De Mandal et al. 2016). In both the approaches, most of the plant species did not show similar taxonomic placement up to the genus level or by the species level. This might be due to the lack of databases for the polleniferous plants of the studied region or lack of sufficient information for taxo-nomic identification.
Melissopalynology study the microscopic analysis of pollen content of the honey from the locality, with field study involving phenology provide reliable informa-tion regarding the floral types which serve as the pol-len sources for the honey bees. Polpol-len found in honey is used to determine the honey types, quality control and to ascertain whether honey is adulterated or not (Villanueva
1994). From the pollen spectra, it was observed that the two districts include both naturalized flora as well as cultivated crops. It also gives a wider knowledge of bee preferences in local floral. Generally, entomophilic plants
were numerous in the pollen spectrum of each honey sample studied and the honey from the source localities was fairly rich in pollen types. The microscopical analysis of honey is important in establishing the seasonal pollen spectra of honey from various climatic and geographical areas, for evaluation of honey originated from various physiographic region (Chaturvedi 1983). In the present study, many pollens were unidentifiable, which reflects the drawbacks in the taxonomical classification system.
The outcome of this study depicts the link between honey bees and its foraging plant species, honeybee foraging plant diversity using a DNA metabarcoding approach. In the present study, palynology data has iden-tified many plant species that were not identifiable by NGS. This might be because of incomplete plant data-base and future research should focus on strengthening the information on the plant DNA barcode genes. In our study, majority of the pollen were unidentifiable using palynology which might represent many other plant spe-cies. These plant species might have been identified using the NGS approach. It will be of immense value for the development of beekeeping industry for the studied area and for the entire region and this information could be used to selectively grow native plants that are important for the honey bees. The present study will be helpful for identifying different floral sources used by honey bees and improved the conservation of economically viable plants.
Abbreviations
rbcL: ribulose-bisphosphate carboxylase gene; MatK: maturase K gene; ITS: internal transcribed spacer; DNA: deoxyribonucleic acid; PCR: polymerase chain reaction; NGS: next-generation sequencing.
Authors’ contributions
Conceived and designed the experiments: SDM, RCL and NSK. Performed the experiments: SDM and LR. Analyzed the data: SDM and NSK. Contributed reagents/materials/analysis tools: RCL and NSK. Wrote the paper: SDM, RCL and NSK. Critically reviewed and corrected NSK, SDM, RCL, RM, GG and RS. All authors read and approved the final manuscript.
Author details
1 Departments of Botany, Biotechnology and Zoology, School of Life Sciences, Mizoram University, Aizawl, Mizoram 796004, India. 2 Department of Bio-technology, Bharathiar University, Coimbatore 641046, India. 3 Genotypic Technologies, Bangalore, India. 4 QTLomics Technologies, Bangalore, India.
Acknowledgements
Authors thankful to the DBT-Bioinformatics Infrastructure Facility, Mizoram University for providing computing facilities for NGS data analysis.
Competing interests
The authors declare that they have no competing interests.
Additional file
Availability of data and materials
The raw data obtained had been deposited in the NCBI Sequence Read Archive (SRA) with the Bio Project ID-PRJNA335943.
Funding
This research was sponsored by a Twining Grant (BT/423NE/TBP/2013) from the Department of Biotechnology, Govt. of India, New Delhi.
Publisher’s Note
Springer Nature remains neutral with regard to jurisdictional claims in pub-lished maps and institutional affiliations.
Received: 9 May 2017 Accepted: 12 June 2017
References
Altschul SF, Gish W, Miller W, Myers EW, Lipman DJ (1990) Basic local alignment search tool. J Mol Biol 215(3):403–410
Alves RD, Santos FD (2014) Plant sources for bee pollen load production in Sergipe, northeast Brazil. Palynology 38(1):90–100
Andrews SF, Fast QC (2010) A quality control tool for high throughput sequence data
Anklam E, Lipp M, Radovic B, Chiavaro E, Palla G (1998) Characterisation of Italian vinegar by pyrolysis–mass spectrometry and a sensor device (‘electronic nose’). Food Chem 61(1):243–248
Chaturvedi MI (1983) Pollen analysis of autumn honeys of Kumaon region. Proc Indian Nat Sci Acad 49:125–133
Cotte JF, Casabianca H, Giroud B, Albert M, Lheritier J, Grenier-Loustalot MF (2004) Characterization of honey amino acid profiles using high-pressure liquid chromatography to control authenticity. Anal Bioanal Chem 378(5):1342–1350
De Mandal S, Panda AK, Bisht SS, Kumar NS (2016) MiSeq HV4 16S rRNA gene analysis of bacterial community composition among the cave sediments of Indo-Burma biodiversity hotspot. Environ Sci Pollut Res 23:12216–12226
Erdtman G (1960) The acetolysis method. A revised description. Svensk Bot Tidsk 54:561–564
Fernández-Torres R, Perez-Bernal JL, Bello-Lopez MA, Callejon-Mochon M, Jimenez-Sanchez JC, Guiraúm-Pérez A (2005) Mineral content and botanical origin of Spanish honeys. Talanta 65(3):686–691
Gordon A, Hannon G (2010) Fastx-toolkit. FASTQ/A short-reads preprocessing tools (unpublished). http://hannonlab.cshl.edu/fastx_toolkit
Hawkins J, de Vere N, Griffith A, Ford CR, Allainguillaume J, Hegarty MJ, Baillie L, Adams-Groom B (2015) Using DNA metabarcoding to identify the floral
composition of honey: a new tool for investigating honey bee foraging preferences. PLoS ONE 10(8):e0134735
Hermosín I, Chicón RM, Cabezudo MD (2003) Free amino acid composition and botanical origin of honey. Food Chem 83:263–268
Kaškonienė V, Venskutonis PR (2010) Floral markers in honey of various botanical and geographic origins: a review. Compr Rev Food Sci Food Saf 9(6):620–634
Keller A, Danner N, Grimmer G, Ankenbrand M, Ohe K, Ohe W, Rost S, Härtel S, Steffan Dewenter I (2015) Evaluating multiplexed next generation sequencing as a method in palynology for mixed pollen samples. Plant Biol 17(2):558–566
Lalhmangaihi R, Ghatak S, Laha R, Gurusubramanian G, Kumar NS (2014) Pro-tocol for optimal quality and quantity pollen DNA isolation from honey samples. J Biomol Tech 25(4):92
Louveaux J, Maurizio A, Vorwohl G (1978) Methods of melissopalynology. Bee World 59(4):139–157
Martin M (2011) Cutadapt removes adapter sequences from high-throughput sequencing reads. EMBnet 17(1):10
Mitchell RJ, Irwin RE, Flanagan RJ, Karron JD (2009) Ecology and evolution of plant-pollinator interactions. Ann Bot 103:1355–1363
Myers N, Mittermeier RA, Mittermeier CG, Da Fonseca GA, Kent J (2000) Biodi-versity hotspots for conservation priorities. Nature 403(6772):853–858 Richardson RT, Lin CH, Quijia JO, Riusech NS, Goodell K, Johnson RM (2015a)
Rank-based characterization of pollen assemblages collected by honey bees using a multi-locus metabarcoding approach. Appl Plant Sci 3(11):1500043
Richardson RT, Lin CH, Sponsler DB, Quijia JO, Goodell K, Johnson RM (2015b) Application of ITS2 metabarcoding to determine the provenance of pollen collected by honey bees in an agroecosystem. Appl Plant Sci 3(1):1400066
Schnell IB, Fraser M, Willerslev E, Gilbert MT (2010) Characterisation of insect and plant origins using DNA extracted from small volumes of bee honey. Arthropod Plant Interact 4(2):107–116
Sickel W, Ankenbrand MJ, Grimmer G, Holzschuh A, Härtel S, Lanzen J, Steffan-Dewenter I, Keller A (2015) Increased efficiency in identifying mixed pollen samples by meta-barcoding with a dual-indexing approach. BMC Ecol 15(1):20
Tosun M (2013) Detection of adulteration in honey samples added various sugar syrups with 13 C/12 C isotope ratio analysis method. Food Chem 138(2):1629–1632
Villanueva GR (1994) Nectar sources of European and Africanized honey bees (Apis mellifera L.) in the Yucatán peninsula, Mexico. J Appl Biol Sci 33(1):44–58