Birthweight Extremes and Neonatal and
Childhood Outcomes after Preterm Premature
Rupture of Membranes
Matthew R. Grace, MD
1Sarah Dotters-Katz, MD
2Michael W. Varner, MD
2Kim Boggess, MD
1Tracy A. Manuck, MD
1,21Division of Maternal Fetal Medicine, Department of Obstetrics and Gynecology, University of North Carolina School of Medicine, Chapel Hill, North Carolina
2Division of Maternal Fetal Medicine, Department of Obstetrics and Gynecology, University of Utah, Salt Lake City, Utah
Am J Perinatol 2016;33:1138–1144.
Address for correspondence Matthew R. Grace, MD, Division of Maternal Fetal Medicine, Department of Obstetrics and Gynecology, University of North Carolina School of Medicine, 3010 Old Clinic Building, CB#7516, Chapel Hill, NC 27599-7516
(e-mail: [email protected]).
Preterm premature rupture of membranes (PPROM) is the leading identifiable cause of preterm birth and affects 3% of all pregnancies.1Following PPROM, women are at high risk of additional pregnancy complications including preterm labor, placental abruption, and chorioamnionitis.2,3 Women with PPROM between 23 and 34 weeks of gestation and without evidence of other immediate complications are typically
administered a course of antenatal corticosteroids, intrave-nous magnesium sulfate for neuroprotection (up to 32 wk), and latency antibiotics, and are hospitalized until delivery.4–6 Premature infants, including those born after PPROM, are at risk of both short-term and long-term morbidity and death. Long-term complications of prematurity persist into child-hood and beyond, and may include neurodevelopmental
Keywords
►
small for gestational
age
►
large for gestational
age
►
preterm premature
rupture of
membranes
►
neonatal morbidity
►
childhood morbidity
Abstract
Objective
To determine the association between birthweight extremes and risk of
adverse neonatal and childhood outcomes following preterm premature rupture of
membranes (PPROM).
Study Design
This is a secondary analysis of data from the Bene
fi
cial Effects of
Antenatal Magnesium Sulfate Trial. Women with nonanomalous singletons and PPROM
delivering
24.0 weeks were included. Birthweight was classified as small for
gesta-tional age (SGA), appropriate for gestagesta-tional age (AGA), or large for gestagesta-tional age
(LGA). Composite severe neonatal morbidity and childhood outcomes at age 2, were
compared between these groups.
Results
One thousand
five hundred and ninety-eight infants were included (58 SGA,
1,354 AGA, and 186 LGA). There was an inverse relationship between birthweight and
rate of composite major neonatal morbidity (55.2% of SGA, 31.5% of AGA, 18.3% of LGA,
p
<
0.001). Former-SGA children were more likely to be diagnosed with major
composite childhood morbidity at age 2 (25.9% of SGA, 8.3% of AGA, 5.9% of LGA,
p
<
0.001). In multivariate models, LGA infants had improved initial neonatal outcomes
compared with AGA infants (adjusted odds ratio [aOR], 0.44; 95% con
fi
dence interval
[CI], 0.28
–
0.71;
p
¼
0.001).
Conclusion
Among infants delivered following PPROM, those who were LGA at
delivery had improved composite adverse neonatal outcomes. SGA increases the risk
of severe neonatal morbidity, early childhood death, and moderate/severe cerebral
palsy at age 2.
received May 21, 2016 accepted May 25, 2016 published online July 1, 2016
Copyright © 2016 by Thieme Medical Publishers, Inc., 333 Seventh Avenue, New York, NY 10001, USA.
Tel: +1(212) 584-4662.
disabilities, failure-to-thrive, vision and hearing impairment, and cerebral palsy (CP).7,8Although gestational age at birth is typically regarded as the most important factor influencing the risk of both short- and long-term morbidity, other risk factors are known to affect outcomes, including birthweight, gender, and medication exposure (e.g., antenatal corticoste-roids, magnesium sulfate) prior to delivery.8,9Birthweight estimates are often used along with gestational age to counsel families regarding infant outcome following preterm delivery and in decisions regarding antenatal testing and intervention, mode of delivery, and postnatal intervention.10,11The corre-lation between ultrasound (US)-based estimates of fetal weight in the setting of PPROM and postnatal birthweight is understudied, and is likely hindered by the high incidence of oligohydramnios and anhydramnios in this population.
The extent to which extremes of birthweight (e.g., being large for gestational age [LGA] or small for gestational age [SGA] compared with birthweight that is appropriate for gestational age [AGA]) affect postnatal outcomes among infants born after PPROM is unknown. We sought to determine the relationship between birthweight extremes (LGA, SGA) and major neonatal and childhood morbidity. We hypothe-sized that compared with AGA infants delivered after PPROM, LGA infants have lower prevalence of adverse neonatal and childhood outcomes and that SGA infants have higher inci-dence of adverse neonatal and childhood outcomes.
Materials and Methods
This is a secondary analysis of a multicenter, randomized clinical trial of antenatal magnesium sulfate versus placebo administered to women at imminent risk for early preterm birth (<32 wk) to prevent death and CP in their offspring. The inclusion criteria and randomization protocol for the original trial have been previously reported.12 Briefly, the original study recruited women from 1997 to 2004 at 20 centers, who were at high risk of preterm delivery between 24 to 31 weeks’ gestation for any indication. The majority of enrolled women had pregnancies complicated by PPROM. Per the original protocol, study staff evaluated surviving infants at 6, 12, and 24 months corrected gestational age. Written, informed consent was obtained at the time of the original study from each participant. This secondary analysis used a de-identified dataset, and after review by our Institutional Review Board (IRB) at the University of North Carolina, was considered exempt from IRB oversight.
For the purposes of this secondary analysis, we included women with singleton, nonanomalous gestations with a diagnosis of PPROM who delivered at 24 weeks 0 days through 34 weeks and 6 weeks. Gestational age was deter-mined from standard algorithms using last menstrual period and US criteria.13Neonatal birthweight was classified as AGA (10–90 percentile), LGA (90percentile), or SGA (< 10percen-tile) based upon gender- and gestational age-specific contem-porary national norms.14The primary neonatal outcome was a composite of severe neonatal morbidity, defined as one or more of the following; neonatal sepsis, grade III or IV intra-ventricular hemorrhage, periintra-ventricular leukomalacia, severe
(stage II or III) necrotizing enterocolitis, bronchopulmonary dysplasia (BPD), and/or death during the initial hospitaliza-tion. The primary childhood outcome was a composite of stillbirth or infant death by 1 year of age, or moderate or severe CP, as assessed at thefinal follow-up visit, prespecified to occur at 2 years of age. Secondary outcomes included individual components of each of the two primary composite outcomes and Bayley Scales of Infant Development II Mental Development Index (MDI) and/or Psychomotor Development Index (PDI) greater than 2 standard deviation (SD) below the mean at age 2. We also compared weight at the time of childhood follow-up assessments to determine whether for-merly-SGA infants remained smaller than their formerly-AGA and formerly-LGA counterparts in early childhood.
Bivariate analyses were by chi-square or Fisher’s exact for categorical variables, analysis of variance or Kruskal–Wallis equality of proportions rank test when there were greater than two categories. The Wilcoxon-type test for trend as described by Cuzick was utilized to assess trend across ordered groups.15Multivariable analysis was performed us-ing stepwise backward elimination logistic regression, and factors withp<0.20 remained infinal models. All data were analyzed using STATA version 13.1 (College Station, TX). In the
final bivariate and multivariable analyses ap-value of<0.05 was considered significant.
Results
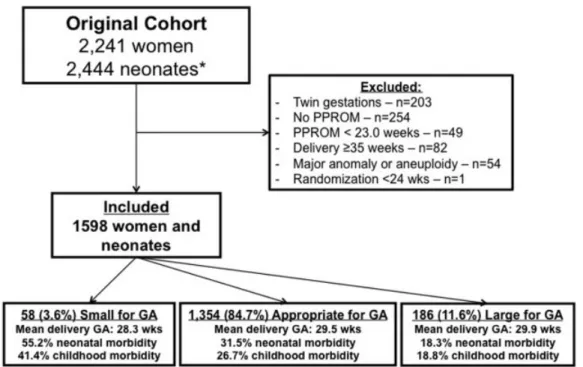
From the original cohort of 2,241 women, 1,598 women and their infants met inclusion criteria (►Fig. 1). Of these, 58 (3.6%) were SGA, 1,354 (84.7%) were AGA, and 186 (11.6%) were LGA. Demographic characteristics are compared by birthweight group in►Table 1. Groups were different with regard to likelihood of diabetes mellitus diagnosis and pre-pregnancy body mass index (►Table 1).
►Table 2shows the pregnancy characteristics of our study cohort. Overall, 494 women (30.9%) had afirst trimester US (<14 week-gestation), which did not vary by birthweight group (►Table 2). Other pregnancy dating criteria, were also similar between groups (►Table 2). Women with SGA infants had PPROM, and subsequent delivery at earlier gestational ages than women with AGA and LGA infants; they were also more likely to deliver by cesarean and require a cesarean delivery for fetal intolerance of labor (►Table 2).
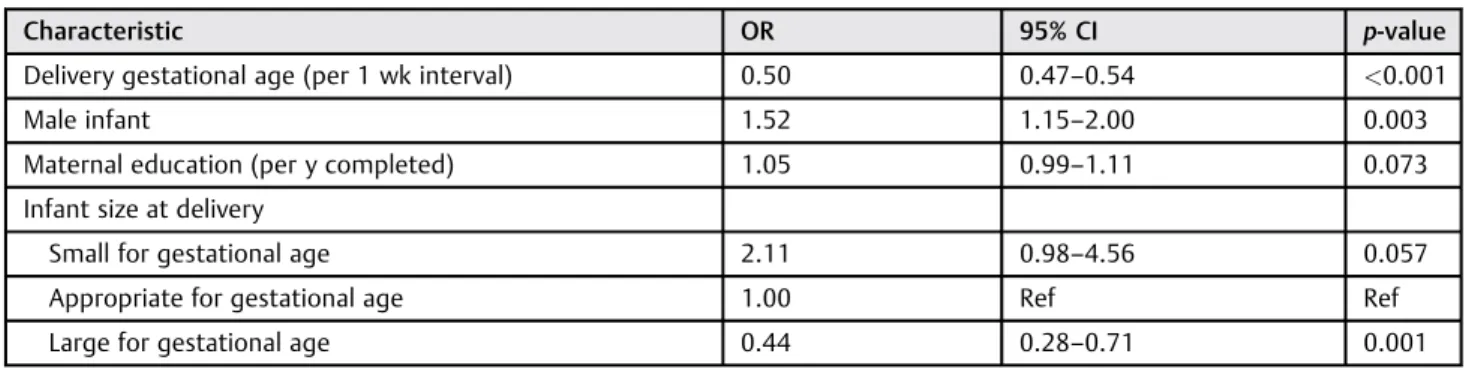
In multivariable models, several factors remained associ-ated with major neonatal morbidity (►Table 4). After con-trolling for delivery gestational age, compared with AGA infants, LGA infants were less likely (aOR, 0.44; 95% CI, 0.28–0.71; p¼0.001), and SGA infants were more likely,
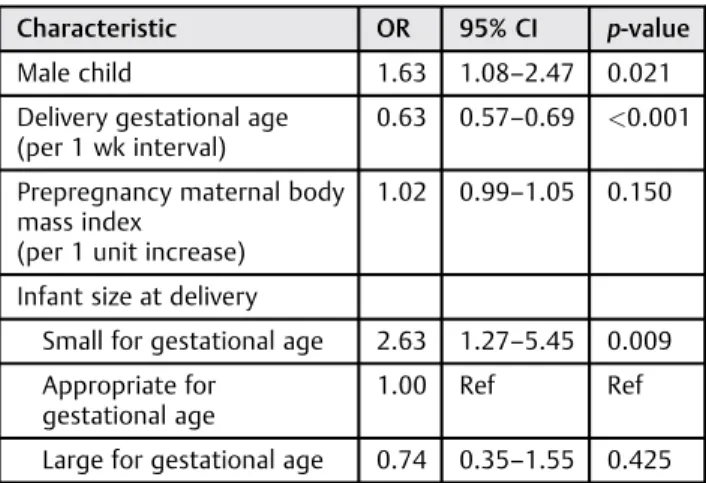
(aOR, 2.11; 95% CI, 0.98–4.56;p¼0.057) to have a composite adverse outcome. However, former-SGA infants were more likely to develop major childhood morbidity at age 2 (aOR, 2.63; 95% CI, 1.27–5.45; p¼0.009), compared with AGA infants, whereas those former-LGA infants had similar risk Fig. 1 Study enrollment. GA, gestational age; PPROM, preterm premature rupture of membranes.There were 203 twin pregnancies.
Table 1 Demographic characteristics, stratified by birthweight group
Characteristic Small for
gestational age N¼58
Appropriate for gestational age N¼1,354
Large for gestational age N¼186
p-value
Maternal age (y; median, IQR) 25.5 (22–31) 26 (21–30) 27 (22–32) 0.023
Prepregnancy body mass index (kg/m2; median, IQR)
25.2 (20.6–30.1)
24.4 (21.2–29.8)
26.7 (22.3–30.9)
0.007
Race/ethnicity (n; %)
African-American 36 (62.1) 612 (45.2) 77 (41.4) 0.302
Caucasian 15 (25.9) 499 (36.8) 74 (39.8)
Hispanic 6 (10.3) 211 (15.6) 31 (16.7)
Married (n; %) 26 (44.8) 635 (47.0) 101 (54.3) 0.160
High school education or higher (n; %) 35 (61.4) 865 (63.9) 130 (69.9) 0.248
Alcohol use during pregnancy (n;%) 6 (10.3) 130 (9.6) 18 (9.7) 0.982
Tobacco use during pregnancy (n; %) 15 (25.9) 411 (30.3) 48 (25.8) 0.364
Drug use during pregnancy (n; %) 4 (6.9) 154 (11.4) 18 (9.7) 0.469
Nulliparous (n; %) 25 (43.1) 471 (34.8) 62 (33.3) 0.381
Diabetes (n; %)
Pregestational 1 (1.7) 19 (1.4) 4 (2.2) 0.550
Gestational 3 (5.2) 39 (2.9) 12 (6.5) 0.030
Any 4 (6.9) 58 (4.3) 16 (8.6) 0.027
Previous preterm birth (n; %) 14 (24.1) 391 (28.9) 48 (25.8) 0.530
compared with former-AGA children (aOR, 0.74; 95% CI, 0.35– 1.55;p¼0.425),►Table 5. Male gender was associated with worse outcomes both during the initial neonatal period and at age 2 (►Tables 4and5).
Finally, we compared the median birthweight in kilograms (kg) and at each childhood follow-up visit, stratified by birthweight group. Children’s weights were recorded at the three prespecified follow-up visits and the timing of the follow-up visits did not vary by birthweight group (median of 6, 13 and 25 mo), corrected for prematurity. At each follow-up visit, the former-SGA children remained significantly lighter than their former-AGA counterparts, who in turn were significantly lighter than the former-LGA children (p<0.001 for all time points studied,►Fig. 2).
Comment
In this large, prospectively collected cohort of women with pregnancies complicated by PPROM, we found that infant birthweight classification is associated with both adverse initial neonatal outcomes and adverse childhood neurodeve-lopmental outcomes at age 2. These differences appeared most significant for those SGA at delivery, as adverse out-comes persisted to early childhood. The apparent advantage conferred shortly after birth to LGA infants appeared to be short-lived, as neurodevelopmental outcomes were similar between former-LGA and former-AGA children when they were evaluated at age 2.
These findings are consistent with limited previous re-ports examining the effect of birthweight on preterm mor-bidity and mortality, particularly among neonates with an antenatal diagnosis of intrauterine fetal growth restriction. Multiple prior studies have demonstrated adverse effects of intrauterine fetal growth restriction (diagnosed antenatally) on initial childhood outcomes as well as neurodevelopmental impairment.16–18However, the majority of prior studies have focused specifically on antenatal growth restriction and US parameters, and have used this information for decision making.19,20 This cohort, where PPROM was the obstetric diagnosis for all women studied, likely represents a different population, given different underlying pathophysiology con-tributing to premature membrane rupture, and provides valuable information regarding anticipated postnatal out-comes among babies delivered following this complication.
Furthermore, we report information on infants that were LGA at delivery. Although these infants experienced lower morbidity in the neonatal period, this benefit was transient, as they experienced similar neurodevelopmental outcomes at age 2 to former-AGA children. We hypothesize that LGA infants might have improved outcomes due to reduced need for transfusion, and also reduced temperature instabili-ty, known risk factors for neonatal morbidity.21,22 Unfortu-nately, our study design does not permit us to answer these mechanistic questions directly. For all groups, size at birth was highly correlated with weight across multiple follow-up visits through 2 years of age. The longer term (e.g., adult)
Table 2 Current pregnancy and intrapartum characteristics, stratified by birthweight group
Characteristic Small for
gestational age N¼58
Appropriate for gestational age N¼1,354
Large for gestational age N¼186
p-value
Pregnancy dating criteria
Mean gestational age atfirst ultrasound (wk;SD) 18.86.8 18.27.2 18.88.6 0.537
First ultrasound was prior to 14 wk gestation (n; %) 15 (25.9) 414 (30.6) 65 (35.0) 0.336
Patient had a missing last menstrual period date (n; %) 5 (8.6) 122 (9.0) 20 (10.8) 0.734
Patient reported a“sure”last menstrual period date (n; %) 36 (62.1) 792 (58.5) 107 (57.5) 0.828
Mean gestational age at PPROM (wk;SD) 26.93.1 28.02.5 28.42.4 0.005
Randomized to receive magnesium sulfate (n; %) 29 (50) 670 (49.5) 80 (43.0) 0.253
Received antenatal antibiotics (n; %) 58 (100) 1,308 (96.6) 180 (96.8) 0.361
Received antenatal corticosteroids (n; %) 57 (98.3) 1,322 (97.6) 181 (97.3) 0.912
Latency between PPROM and delivery (d; median, IQR) 6.4 (3.8–13.1) 6.9 (3.3–14.1) 6.6 (2.6–15.1) 0.915
Chorioamnionitis (n; %) 8 (13.8) 174 (12.9) 26 (14.0) 0.898
Preeclampsia (n; %) 1 (1.7) 8 (0.6) 1 (0.5) 0.386
Meconium stained amnioticfluid (n; %) 3 (5.2) 31 (2.3) 3 (1.6) 0.261
Cesarean delivery (n; %) 31 (53.5) 510 (37.7) 56 (30.1) 0.005
Cesarean delivery for fetal intolerance of labor (n; %) 14/31 (45.2) 218/510 (42.8) 14/56 (25) 0.034
Cesarean delivery for malpresentation (n; %) 17/31 (54.8) 251/510 (49.2) 31/56 (55.4) 0.589
Mean gestational age at delivery (wk;SD) 28.33.1 29.52.6 29.92.4 0.004
implications of LGA and SGA birthweight for gestational age growth patterns is unknown.
In this population, traditional risk factors for aberrant fetal growth were uncommon; for example, use of tobacco and illicit drugs was low and did not vary by birthweight group. Pre-eclampsia was also uncommon. Previous studies exam-ining the rate of fetal growth following PPROM or after the onset of spontaneous preterm labor have noted reduced growth velocity, suggesting that slowing of fetal growth may participate in the mechanism of preterm labor.23,24 Significant placental lesions (e.g., syncytiotrophoblast
knot-ting, villous fibrosis, avascular terminal villi, accelerated villous maturation) have been associated with abnormal fetal growth in the setting of preterm delivery, supporting the theory that the development of these complications may be a chronic process.25,26
Ourfinding of a greater proportion (11.6%) of LGA com-pared with SGA infants (3.6%) is of uncertain significance, and warrants further investigation in other cohorts. The rate of SGA is uncommonly reported following PPROM, but the incidence in our population was similar to that reported in a large cohort (n¼4,102) of women delivering<32 weeks,
Table 3 Neonatal outcomes, stratified by birthweight group
Characteristic Small for
gestational age N¼58
Appropriate for gestational age N¼1,354
Large for gestational age N¼186
p-value
Male fetus (n; %) 35 (60.3) 726 (53.6) 90 (48.4) 0.222
Median birthweight (kg; IQR) 0.73 (0.57–1.13) 1.35 (0.99–1.67) 1.79 (1.35–2.10) <0.001
5-min Apgar score<7 (n; %) 17 (29.3) 252 (18.6) 25 (13.5) 0.023
Birth head circumference<10% for gestational age (n; %)
31 (56.4) 96 (7.2) 1 (0.6) <0.001
Birth length<10% for gestational age (n; %) 27 (47.4) 65 (4.8) 1 (0.6) <0.001
Composite major neonatal morbidity (n; %) 32 (55.2) 426 (31.5) 34 (18.3) <0.001
Death prior to initial hospital discharge (n;%) 10 (17.9) 63 (4.7) 4 (2.2) <0.001
Necrotizing enterocolitis, stage II or III (n; %) 0 (0) 66 (4.9) 4 (2.2) 0.055
Bronchopulmonary dysplasia (n; %) 17 (30.4) 233 (17.3) 15 (8.2) <0.001
Confirmed neonatal sepsis (n; %) 14 (25.0) 222 (16.5) 15 (8.2) 0.002
Intraventricular hemorrhage, grade III or IV (n; %) 1 (1.9) 21 (1.6) 3 (1.7) 0.981
Periventricular leukomalacia (n; %) 1 (1.9) 21 (1.6) 3 (1.7) 0.981
Composite major childhood morbidity (n; %) 15 (25.9) 112 (8.3) 11 (5.9) <0.001
Stillbirth or infant death (n; %) 14 (24.6) 92 (7.1) 8 (4.4) <0.001
Moderate or severe cerebral palsy at age 2a 1/43 (1.8) 21/1,201 (1.6) 3/172 (1.7) 0.790
Bayley MDI score>2 SD below the meana 10/41 (24.4) 185/1,096 (16.9) 16/155 (10.3) 0.043
Bayley PDI score>2 SD below the meana 4/41 (9.8) 166/1,102 (15.1) 19/157 (12.1) 0.417
Abbreviations: IQR, interquartile range; MDI, mental development index; PDI, psychomotor development index; SD, standard deviation. aAmong the 43 small for gestational age, 1,201 appropriate for gestational age, and 172 large for gestational age children surviving to age 2. Not all
assessments were completed for each child; numerator for each parameter reflects number of living children with available data.
Table 4 Multivariate logistic regression model for major neonatal morbidity
Characteristic OR 95% CI p-value
Delivery gestational age (per 1 wk interval) 0.50 0.47–0.54 <0.001
Male infant 1.52 1.15–2.00 0.003
Maternal education (per y completed) 1.05 0.99–1.11 0.073
Infant size at delivery
Small for gestational age 2.11 0.98–4.56 0.057
Appropriate for gestational age 1.00 Ref Ref
Large for gestational age 0.44 0.28–0.71 0.001
Abbreviations: CI, confidence interval; OR, odds ratio; Ref, reference group.
where 4.7% delivered after PPROM were SGA.27A phenotype of rapid fetal growth prior to the occurrence of late preterm birth has been described; we speculate that perhaps this may have contributed to the lower rate of SGA and the higher rate of LGA even though this cohort was primarily earlier pre-term.28Further mechanistic investigations are needed, and placental pathology information will be crucial to unraveling underlying etiologies of growth disturbances in these fetuses. Our study has several strengths. This is a large, well-defined cohort of women with PPROM, diagnosed in a standardized fashion. Given that the original study was not focused on fetal growth per se, women were not excluded due to suspected normal or abnormal fetal growth, and we had the distinct advantage of being able to evaluate the impact of SGA and LGA
from within the same cohort. Neonatal and childhood out-comes were also standardized and were rigorously prospec-tively assessed by trained research staff. We had detailed pregnancy dating information available, reducing the likeli-hood that infants were misclassified as SGA or LGA due to incorrect pregnancy dating. Furthermore, incorporation of early childhood outcomes at age 2 allowed for more compre-hensive assessment regarding the impact of size on outcomes. Our analysis is not without limitation. As with all second-ary analyses, we were limited to the data previously collected as part of the main trial. We did not have information regarding placental pathology, and had minimal details re-garding US assessments following PPROM. We also had very limited data regarding estimated fetal weight or amniotic
fluid index (AFI) by US following PPROM, and therefore, are unable to examine outcomes based on individual biometric parameters (e.g., abdominal circumference or AFI) or evaluate how various Doppler indices may impact outcomes. The study design did not permit us to examine the mechanism by which SGA contributes to adverse outcomes. Additionally, we were limited by the relatively small number of infants with SGA.
In conclusion, among infants delivered following PPROM, neonatal outcomes were inversely related to size at delivery, with fewer LGA infants experiencing early morbidity compared with AGA and SGA infants. At age 2, former-SGA children had continued adverse effects, with significantly worse neurodeve-lopmental outcomes compared with AGA and former-LGA children. However, the apparent benefit of LGA that was seen during the neonatal period was no longer appreciated in early childhood. These data have implications for counseling patients; future studies should confirm these results and inves-tigate potential mechanisms behind thesefindings.
Note
This study was presented, in part, in poster format at the 34th annual meeting of the Society for Maternal-Fetal Medicine, New Orleans, LA, February 3 to 8, 2014.
Funding
This study was funded by the NICHD 5K23HD067224 (Dr. Manuck).
Conflict of Interest
None.
Acknowledgments
The authors thank the Eunice Kennedy Shriver National Institute of Child Health and Human Development, the Maternal-Fetal Medicine Units Network, and the Protocol Subcommittee for making this database publically avail-able. The contents of this report represent the views of the authors and do not represent the views of the Eunice Kennedy Shriver National Institute of Child Health and Human Development Maternal-Fetal Medicine Units Net-work or the National Institutes of Health.
Table 5 Multivariate logistic regression model for major
childhood morbidity at age 2
Characteristic OR 95% CI p-value
Male child 1.63 1.08–2.47 0.021
Delivery gestational age (per 1 wk interval)
0.63 0.57–0.69 <0.001
Prepregnancy maternal body mass index
(per 1 unit increase)
1.02 0.99–1.05 0.150
Infant size at delivery
Small for gestational age 2.63 1.27–5.45 0.009
Appropriate for gestational age
1.00 Ref Ref
Large for gestational age 0.74 0.35–1.55 0.425
Abbreviations: CI, confidence interval; OR, odds ratio; Ref, reference group. Note: Other factors considered in initial model but removed fromfinal models due top>0.20 included randomization to magnesium sulfate, maternal education level, maternal smoking, and maternal diabetes mellitus.
References
1 Mercer BM. Preterm premature rupture of the membranes: cur-rent approaches to evaluation and management. Obstet Gynecol Clin North Am 2005;32(3):411–428
2 Ananth CV, Oyelese Y, Srinivas N, Yeo L, Vintzileos AM. Preterm premature rupture of membranes, intrauterine infection, and oligohydramnios: risk factors for placental abruption. Obstet Gynecol 2004;104(1):71–77
3 Garite TJ, Freeman RK. Chorioamnionitis in the preterm gestation. Obstet Gynecol 1982;59(5):539–545
4 Mercer BM, Miodovnik M, Thurnau GR, et al; National Institute of Child Health and Human Development Maternal-Fetal Medicine Units Network. Antibiotic therapy for reduction of infant morbid-ity after preterm premature rupture of the membranes. A ran-domized controlled trial. JAMA 1997;278(12):989–995
5 Practice bulletins No. 139: premature rupture of membranes. Obstet Gynecol 2013;122(4):918–930
6 Roberts D, Dalziel S. Antenatal corticosteroids for accelerating fetal lung maturation for women at risk of preterm birth. Cochrane Database Syst Rev 2006;(3):CD004454
7 Stoll BJ, Hansen NI, Bell EF, et al; Eunice Kennedy Shriver National Institute of Child Health and Human Development Neonatal Research Network. Neonatal outcomes of extremely preterm infants from the NICHD Neonatal Research Network. Pediatrics 2010;126(3):443–456
8 Eichenwald EC, Stark AR. Management and outcomes of very low birth weight. N Engl J Med 2008;358(16):1700–1711
9 Tyson JE, Parikh NA, Langer J, Green C, Higgins RD; National Institute of Child Health and Human Development Neonatal Research Network. Intensive care for extreme prematurity— mov-ing beyond gestational age. N Engl J Med 2008;358(16): 1672–1681
10 Raju TN, Mercer BM, Burchfield DJ, Joseph GF Jr. Periviable birth: executive summary of a joint workshop by the Eunice Kennedy Shriver National Institute of Child Health and Human Develop-ment, Society for Maternal-Fetal Medicine, American Academy of Pediatrics, and American College of Obstetricians and Gynecolo-gists. Am J Obstet Gynecol 2014;210(5):406–417
11 Rysavy MA, Li L, Bell EF, et al; Eunice Kennedy Shriver National Institute of Child Health and Human Development Neonatal Research Network. Between-hospital variation in treatment and outcomes in extremely preterm infants. N Engl J Med 2015; 372(19):1801–1811
12 Rouse DJ, Hirtz DG, Thom E, et al; Eunice Kennedy Shriver NICHD Maternal-Fetal Medicine Units Network. A randomized, controlled trial of magnesium sulfate for the prevention of cerebral palsy. N Engl J Med 2008;359(9):895–905
13 Carey JC, Klebanoff MA, Hauth JC, et al; National Institute of Child Health and Human Development Network of Maternal-Fetal Med-icine Units. Metronidazole to prevent preterm delivery in preg-nant women with asymptomatic bacterial vaginosis. N Engl J Med 2000;342(8):534–540
14 Olsen IE, Groveman SA, Lawson ML, Clark RH, Zemel BS. New intrauterine growth curves based on United States data. Pediatrics 2010;125(2):e214–e224
15 Cuzick J. A Wilcoxon-type test for trend. Stat Med 1985;4(1):87–90 16 Murray E, Fernandes M, Fazel M, Kennedy SH, Villar J, Stein A. Differential effect of intrauterine growth restriction on childhood neurodevelopment: a systematic review. BJOG 2015;122(8): 1062–1072
17 Levine TA, Grunau RE, McAuliffe FM, Pinnamaneni R, Foran A, Alderdice FA. Early childhood neurodevelopment after intrauter-ine growth restriction: a systematic review. Pediatrics 2015; 135(1):126–141
18 von Beckerath AK, Kollmann M, Rotky-Fast C, Karpf E, Lang U, Klaritsch P. Perinatal complications and long-term neurodevelop-mental outcome of infants with intrauterine growth restriction. Am J Obstet Gynecol 2013;208(2):130.e1–130.e6
19 García B, Llurba E, Valle L, et al. Do knowledge of uterine artery resistance in the second trimester and targeted surveillance improve maternal and perinatal outcome? UTOPIA study: a randomized controlled trial. Ultrasound Obstet Gynecol 2016;47(6):680–689 20 Gomez-Roig MD, Mazarico E, Sabria J, Parra J, Oton L, Vela A. Use of
placental growth factor and uterine artery doppler pulsatility index in pregnancies involving intrauterine fetal growth restric-tion or preeclampsia to predict perinatal outcomes. Gynecol Obstet Invest 2015;80(2):99–105
21 Buetow KC, Klein SW. Effect of Maintenance of“Normal”Skin Temperature on Survival of Infants of Low Birth Weight. Pediatrics 1964;34:163–170
22 Day RL, Caliguiri L, Kamenski C, Ehrlich F. Body Temperature and Survival of Premature Infants. Pediatrics 1964;34:171–181 23 Bukowski R, Gahn D, Denning J, Saade G. Impairment of growth in
fetuses destined to deliver preterm. Am J Obstet Gynecol 2001; 185(2):463–467
24 Hediger ML, Scholl TO, Schall JI, Miller LW, Fischer RL. Fetal growth and the etiology of preterm delivery. Obstet Gynecol 1995;85(2): 175–182
25 Morgan TK, Tolosa JE, Mele L, et al; Eunice Kennedy Shriver National Institute of Child Health and Human Development Maternal-Fetal Medicine Units Network. Placental villous hyper-maturation is associated with idiopathic preterm birth. J Matern Fetal Neonatal Med 2013;26(7):647–653
26 Salafia CM, Minior VK, Pezzullo JC, Popek EJ, Rosenkrantz TS, Vintzileos AM. Intrauterine growth restriction in infants of less than thirty-two weeks’gestation: associated placental pathologic features. Am J Obstet Gynecol 1995;173(4):1049–1057
27 Hanke K, Hartz A, Manz M, et al; German Neonatal Network (GNN). Preterm prelabor rupture of membranes and outcome of very-low-birth-weight infants in the German Neonatal Network. PLoS ONE 2015;10(4):e0122564