Comparing modern methods of active & collaborative learning & learner-centered teaching to traditional lectures
284
0
0
Full text
(2) Comparing Modern Methods of Active & Collaborative Learning & Learner-Centered Teaching to Traditional Lectures. Michael C. LoPresto A thesis submitted for the degree Doctor of Philosophy at the Centre for Astronomy James Cook University. 2012. 1.
(3) Statements & Acknowledgements Statement of Access I, the undersigned, author of this work, understand that James Cook University will make this thesis available for use within the University Library and, via the Australian Digital Theses network, for use elsewhere. I understand that, as an unpublished work, a thesis has significant protection under the Copyright Act and; I do not wish to place any further restriction on access to this work.. 2.
(4) Statement of Sources. DECLARATION I declare that this thesis is my own work and has not been submitted in any form for another degree or diploma at any university or other institution of tertiary education. Information derived from the published or unpublished work of others has been acknowledged in the text and a list of references is given.. 3.
(5) Statement of Previous Publication & Presentation This thesis describes work carried out for the Centre for Astronomy at James Cook University, Townsville, Australia. As an Internet-based international student, I have never been on the Townsville campus but have done all of my work at Henry Ford Community College (HFCC) in Dearborn, Michigan where I am a full-time instructor of Physics & Astronomy. All work was undertaken while I was enrolled at James Cook University under the direction of my advisor Dr. Carlton R. Pennypacker. All work presented in this thesis is my own. Slightly modified versions, research done specifically for this thesis, have appeared as the following published papers, all of which I am the first author, and were given in the following presentations; Chapter 4: “An Astronomical Misconceptions Survey” with Steven R. Murrell, Journal of College Science Teaching; Volume 40, Number 5 (2011); presented at American Association of Physics Teachers Michigan Section Meeting, Hope College, Spring 2010; Contributed Poster, Astronomical Society of the Pacific, Cosmos 2010, Boulder Colorado, Summer 2010. Chapter 7: “Using the Star Properties Concept Inventory to Compare Instruction with Lecture-Tutorials to Traditional Lectures” with Steven R. Murrell, Astronomy Education Review; Volume 8 Issue 1 (2009); presented at American Association of Physics Teachers Michigan Section Meeting, Michigan State University, Spring 2009. Chapter 8 “Assessment of a Solar-System Walk “ with Steven R. Murrell and Brian Kirchner, The Physics Teacher, April 2010; presented at American Association of Physics Teachers Michigan Section Meeting, Michigan State University, Spring 2009. Chapter 9: ”A Comparative Planetology Activity” The Physics Teacher, May 2010, with Steven R. Murrell; presented at American Association of Physics Teachers, National Meeting Chicago, Illinois, Winter 2009, Michigan Section Meeting, Michigan State University, Spring 2009. 4.
(6) Chapters 10 & 11: “Using Visual Assessments and Tutorials to teach Solar System Concepts in Introductory Astronomy” Astronomy Education Review, (9) 1 (2010); Contributed Poster, American Association of Physics Teachers, National Meeting, Ann Arbor Michigan, Summer 2009; presented at Hands on Universe Conference, Yerkes Observatory, Summer 2009 Chapters 12 &13: “Comparing a Lecture to a Tutorial”, Physics Education, February 2010; Contributed Poster, American Association of Physics Teachers, National Meeting, Ann Arbor Michigan, Summer 2009; presentation at Hands on Universe Conference, Yerkes Observatory, Summer 2009 Michael C. LoPresto Saline, Michigan. 5.
(7) Acknowledgements Sometime during 2007 I was making my monthly perusal of Astronomy Magazine and I noticed the advertisement for James Cook University’s online programs in astronomy. I had seen them many times before, except this was the first time that I had noticed that it included “Doctoral Degrees.” Ever since I had turned 40 years of age in 2005 I had been considering that after 15+ years of teaching physics and astronomy that it was time to undertake a doctorate. My main hurdle was that even if I did not have a family to provide for, I was not interested in leaving my job for an extended period of time. After investigating the link Doctorate Program on the James Cook University Centre for Astronomy website, I emailed Program Director, Dr. Andrew Walsh and asked, since teaching introductory astronomy was a large part of what I do in my position at Henry Ford Community College (HFCC), if it would be possible to do a doctoral thesis focusing on astronomy education. He very quickly responded by putting me in touch with Dr. Carl Pennypacker of the Space Sciences Lab at the University of California-Berkley as a potential advisor. After exchanging a number of emails, Carl and I decided on a proposal for a project and very soon I was applying for admission to the program for the fall of 2008. I thank Dr. Andrew Walsh for being initially receptive to my program focusing on astronomy education and his guidance as director throughout the program. I also, of course, thank my advisor, Dr. Carl Pennypacker, for all his encouragement of and enthusiasm for my project. I also thank him for the invitation to the Hands On Universe (HOU) conference that he organizes at Yerkes Observatory to present my early work and meet him in person. Thanks also go to recent JCU Doctor of Astronomy graduate, Dr. Patrick Miller of Hardin-Simmons University, whom I met at HOU, for his encouragement and the use of his thesis as an example of proper formatting.. 6.
(8) I thank my colleague, fellow instructor of Physics & Astronomy at HFCC and friend, Steven R. Murrell for his participation in the project. Without his willingness to teach his students with the instructional materials I was developing and implement the numerous assessments, this project would not have been possible. His input through many informal discussions about the project and the material was also extremely valuable. This has also been true of HFCC-adjunct astronomy instructor James Marks, I thank him and also Eric Rasmussen, Carrie Zaitz and Roxanne Crabill for similar participation and of course the literally hundreds of HFCC introductory astronomy students that participated in different parts of the project throughout its duration. Also at HFCC, I thank the members of the 2009 Sabbatical Committee who saw fit to grant my request for my first ever sabbatical-leave from HFCC at the end of my 20th year of teaching there to begin writing this dissertation. I also thank HFCC President, Dr. Gail Mee for approving my sabbatical and I thank the architects of our AFT-LOCAL 1650 contract and those who approved it for financial support of this project. I spent my Winter 2010 sabbatical writing the initial drafts of my thesis as a Visiting Researcher in the Astronomy Department at the University of Michigan in Ann Arbor. I thank the chairman, faculty and staff of the department for making me feel welcome during my stay in what I have always felt to be an academically inspiring environment and especially Professors Fred Adams and Don Bord for sponsoring the request for my visit. Special thanks to Don Bord, Professor at both the Ann Arbor and Dearborn Campuses of the University of Michigan, for recommending me to the JCU Doctoral Program, letting me use his Ann Arbor office during my sabbatical and including me in the NSF-Funded Telescope Project at UM-Dearborn. The experience I gained from that project was “instrumental” in my being granted advanced standing for AS5012-Astronomical Instrumentation at JCU.. 7.
(9) I also received advanced standing in AS5011-Modern Astrophysics at JCU, in no small part due to the astrophysics courses I took from Dr. Charles Cowley as part of the MS degree I earned from the University of Michigan in 1989, thanks Chuck! I also thank Dr. Alexandra Oakes of Eastern Michigan University (EMU) in Ypsilanti, MI, for the Research Master’s Thesis I did with her at EMU in 1996 that also helped fill the requirements for admission to JCU’s doctoral program. Astronomy Education Research colleagues I need to thank are Dr. Tim Slater, Excellence in Higher Education Endowed Chair in Science Education at the University of Wyoming for recommending me to the JCU Doctoral Program and initially getting me interested in active and collaborative learning and learner-centered teaching. Tim also did a detailed review of this work after its initial submission. His suggestions prompted me to rethink both individual parts of my thesis and the big picture, both of which made it a better work. I thank him and Dr. Nick Lomb for being willing to take on this arduous task for me. I also thank Gina Brissenden and Dr. Ed Prather of the NASA/JPL Center for Astronomy Education (CAE) at the University of Arizona since 2007 for also being instrumental in my initial interest in active and collaborative learning and learner-centered teaching and for including me in a Collaboration of Astronomy Teaching Scholars (CATS) and this project as part of the CATS project, Solar System Concept Inventory (SSCI) & Solar System Lecture-Tutorials Project which included financial support for the project. Thanks for financial support also goes Pearson Higher Education, publishers of the Astronomy Media Workbook (LoPresto, 2011) and Kendall-Hunt Publishing Company, publisher of Fundamental of College Astronomy (LoPresto, 2011, 2012), where several of the activities developed for this work have been published.. 8.
(10) Last and certainly not least, I thank members of my family. My mother, Mel LoPresto for loaning me the “start-up” funds for the program, my father Dr. James C. LoPresto, for funds that helped me finish. I also thank my maternal grandmother, Dr. Nellie Juskenas, at the age of 93 years at the time of this writing and to whom this work is dedicated for all the support she has given my family and I over the years. Finally and mostly, I thank my lovely wife of 23 years, Jan, and my children, Sarah, Emily and Sam for always keeping me grounded in what is really important in life.. 9.
(11) 10.
(12) Preface This work originated in the summer of 2000 after the Cosmos in the Classroom Symposium, sponsored by the Astronomical Society of the Pacific in Pasadena, California. There, through a series of workshops, I was introduced to “Active and Collaborative” learning and was engaged in discussions with some of the pioneers of its use in introductory astronomy, among them, Tim Slater, Gina Brissenden, Andrew Fraknoi, Doug Duncan, Beth Hufnagel and others. By that time, I had already been teaching introductory astronomy at Henry Ford Community College (HFCC) in Dearborn, Michigan for 10 years. The endeavor was becoming increasingly unrewarding as it became clear to me, mostly through the lack of student participation and test results that the traditional course, that amounted to a slide/transparency show with accompanying lectures was, in some fundamental way, not working. I wanted to move college astronomy beyond this with the hope that students might actually learn something conceptually significant, with real science behind it. Upon my return to teaching in the fall of 2000, I began trying activities, some that had been shared with me by my new colleagues from Cosmos in the Classroom, others I developed myself, in my classes. I also had the good fortune in the spring of 2001 to be invited through a grant to team-teach an introductory Earth Science course that was part of a new science-education curriculum at HFCC’s neighbor, the University of MichiganDearborn, that was based on active and collaborative learning techniques. Soon, I was “hooked.” I had “bought-in” to these techniques, began attending more workshops and building a repertoire of inquiry-based collaborative activities, developed by others and myself. I considered myself a “disciple” of the Cognition in Astronomy & Physics Education Research (CAPER) team (see CAPER, http://www.caperteam.com) a pioneering group in astronomy education research.. Before long I began giving. workshops myself on these teaching methods and became interested in how to assess their effectiveness. I began developing and reporting on results of rudimentary 11.
(13) assessment instruments during presentations at these workshops and other professional meetings. During the winter of 2007, HFCC hosted a NASA/JPL Center for Astronomy Education (NASA/JPL CAE, http://astronomy101.jpl.nasa.gov/) Teaching Excellence Workshop (see http://astronomy101.jpl.nasa.gov/workshops/) given by Gina Brissenden and Edward Prather. That workshop served a dual purpose, also becoming the inaugural meeting of the CAE-Great Lakes Regional Teaching Exchange where I was designated as CAEGLRTE. coordinator. (CAE. Teaching. Strategies. http://astronomy101.jpl.nasa.gov/teachingstrategies/). The point was first made at that workshop/meeting that, of the resources available for use in teaching introductory astronomy in an active and collaborative fashion, chief among them a manual of activities Lecture-Tutorials for Introductory Astronomy (Prather et al., 2007) there existed many tutorials on celestial motions (motions of the stars, the sun and the moon) and also light, spectra and stars but not as many as on topics in cosmology and the solar system. It was suggested that I might consider taking an active roll in the development of some of these activities. During the 2007-2008 holiday break was when I first made contact with the James Cook University Centre for Astronomy (http://www.jcu.edu.au/school/mathphys/astronomy/) to explore the possibility of doing a Doctorate in Astronomy with research focused on astronomy education. Program Director, Dr. Andrew Walsh of the JCU Centre for Astronomy put me in touch with Dr. Carl Pennypacker of the Space Sciences Lab at the University of California-Berkley as my advisor. During the winter and spring of 2008, Dr. Pennypacker and I developed a proposal that became this project on the development and testing of active and collaborative learning materials focusing on solar system concepts through which we would also test the methods themselves. I officially enrolled in the program at the JCU Centre for Astronomy in the fall of 2008.. 12.
(14) Since that time this project has also become part of a CAE –Collaboration of Astronomy Teaching. Scholars. (CATS). Project. (CAE-CATS. Projects,. http://astronomy101.jpl.nasa.gov/cats/projects/) the Solar System Concept Inventory (SSCI) & Solar System Lecture Tutorials Project for which I am one of the collaborators. (CAE-CATS, http://astronomy101.jpl.nasa.gov/cats/collaborators/). 13.
(15) 14.
(16) Abstract The main goals of this project are; to develop and assess the effectiveness of learnercentered activities for introductory astronomy that focus on solar system topics and; to test the methods of learner-centered instruction themselves through the implementation of these activities and their assessments.. The intended end of the project is to have. developed entire solar system “unit” consisting of learner-centered activities on solar system topics that have been tested for their effectiveness Since 2000, many resources for active and collaborative learning in introductory astronomy have been developed. This is especially true for two of the four the main sections of a traditional introductory college astronomy course, the observed motions in the sky and light, the Sun and stars. There is currently considered to be a dearth of activities pertaining specifically to solar system topics, also considered one of the four main sections of a traditional course. For instance, the leading Lecture-Tutorial (LT) workbook (Prather et al., 2007) has 38 LTs, 14 of them, 37% are about topics related to the observed motions in the sky and 16, 42% are topics related to light, the Sun and stars. Of the remaining 8, only 4, 11%, are about topics traditionally covered in a solar system unit, one each on the Earth’s surface, the formation of the solar system, the size and scale of solar system objects and extra solar planets. There are tutorials on planetary motion and gravity, but these are topics generally covered in the earlier motions and history unit. The last 4 LTs are about galaxies and cosmology. Research investigating student pre-instruction beliefs and reasoning difficulties in cosmology, considered the fourth main section of a traditional astronomy course, is also underway as is the development and assessment of instructional materials. (CATS projects/ Research on Students Beliefs and Reasoning Difficulties related to Cosmology http://astronomy101.jpl.nasa.gov/cats/projects/). 15.
(17) Another reason for development of more material covering solar system topics is for research to better understand student learning in these areas. An assessment instrument the Solar System Concepts Inventory, SSCI that is under development and preliminary testing will eventually be used for this purpose. The availability of more material to assess will aid in the validation of the survey and then the survey itself will in turn aid in the development of even more new materials. (CATS projects / Solar System Concept Inventory. (SSCI). &. Solar. System. http://astronomy101.jpl.nasa.gov/cats/projects/). Lecture-Tutorials. Project,. Assessment instruments on light and. spectra, the Light and Spectroscopy Inventory, LSCI (Bardar et al., 2007), and stellar topics, the Star Properties Concept Inventory, SPCI (Bailey, 2008), already exist and have been field tested (Bardar, 2008), used in research (Prather et al., 2008, Prather et al. 2009), and used to test instruction materials (Barder & Brecher 2008, LoPresto & Murrell, 2009) as does a good amount of instructional material on these topics. (Prather et al., 2007). Assessment instruments on cosmology are also under development. (Wallace et al., 2011) The activities developed, implemented and assessed for this project, in the order that they were assigned during a solar system unit, are; 1-The HFCC Solar System Walk 2-Comparative Planetology 3-Formation of the Solar System 4-Extra-Solar Planets 5-Comets 6-Surface Conditions of Terrestrial Planets 1-Planetary Geology 2-Planetary Atmospheres. 16.
(18) A pilot research project that was designed and undertaken to test the viability of this project consisted of using active and collaborative instructional materials that were already in existence on other topics and testing them with an already existing and established assessment instrument. Based on the number of Lecture-Tutorials (LTs) available on the subjects of light, the Sun and stars (Prather et al., 2007) and the existence of an already established concept inventory, the Star Properties Concept Inventory (SPCI) (Bailey, 2008), light, the Sun and stars, usually the third “unit’ of a general education introductory astronomy course, was chosen. The experimental design of the different studies in this project is similar to that of the pilot project. In general, students were given pretest and posttest assessments so gains in groups receiving different methods of instruction could be compared. The scores of students who did the activities were compared to students that did not do the activities and were rather taught the same topics through more traditional lectures. The assessment instrument used was the Solar System Survey, 25-item multiple-choice items on solar system topics developed and validated for this project to test the instructional materials developed and the instructional methods they employ In efforts to minimize instructor bias and the Hawthorn Effect (Hake, 1998, from Slavin, 1992) different instructors involved in the studies were assigned to teach different sections both by lecture and by learner-centered methods. Also, in the final trials of each study, the author taught none of the sections involved. The statistical significance of results were evaluated in two ways. When the performance of two groups on a set of assessment questions was being compared, the average score of each group and the standard error were calculated. The standard errors were considered the error-bars around each average. The less overlap in the error bars, the more significant the result. If there was no overlap the difference in the average scores of the two groups was considered statistically significant.. 17.
(19) When the results of different groups on specific assessment items were compared the statistical significance of results were evaluated by chi-squared tests with 2 x2 contingency tables. The numbers of students giving correct and incorrect responses in each group were put into 2 x 2 contingency tables that were used to calculate. P-values. The lower the P-value the more significant the result, P=0.05 being considered the maximum value for a significant result.. 18.
(20) Table of Contents Chapter 1-Introduction. 37. 1.1 Statement of Problem. 37. 1.2 General Overview. 37. Chapter 2- How People Learn. 39. 2.1 Introduction. 39. 2.2 Learning Environments and the Principles of How People Learn. 39. 2.3 Learner Centered Environments. 40. 2.4 Knowledge Centered Environments. 41. 2.5 Assessment Centered Environments. 42. 2.6 Community Centered Environments. 43. 2.7 An Example. 44. 2.8 Instructors. 45. Chapter 3-Active & Collaborative Learning 3.1 Introduction. 47. 3.2 Active Learning. 47. 3.3 Collaborative Learning. 48. 3.4 The Role of Content. 49. 3.5 The Role of Assessment. 50. 3.6 The Role of the Instructor. 51. 3.7 Challenges for the Instructor. 52. Chapter 4-How Students Learn Science. 19. 47. 55. 3.1 Introduction. 55. 3.2 Addressing Preconceptions. 55. 3.3 Preconceptions in Astronomy. 56. 3.4 Doing Science. 57. 3.5 Opportunity for Reflection. 57.
(21) 51 Chapter 5-Learner –Centered Teaching in Introductory College Astronomy 59 5.1 Introduction. 59. 5.2 Assessment. 60. 5.3 Classroom Response Systems/”Clickers”. 61. 5.4 Lecture-Tutorials. 62. 5.5 A Final Word. 67. Chapter 6-Overview of the Learner-Centered Solar System Unit. 69. 6.1 Introduction. 69. 6.2 The Course and Solar System Unit. 69. Chapter 7-Pilot Research Project: Using the Star Properties Concept Inventory to Compare Instruction with Lecture-Tutorials to Traditional Lectures 7.1 Introduction. 73. 7.2 The SPCI. 73. 7.3 The “Stars” Unit. 74. 7.4 Method. 75. 7.5 Results. 75. 7.6 The Use of Classroom Response Questions/”Clickers”. 78. 7.7 Teaching to the Test, The Hawthorn Effect and Instructor Bias. 80. 7.8 A Question of Ethics. 81. 7.9 Conclusion of Pilot Project. 82. Chapter 8-A Solar System Walk. 20. 73. 83. 8.1 Introduction. 83. 8.2 A Size and Scale Lecture-Demonstration. 83. 8.3 The Model. 84. 8.4 Assessing the Walk. 87. 8.5 Results. 89.
(22) 8.6 HPL Pedagogy Chapter 9-A Comparative Planetology Activity. 94 99. 9.1 Introduction. 99. 9.2 Analyzing the Data. 99. 9.3 Assessment. 103. 9.4 Another Trial. 107. 9.5 A Third Trial. 110. 9.6 Knowledge Centered Instruction. 114. Chapter 10-Visual Assessments and Tutorials. 115. 10.1 Introduction. 115. 10.2 Visual Assessments and Tutorials. 115. 10.3 Comets (Procedure). 115. 10.4 Comets (Results). 119. 10.5 Visual Tutorials and Assessments used with HPL Pedagogy. 125. 10.6 Another Trial. 129. 10.7 Learning Environments. 131. Chapter 11- A Visual Assessment and Tutorial on Extra Solar Planet Detection 133 11.1. Introduction. 133. 11.2. Extra Solar Planets (Procedure). 133. 11.3. Extra Solar Planets (Results). 137. 11.4. An Online Tutorial. 139. 11.5. HPL Pedagogy. 139. 11.6. Another trial. 142. 11.7. Visual Assessments and Tutorials; Promising Tools for Learner Centered. Teaching of Astronomy. 21. 145.
(23) Chapter 12- Developing, Using and Comparing Lecture- Tutorials to Lectures 12.1 Introduction 12.2 Developing Lecture Tutorials. 147. 12.3 Lecture-Surface Conditions of Terrestrial Planets. 147. 12.4 Listing Important Concepts and Supporting Facts. 155. 12.5 Writing the Questions. 157. 12.6 Comparing Lecture Tutorials with Traditional Lecture. 161. 12.7 Results. 162. 12.8 Employing HPL Pedagogy. 169. Chapter 13-A Lecture-Tutorial on the Formation of the Solar System. 173. 13.1 Introduction. 173. 13.2 The Lecture. 173. 13.3 Listing Important Concepts and Supporting Facts. 176. 13.4 The Lecture-Tutorial. 177. 13.5 Assessing the LT. 178. 13.6 Results. 180. 13.7 Another Trial. 185. Chapter 14-The Solar System Survey. 22. 147 147. 191. 14.1 Introduction. 191. 14.2 Development (Fall 2008). 191. 14.3 Validation (Fall 2008). 196. 14.4 Results (Winter 2009). 196. 14.5 Results (Fall 2009). 200. 14.6 Conclusion. 204.
(24) Chapter 15- Affective Data. 205. 15.1 Introduction. 205. 15.2 A “Student Survey”. 205. 15.3 An “Attitude Survey”. 208. Chapter 16- Conclusions. 213. 16.1 Student Attitudes. 213. 16.2 Assessment of Instructional Materials. 213. 16.3 Knowledge Centered Learning Environments. 214. 16.4 Classroom Responders. 215. 16.5 Formative Assessment. 216. 16.6 HPL Pedagogy. 217. 16.7 The Hawthorn Effect, Instructor Bias and Teaching to the Test. 218. 16.8 Future Plans. 219. Bibliography. 225. Appendices. 235. 23.
(25) 24.
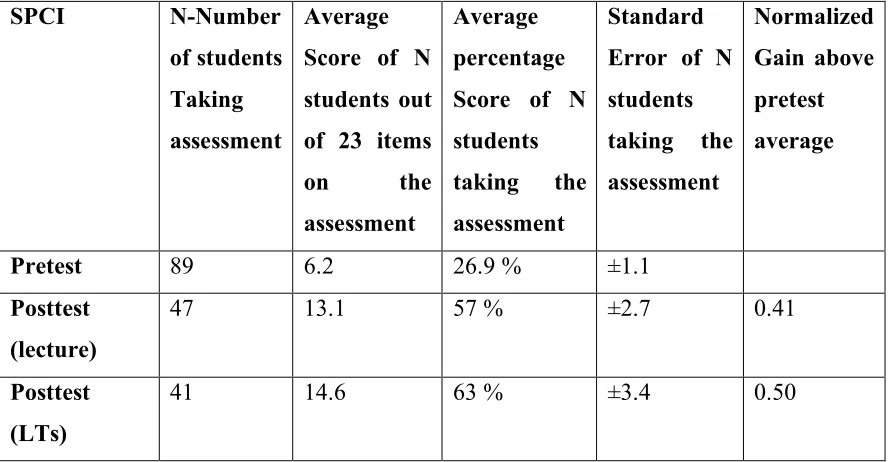
(26) Lists of Tables & Figures List of Tables Table 7.5.1 Fall 2008 SPCI Pretest and Posttest results for sections taught by lecture and LTs. Table 7.6.1 SPCI Pretest and Posttest results for sections taught with LTs, but not clickers. Table 8.5.1 Percentage of correct responses to questions on pre and posttests and normalized gains, Fall 2008. Normalized gain, g=(post. %-pre %)/ (100%-pre%)=actual gain/possible gain. (Hake, 1998) Table 8.5.2 Percentage of correct responses to questions on posttest only for students that were assigned the solar system walk during the Fall 2009 semester. Table 8.6.1 Percentage of correct responses to questions on pre and posttests and normalized gains, Fall 2010. Normalized gain, g=(post. %-pre %)/ (100%-pre%)=actual gain/possible gain. (Hake, 1998) Table 9.2.1 Planetary Data-Note that by this time in the course, students are already familiar with “Earth=1” units for comparing planetary data, including the Astronomical Unit. (Data Source, Bennett et al., 2009) Table 9.3.1 Percentage of correct responses to questions on pre and posttests and normalized gains during Fall 2008 semester. Table 9.4.1 Results for both groups in the Fall 2009 semester. Table 9.5.1 Results for both groups in the Fall 2010 semester.. 25.
(27) Table 10.4.1 Percentages of students drawing the coma and tail size and tail direction correctly on Fig. 10.3.1 before and after instruction by lecture and tutorial. Note that the fourth row is the number of students who’s drawing still showed the head first, tail last misconception, so a decrease in the percentage is the desired result. Table 10.4.2 Percentages of students correctly answering multiple-choice items from the Solar System Survey on comet tail direction and on what part of the comet does not change in size before and after instruction by lecture and tutorial. Table 10.4.3 Comparison of percentages of students drawing the coma and tail size and tail direction correctly on Fig. 10.3.1 in a formative assessment the next class period after instruction to summative assessments in sections taught by lecture and tutorial showing greater retention in the sections taught by tutorial. Table 10.5.1 Percentages of students drawing the coma and tail size and tail direction correctly on Fig. 10.3.1 before and after instruction by lecture only and HPL-pedagogy using the visual-tutorial in the Fall 2009 semester. Percentages of students submitting a drawing like Fig. 10.3.2 showing the common head first, tail last at all points in the orbit misconception are also shown. Table 10.6.1 Percentages of students drawing the coma and tail size and tail direction correctly on Fig. 10.3.1 before and after instruction by lecture and using the visualtutorial in the Fall and Winter 2010 and 2011 semesters. Percentages of students submitting a drawing like Fig. 10.3.2 showing the head first and tail last misconception, so correct responses for this item will show a decrease. Table 11.3.1 Comparison of percentage scores on the extra-solar planets visual assessment shown in Fig. 10.5.1 on diagnostic, formative and summative assessments in sections taught by lecture and tutorial showing greater gains and retention in the sections taught by tutorial.. 26.
(28) Table 11.5.1 Percentages of students correctly identifying all 4 waveforms in item-1 (the front) of the extra solar planets visual assessment, all 3 waveforms in item -2 (the back) and those getting both sides completely correct, before and after instruction by lectureonly and by HPL including visual-tutorial during the Fall 2009 semester. Table 11.6.1 Percentages of students correctly identifying all 4 waveforms in item-1 of the extra solar planets visual assessment, all 3 waveforms in item-2 and those getting both sides completely correct, before and after instruction by lecture and with the visualtutorial during the Fall and Winter 2010 and 2011 semesters. Table 12.5.1 Planetary Atmospheric Data Table 12.5.2 Processes affecting the surface of Terrestrial Planets Table 12.7.1 Pre and Posttest scores and normalized gains (Hake, 1998) for students receiving lectures and doing the LT Surface Conditions of Terrestrial Planets. Note that the standard errors for the average percentage scores barely overlap and those for the average of normalized gains do not at all. Table 12.8.1- Pre and Post-test scores and normalized gains (Hake, 1998) for students instructed by lectures-only and instructed with the LT- Surface Conditions of Terrestrial Planets as part of HPL pedagogy. Table 13.6.1 Pre and Post-test scores and normalized gains (Hake, 1998) for students receiving lectures and doing the LT Formation of the Solar System in Winter 2009. Standard errors in the average % score have a large overlap, while those of the average normalized gain just barely overlap. Table 13.6.2 Pre and Post-test scores and normalized gains (Hake, 1998) for students receiving lectures-only and doing the LT Formation of the Solar System as part of HPLpedagogy in Fall 2009.. 27.
(29) Table 13.7.1 Pre and Post-test scores and normalized gains (Hake, 1998) for students receiving lectures and doing the LT Formation of the Solar System in Fall 2010. There is slight overlap in the standard error of the average % scores, but not in that of the average normalized gain. Table 14.3.1 Student percentages scores on each item of the pretest and posttest in lecture and tutorial sections and normalized gain for the Winter 2009 Solar System Survey. Table 14.4.1 Student percentages scores on each item of the pretest and posttest in lecture-only and HPL-tutorial sections and normalized gain for the Fall 2009 Solar System Survey. Note that this time there in no overlap in standard errors of the % scores and normalized gains. Table 15.3.1 Percentage of students responding to A-E each item of the Student Attitude Survey.. 28.
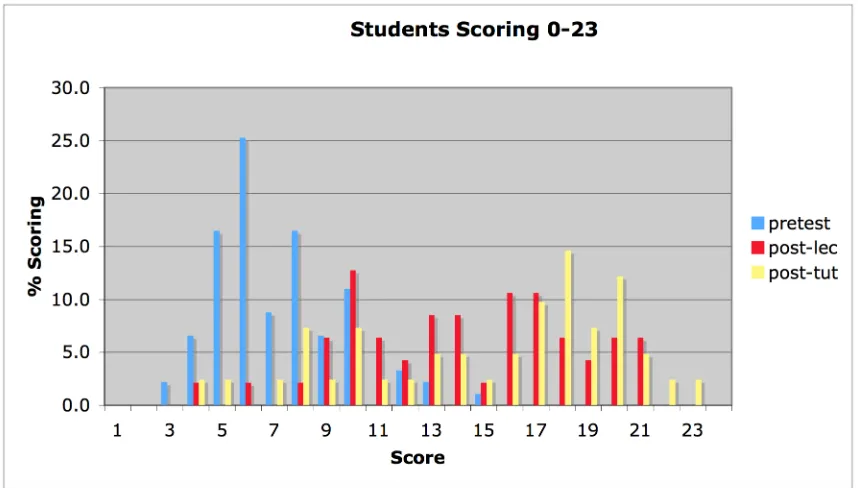
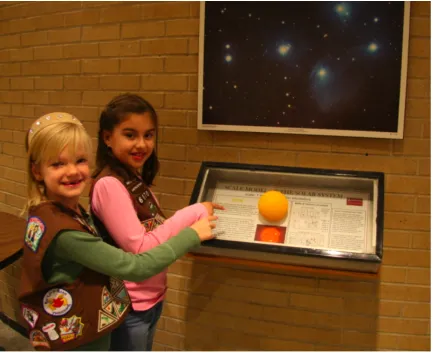
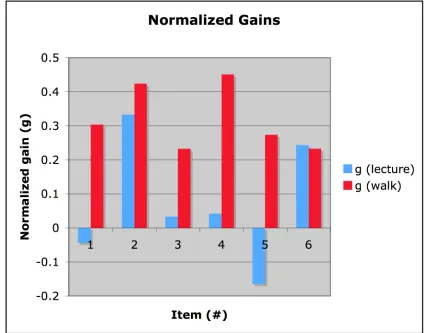
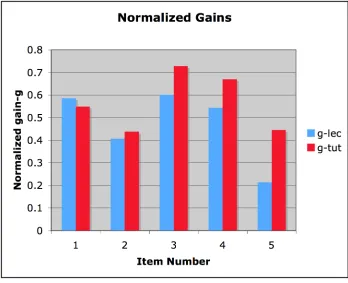
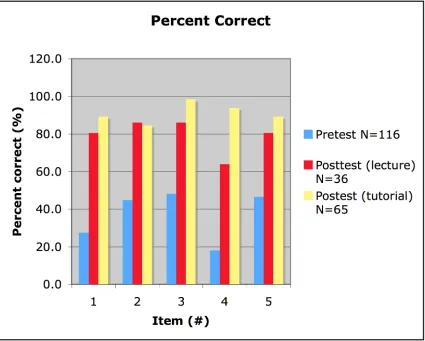
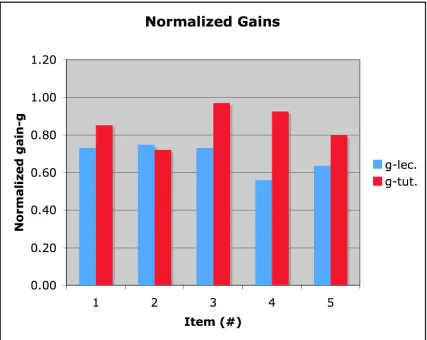
(30) List of Figures Figure 7.5.1 Fall 2008; percentage of students scoring 0-23 on the pretest (blue), the posttest in lecture sections (red) and in tutorial sections (yellow). Figure 7.5.2 Fall 2008; normalized gains, g, for each item on posttest in lecture sections (blue) and tutorial sections (red). Figure 7.5.3 Fall 2008; normalized gains, g, for each item on posttest in lecture sections (blue) and tutorial sections (red). Figure 8.3.1 Overhead view of the positions of objects on campus in the HFCC solar system model. Figure 8.3.2 Information in the Sun’s display case in the HFCC solar system model. Figure 8.3.3 Field-trip visitors inspecting he HFCC solar system model’s Sun display. Figure 8.5.1 Plot of percentages of correct responses to each item on the pretest (blue), posttest for students who received lecture (red) and students who went on the solar system walk (yellow), Fall 2008. Figure 8.5.2 Plot of normalized gains on each item for the lecture sections (blue), and the students who went on the solar system walk (red), Fall 2008. Figure 8.5.3 Plot of percentages of correct responses to each item on the posttest only (blue), for students who students who went on the solar system walk in Fall 2009. Figure 8.6.1 Plot of percentages of correct responses to each item on the pretest (blue), posttest for students who received lecture (red) and students who went on the solar system walk (yellow), Fall 2010. Figure 8.6.2 Plot of normalized gains on each item for the lecture sections (blue), and the students who went on the solar system walk (red), Fall 2010.. 29.
(31) Figure 9.2.1 Histograms comparing planetary radii, masses and densities. Note-using logarithmic plots was considered, especially in the plot of planetary masses, where the only Jovian planet masses are even visible, but based on the fact that the course in nonmathematical in nature, it was decided that this may hinder the students’ ability to draw conclusions from examination of the histograms. Figure 9.3.1 Percentage of correct responses to each item in pretest (blue) and the posttest for lecture sections (red) and tutorial sections (yellow). Figure 9.3.2 Normalized gains (Hake, 1998) for each item in the assessment from lecture (blue) and tutorial (red) sections. Figure 9.4.1 Percentage of correct responses in the second part of the study to each item in pretest (blue) and the posttest for lecture sections (red) and tutorial sections (yellow). Figure 9.4.2 Normalized gains from the second part of the study for each item in the assessment from lecture (blue) and tutorial (red) sections. Figure 9.5.1 Percentage of correct responses in Fall 2010 to each item in pretest (blue) and the posttest for lecture sections (red) and tutorial sections (yellow). Figure 9.5.2 Normalized gains in Fall 2010 for each item in the assessment from lecture (blue) and tutorial (red) sections.. 30.
(32) Figure 10.3.1 The diagram of a comet’s orbit that was given to students at the beginning of the class period in which comets were to be covered and at the beginning of the next class period after instruction. The following instructions were included; Figure 1 shows the portion of a comet’s highly eccentric orbit that is close to the Sun. At each numbered position of the comet’s nucleus draw the comet’s coma (head) and tail. Make sure that your drawing clearly shows any differences between the size of the coma and length of the tail and the direction the tail is pointing. Figure 10.3.2 Student drawing showing the common misconception that a comet always travels head first and tail last. Figure 10.4.1 Student drawing showing correct variations in size of the coma and tail as well as correct orientations of the tail. Note- all students were taught in lectures that there are two tails on a comet but this was not considered part of this exercise (some students however did include two tails in their drawings). Figure 10.4.2 Percentage of correct drawings for each item the diagnostic assessment (blue) and formative assessment in lecture sections (red) and in tutorials sections (yellow). Item 1 is the relative sizes of the coma; 2 the relative sizes of the tail; and 3 is the directions of the tail. Item 4 is the percentage in each group that made a drawing like Fig. 10.3.2, the head first, tail last misconception, so correct responses for this item will show a decrease. Figure 10.4.3 Normalized gains, g, on items from the diagnostic to the formative assessment in the lecture sections (blue), and in tutorial sections (red). Figure 10.5.1- Percentage of correct drawings for each item the diagnostic assessment (blue) and formative assessment in lecture-only sections (red) and in HPL/ visualtutorials sections (yellow). Recall that item 4 is the percentage of students submitting a drawing like Fig. 10.3.2 showing the head first and tail last misconception, so correct responses for this item will show a decrease.. 31.
(33) Figure 10.5.2-Normalized gains, g, on each item from pretest to posttest administration of the comets visual assessment, lecture-only sections (blue), and in HPL/ visual-tutorial sections (red). “Item” 1 is the relative sizes of the coma, 2 the relative lengths of the tail and 3 is the directions of the tail. Figure 10.6.1- Percentages of students drawing the coma and tail size and tail direction correctly on Fig. 10.3.1 before (blue) and after instruction by lecture (red) and using the visual-tutorial (yellow) in the Fall and Winter 2010 and 2011 semesters. Recall that item4 is the percentages of students submitting a drawing like Fig. 10.3.2 showing the common head first, tail last at all points in the orbit misconception. Figure 10.6.2-Normalized gains, g, on each item from pretest to posttest administration of the comets visual assessment, lecture sections (blue), and in the visual-tutorial sections (red) during the fall and Winter 2010 and 2011 semesters. “Item” 1 is the relative sizes of the coma, 2 the relative lengths of the tail and 3 is the directions of the tail. . Figure 11.2.1-Visual Assessment used prior to and after instruction on detection of extrasolar planets (See Note 10.1). Figure 11.3.1 Percentage of correct responses on the diagnostic, formative and summative extra solar planet visual-assessment for students given a lecture (blue) and doing a tutorial (red) on extra solar planets. Figure 11.5.1 Percentage of students correctly identifying all the waveforms in item-1, item-2, and in both items on the extra solar planets visual-assessment on the pretest (blue) in lecture-only sections (red) and in HPL/visual- tutorial sections (yellow). Figure 11.5.2 Normalized gains, g, on both items and the entire extra-solar planets visual assessment for lecture-only sections (blue), and in HPL/ visual-tutorial sections (red).. 32.
(34) Figure 11.6.1 Percentage of students scoring 0-7 on the pretest (blue) and on the posttest in the lecture (red) and visual tutorial (yellow) sections. Figure 11.6.2 Data from Table 11.6.2 showing the percent of students answering the entire front side (blue), back side (red) and the entire (yellow) visual assessment on the pretest and in lecture and tutorial sections during the Fall and Winter 2010 and 2011. Figure 11.6.3 Data from Table 11.6.1. showing normalized gains on item-1 (front), item2 (back) and the entire visual assessment in the lecture (blue) and tutorial (red) sections during the Fall and Winter 2010 and 2011. Figure 12.7.1 Percent of correct responses before (blue) and after instruction on assessment questions on Terrestrial Planet surface conditions in sections receiving lecture (red) and doing the LT (yellow). Figure 12.7.2 Normalized gains (Hake, 1998) on each item in the assessment of Terrestrial planet surface conditions in lecture (blue) and LT (red) sections. Figure 12.8.1 Percent of correct responses on each item in the assessment of Terrestrial Planet surface conditions on the Pretest (blue) in lecture-only (red) sections and HPL (yellow) sections. Figure 12.8.2 Normalized gains (Hake, 1998) on each item in the assessment of Terrestrial Planet surface conditions in lecture-only (blue) and HPL (red) sections. Figure 13.6.1 Percent of correct responses before (blue) and after instruction on assessment questions on solar system formation conditions in sections receiving lecture (red) and doing the LT (yellow) in Winter 2009. Figure 13.6.2 Normalized gains (Hake, 1998) on each item in the assessment of solar system formation in lecture (blue) and LT (red) sections during Winter 2009.. 33.
(35) Figure 13.6.3 Percent of correct responses before (blue) and after instruction on assessment questions on solar system formation conditions in sections receiving lectureonly (red) and doing the LT as part of HPL-pedagogy (yellow) in Fall 2009. Figure 13.6.4 Normalized gains (Hake, 1998) on each item in the assessment of solar system formation in lecture-only (blue) and LT as part of HPL-pedagogy (red) sections during Fall 2009. Figure 13.7.1 Percent of correct responses before (blue) and after instruction on assessment questions on solar system formation conditions in sections receiving lecture (red) and doing the LT (yellow) in Fall 2010. The tutorial group out gained the lecture group on three items with gains appearing comparable on the other three. Figure 13.7.2 Normalized gains (Hake, 1998) on each item in the assessment of solar system formation in lecture (blue) and LT (red) sections in Fall 2010. Figure 14.3.1 Plot of student percentages scores on each item of the pretest (blue) and posttest in lecture (red) and tutorial (yellow) sections for the Winter 2009 Solar System Survey. Figure 14.3.2 Normalized gain for each item in the lecture (blue) and tutorial (red) sections for the Winter 2009 Solar System Survey. Figure 14.3.3 Percentage of students scoring 0-25 on the pretest (blue) and posttest in lecture (red) and tutorial (yellow) sections for the Winter 2009 Solar System Survey. Figure 14.4.1- Plot of student percentages scores on each item of the pretest (blue) and posttest in lecture-only (red) and HPL-tutorial (yellow) sections for the Fall 2009 Solar System Survey.. 34.
(36) Figure 14.4.2- Normalized gain for each item in the lecture-only (blue) and HPL-tutorial sections (red) for the Fall 2009 Solar System Survey. Figure 14.4.3-Percentage of students scoring 0-25 on the pretest (blue) and posttest in lecture-only (red) and HPL-tutorial (yellow) sections for the Fall 2009 Solar System Survey. Figure 15.3.1-Plot of the results of Student Attitude Survey.. 35.
(37) 36.
(38) Chapter 1 Introduction 1.1 Statement of Problem The question being researched is whether or not use of the learner-centered activities on solar system topics developed is a better way to teach these topics than by traditional lectures. The results will also bring into question whether or not active and collaborative learning is in fact more effective than lecturing. The validity of the results will also depend on the quality of the activities and validity or the assessment, both of which must be determined to some degree as well. 1.2 General Overview Chapters 2-5 are the background for the project, the results of a literature search on how people learn and active and collaborative learning in general, then, more specifically, how students learn science, how active and collaborative learning is applied to introductory college astronomy. Chapter 6 is an overview of course the solar system unit of which the instructional materials developed are a part. Chapter 7 outlines the results of a pilot research project that employs the intended methods of this project using already developed material for instruction and assessment on the subject of light, the Sun and stars. Chapters 8-14 describe the development and implementation of the instructional materials and assessments used in the project and their results. Chapter 15 is the results of a survey of student attitudes. Chapter 16 is the conclusion.. 37.
(39) 38.
(40) Chapter 2 How People Learn 2.1. Introduction. The Committee on Developments in the Science of Learning released a report in 2000 on what they termed as the “New Science of Learning” in the form of the book, How People Learn, published by the National Research Council. (Bransford et al., 2000) Their findings resulted in recommendations that educators pay close attention to three specific things; what is taught, how it is taught and how it is assessed. The goal of education being to help students develop the skills necessary to both acquire knowledge and think for themselves, to “learn how to learn” and ultimately become “life-long learners.” This also included educators developing new approaches in attempt to help students develop these skills. 2.2 Learning Environments and the Principles of How People Learn The committee’s recommendations were organized into three principles of how people learn. These were based largely on the idea that settings greatly influence learning and the way these principles can be applied for effective instruction. The “Principles of How People Learn” or “HPL principles” are: 1-that students come to classrooms with existing understanding based largely on their experience and that these understandings must be engaged before new learning can occur; 2-that factual knowledge must be organized into conceptual frameworks to be readily accessed then understood; and 3-that instruction should be based on attempting to have students take control of their own learning, largely through well defined goals and frequent monitoring of progress. These principles are used to define recommended settings or ”Learning Environments” in which they can be applied to design effective instruction. Recommendations are that instruction be;. learner centered, assessment centered, knowledge centered and. community centered. These principles and environments will be referred to for short. 39.
(41) throughout this work as the “HPL principles,” and “HPL environments” or together as “HPL pedagogy.”. 2.3 Learner Centered Environments The basic idea of a “Learner Centered Environment” is that instruction start with attention being paid to what students bring with them to the classroom. What students know, the skills they posses and their attitudes and beliefs should all be brought out. This can occur either formally, through diagnostic assessments, or informally, through discussion. Discussions should not deny beliefs. This pertains particularly to the abundant misconceptions students usually have. Misconceptions are very robust and persistent. Students almost always hold on to misconceptions if simply told that they are wrong. Student minds are not “blank slates” or “empty vessels” onto or into which new knowledge can be either etched or poured. Rather, students have a logical system based on experience that has sufficed and been re-enforced all of their lives. Hence, it is against this discouraging backdrop that education must work. Therefore, misconceptions need to be drawn out and dealt with. Students almost certainly need to see their preconceived notions fail before the misconceptions can be overcome. Interactive demonstration, ones in which students are first asked to make predictions based on their prior knowledge and then can participate in some way and actually witness the failure of their preconceptions is a first step toward conceptual change. Simply put, these activities build new structures in the brain, so when new data is perceived, they then can jump from the old, likely flawed preconception to a more scalable model. We then allow them to build a new model that is connected in their experience with the data through the old model. This leads directly to the conclusion that for many students conventional lectures, simple “teaching by telling” does not work. Research conducted by Nobel Prize-winning physicist, Carl Wieman (Wieman, 2009) showed that retention by students of facts presented in lectures after 15 minutes is only 10% and that of physics graduate students and faculty is not any better. This is a startling conclusion, and a corollary to this. 40.
(42) statement is that much of our college education system is flawed and not working at its best efficiency. Indeed the college admission process may select out students who can learn enough in spite of a bad teaching system. But imagine if even “successful” students could become much more efficient and better learners. One might say that college education only succeeds because the good students can dig their way out of any mess. Typical instruction is probably not in their best interest. The central thesis of HPL and what we submit evidence for in this work is that students can often gain better understanding from more active-learning, such as inquiry-based exercises, where they are actually doing something rather than just attempting to listen to someone explain concepts. We propose that traditional, lecture-based teaching methods are literally out of date. Useful activities are often tasks intended, at least partly, to get students to think about their preconceptions, something that lectures are not often designed to do. This approach can help lead students gaining control of their own learning.. 2.4. Knowledge Centered Environments. A “Knowledge Centered Environment” is one where instruction is centered on: 1-what the subject matter is; 2-how it is being taught (the curriculum); and 3- how mastery of the subject will be identified, or what students should know or be able to do (the learning goals). The goal of conceptual knowledge-centered instruction is the deep understanding of concepts, the big themes of science rather than simply the memorization of seemingly disconnected facts. If only memorized, facts are not useable knowledge. Rather they must be organized into a conceptual framework and used as examples to support the learning of concepts. Students generally are in need of help to achieve this. What is most important in a topic, the core concepts, is often not obvious to students. Too much unorganized factual information overwhelms and confuses students and prevents them from seeing “the big picture,” or “the forest through the trees.”. 41.
(43) Knowledge-centered instruction also involves covering less material, but in more detail, with more depth, avoiding the. “mile-wide, inch-deep” approach to a subject. As. recommended in learner-centered instruction, having students doing inquiry-based activities rather than listening to lectures can lead to deeper understanding, fostering the knowledge-centering approach. Many instructors do not undertake such teaching because it usually takes more class time. However, students can learn more if curricula are organized centering on activities designed to use facts to support the understanding of concepts rather than simply a barrage of these facts to be memorized and most likely later forgotten.. 2.5 Assessment Centered Environments Most assessment occurs in the form of quizzes, tests and examination, typically with the purpose of final evaluation with which to assign grades. This “summative” type of assessment is important, but since it occurs after instruction is concluded it is too late for students to revise or add to their knowledge and thus aid in any more learning. An “Assessment Centered Environment” makes use of assessment types beyond testing, including both “diagnostic” and “formative” assessments that are responsive to student progress. Diagnostic assessment occurs prior to any instruction on a topic and can, as is desirable in learner-centered instruction, draw-out student preconceptions and make their thinking visible to themselves, their peers and the instructor. Formative assessments, can do this as well, but occur during instruction. They provide feedback for the students, allowing them to monitor their own progress, and also for the instructor, to monitor progress while there is still time for students to amend their knowledge. Any information about students’ previous knowledge can be used to everyone’s advantage. Formative assessments should occur frequently and, as in knowledge-centered instructions, involve questions about understanding concepts pertinent to instructional goals and not just memorization of facts. Much work on “embedded assessments” to which these could also be referred, has. 42.
(44) been undertaken over the last decade (Wilson & Sloan, 2000), showing consequent improvement in student learning. Well-written multiple-choice questions can serve this purpose. This idea is in contrast to some of the trends in modern education, such as assessment of conceptual understanding, through machine-readable essays.. However, the “Force Concept Inventory” (Hake,. 1998) is a well-established example of such a multiple-choice assessment of conceptual learning. This is especially true of multiple-choice assessments in which the incorrect responses (the distracters) involve common misconceptions about the topic. This of course necessitates prior identification of these misconceptions. Effective assessments are usually not in the form of a test or quiz taken individually or a paper or questions assigned as homework, but something more learner-friendly that occurs in the classroom and involves student interaction, often in the form of small group discussion or students evaluating each other’s work or both.. 2.6. Community Centered Environments. A “Community Centered Environment” is defined as a classroom environment that promotes students working together and building on each other’s knowledge as they cooperate to solve problems. The “norm” in such an environment should be a culture of respect in which students are encouraged to ask questions and share ideas. Learning to explain the reasoning behind their understanding is essential for the student and their peers, so it should be encouraged. Students should therefore be made to feel free to communicate their understanding while trying to learn concepts. In this environment, there are no mistakes – just evolving models. Students should not have to worry about being criticized or ridiculed for incorrect or I answers. Making a mistake should not be considered an admission of inadequacy, but rather a helpful opportunity to search for deeper understanding.. 43.
(45) Research has shown that students almost always gain motivation and therefore improve their performance from seeing that their contributions impact others’ learning in a positive way. (Bransford et al., 2000) Strategies that can be used to foster communitycentered instruction are collaborative learning activities, ones in which students work together on learner-centered, inquiry-based projects, and reciprocal teaching. For instance, having students explain concepts from the previous class session to one another as a review. Also, since the success of a community-centered environment will be based on mutual respect and trust, it is usually counter-productive to have students competing with one another for grades on a curved scale. 2.7 An Example Cleary, there are overlaps in the four environments in which the three HPL principles are applied. An example of a pedagogy that combines all four of the HPL environments is posing multiple-choice questions as formative assessments to students in a classroomresponse format. This can be done with either with an electronic system or flashcards. A question is projected on a screen for all to see then, after having had sufficient time to read the questions themselves and think about their response, a vote is taken on the correct answer. If a large majority of students answer the question correctly, the instructor can consider the material learned and the class can then move on to another topic. If not, students are then required to seek out others who had answers different than their own and discuss the question while trying to defend and convince others of their choice. Once discussions quiet down or turn to other matters, another vote can be taken to see if the percentage of correct responses has increased. This pedagogy, dubbed “peer instruction,” (Mazur, 1997) was pioneered and championed by Eric Mazur (Mazur, 2002) of Harvard. Nobel laureate Leon Lederman also developed such a system. (Pennypacker, 2010) Mazur found that students of introductory physics that had been given lectures on Netwon’s laws of Motion could recite the laws but could not actually put them to use in answering simple conceptual questions. This made him. 44.
(46) realize that lectures are really only a transfer of information from the teacher to the student that sometimes even occur without the information passing through the brains of either. This prompted him to begin to shift the responsibility of gathering information to the students by assigning them reading before class and using class time for discussion of and thinking about the material through the use of peer instruction. He also refers to this as teaching by “questioning” rather than “telling.” Research has shown (Lasry et al., 2008) that when instruction focuses on engaging the students, conceptual gains will be much higher than with instructor-centered lectures. Also often referred to as “clickers,” the use of a classroom-response system has been embraced by many in the learner-centered teaching of astronomy. (Duncan, 2006, 2007, 2008: see Pasachoff et al., Prather & Brissenden, 2009) This application will be discussed in more detail in chapter 5 and results that include its use are reported in chapters 7, 9, 12 and 13. When executed well and with adequate classroom management, the use of “clickers” is learner centered because the student is actively engaged in reading and thinking about the answer to the question. Their use can also be knowledge centered if the questions used are written to test understanding of a concept rather than memorization of facts. When used as formative assessments for student to monitor their progress while still allowing them to revise and improve their thinking and to give the instructor feedback, the exercise is assessment centered. This pedagogy is also obviously community centered since during the discussion portion the students are collaborating, learning from each other and exchanging ideas.. 45.
(47) 2.8. Instructors. A challenge for instructors is to recognize that being an expert in the content of a subject is only the first step to good teaching. Unless one addresses explicitly and implicitly the preconceptions of the students, HPL claims and evidence supports that teaching will work at much lower efficiencies. A deep understanding of the content being taught is a must, but knowledge of effective pedagogy is essential as well. Using innovative methods of instruction that are part of HPL Pedagogy, such as formative assessments and active and collaborative learning can cause both student thinking and difficulties to be more transparent and instruction more successful.. 46.
(48) Chapter 3 Active & Collaborative Learning 3.1. Introduction. When considering the HPL (How People Learn) principles and environments pedagogies that employ everything discussed thus far are Active & Collaborative Learning. Research has shown that students learn best when actively engaged in the process. This is also true of students working in collaborating groups. Not only do they learn more, they have longer retention and enjoy the learning process more than when the same material is taught thorough formats such as traditional lectures. (Beckman, 1990; Chickering & Gamson, 1991; Collier, 1980; Cooper, 1990; Goodsell, Johnson & Johnson, 1989; Johnson, Johnson, & Smith, 1991; Kohn, 1986; Slavin, 1980, 1983; Whitman, 1988) 3.2 Active Learning As mentioned above and in Chapter 2, (Lasry et al., 2008) research has shown that when instruction focuses on engaging the students, conceptual gains will be much higher than with instructor-centered lectures. In active learning, it is not information, but the actual process of learning, and thus the responsibility for it is transferred from the teacher to the student. (Aronowitz, 1993, Boud, 1981) Students need to be told less and encouraged to discover more. (Weimer, 2002) The transfer of information through lectures makes students more dependent and discourages more meaningful approaches to learning. In addition, with the advent of media such as YouTubeTM (www.youtube.com), lectures are becoming rapidly obsolete. When some faculty at the University of California began putting their lectures on YouTube,TM. (www.youtube.com/user/UCBerkeley). students. stopped. (Pennypacker, 2010) Hence, mandatory attendance soon became a requirement.. 47. coming..
(49) Student should be developing individual ways of understanding. Instructors need to allow learners to raise questions that test their own ideas for validity and students need to be involved in the process of acquiring and retaining information. They should be exploring and handling data on their own and relating it to their experiences, when actively engaged in discovery the students actually become scientists themselves. It is in theses way that students can become more independent in their learning. (Boud, 1981) Short innovative activities, creatively designed to engage students in content should become routine. Questions generated by such material will create “teachable-moments” that often do not occur in other, less-active learning environments. (Weimer, 2002). The materials presented and assessed in Chapters 8-13 of this work are all designed exactly to fulfill this purpose. A teaching environment in which active learning occurs is the HPL learner-centered environment (Bransford et al., 2000) discussed in the last chapter. 3.3 Collaborative Learning Collaborative learning can be defined as students, often of varying levels of skill and academic achievement, working together in small groups where they are responsible for each other’s learning with the purpose of completing a task or achieving a goal. (Gokhale, 1995) The value of students working in groups to learn from one another as they discuss and attempt to solve problems is often underestimated. Research has shown that they do indeed learn from one another. (Qin et al., 1995) Students should be encouraged to work in groups as research has also shown that problem solving skills often improve when students are able to better visualize a problem when presented with another student’s perspective or interpretation other than their own. (Brunner, 1985) This can result in higher achievement and retention (Johnson & Johnson,1986) as a result of greater engagement caused by an increased responsibility for not only their own, but the group’s learning. (Trotten et al., 1991). 48.
(50) Collaborative learning has even been credited with an increase in critical thinking skills. In one study (Gokhale, 1995) students who worked in groups showed significantly greater gains on conceptual questions than students who worked as individuals Interestingly the groups did not do significantly better than individuals on assessments of more fact-related material. This observation shows a link between collaborative learning, a HPL community-centered environment, with the more concept, less fact-centered HPL knowledge –centered environments (that will be discussed further in the next section) discussed in the last chapter. (Bransford et al. 2000) In the same study (Gokhale, 1995) a survey showed that students liked working in groups. There were many more positive comments, 107, about it than negative, 2. The only negative comment was that sometimes explaining things to other students was a waste of time. Positive comments included that pooling knowledge and experience was fun and helped create a more relaxed atmosphere that made problem- solving easier and that getting new perspectives and feedback helped stimulated thinking and helped in understanding, 3.4 The Role of Content There is much more knowledge in any one field than can be taught by any one instructor in any one course. Students need to be able to continue learning on their own. So instructors need to not just cover content, but rather use the content (Finkle, 2000) to teach the students to do this. Content is central, but it is more meaningful when students are actively engaged in acquiring the knowledge and using strategies and techniques for collecting and analyzing data rather than simply hearing about what others have done and how they did it. (Stage at al., 1998 ) Less material will be covered, but the trade-off is that it will be covered with more understanding and students will be developing skills that will allow them to continue to learn more about the subject after the class has ended. Learning should involve a qualitative change in knowledge more so than a quantitative change. (Ramsden, 1988 ). 49.
(51) This is well aligned with a statement being considered in the resolution of Commission 46, Astronomy Education and Development, of the International Astronomical Union (IAU): “That astronomy, when properly taught, nurtures rational, quantitative thinking and an understanding of the history and nature of science, as distinct from reproductive (rote). learning. and. pseudo-science”. (Pasachoff. &. Percy,. 2005,. http://iaucomm46.org/content/considering ) Commission 46 and its work as relevant to this study will be discussed in more detail in Chapter 5 and cited in other parts of this work. This is also very well aligned with the HPL knowledge-centered learning environment, discussed in the last chapter, that stress to use of facts rather than their memorization, to teach concepts. (Bransfor et al., 2000) 3.5 The Role of Assessment As discussed in the example of classroom response system, or “clickers,” in the previous chapter, assessments, especially formative ones can be both active and collaborative. Students voting on the correct responses is active and discussions that occur if not a high enough percentage of students respond correctly is collaborative. Although they are an excellent example of the HPL assessment-centered environment as well as community and learner-centered environments discussed in Chapter 2 (Bransford et al., 2000) “Clickers” are not the only type of active and/or collaborative assessment, there are in fact many methods that can be employed. (Keeley & Sneider 2012) Students can be given mini-quizzes, on an important topic from the previous class meeting and grade and discuss the answers to each other’s papers. They can also be asked to choose partner to which they will be instructed to explain an important concept from the previous class meeting and the partner then will be asked to do the same with another concept . Students can also be instructed to write a very short paper at the end of the class period, to limit the length, about the “muddiest point” from that day’s class the idea or concept that had the most difficulty with or understood the least. Collecting and reading. 50.
(52) these before the next class period will give the instructor instant feedback about what is and is not getting through to students, which will allow for further instruction for clarification or if necessary, changes in the instructional techniques. (Paulson & Faust, 2010 http://www.calstatela.edu/dept/chem/chem2/Active/, Keeley & Sneider, 2012) Most formative assessments should be “low stakes,” meaning, usually not for credit. This will reduce student anxiety about a grade an will likely make them perform better, resulting in a more honest of they do and do not know. (Weimer 2002) 3.6 The Role of the Instructor One of an instructor’s ultimate goals should be to teach students to think for themselves, so that they become more self-directed and independent and responsible for their own learning. These are skills that can also be useful in their personal and professional lives long after they leave school. (Baud, 1981) Classrooms that are too centered on the instructor arguably have an imbalance of power that negatively effects learning. The power needs to be shared more equitably between the teacher and students. This will empower the student to become more autonomous in their learning. (Ayers, 1986) The instructor is of course essential, but needs to step aside and be more “around” the classroom than “in front” of it. This means becoming more of a “guide” or “facilitator” or a “resource” for a collaborative learning community. (Barr & Tagg, 1995, Hill, 1980) This also necessitates knowing when to “hang-back” and let the students lead. This is not to say that it is less work for an instructor. It can actually be far more work, because it requires more preparation and can be a much harder method of instruction than by traditional lectures. The role of the instructor could be considered similar to that of a coach, gardener or conductor. A coach designs practice, sets the game plan, tries to motivate the players, sends in the plays and even makes decisions during a game, but I players that actually have to play. (Dunn., 1992) A gardener seeds and cares for a garden, but the plants have. 51.
(53) to grow on their own. (Fox, 1983) A conductor (be it of a philharmonic or a community band) cannot play for the musicians. In all cases, the instructor sets the stage, but it is the students who actually have to undertake the work. (Eisner, 1983) Instructors must act as examples, directing learners in how to solve problems and develop better understandings on their own. (Black, 1993) Instructors can show the way, even point out the sights, but again, they cannot make the trip for the students. Students must accept the responsibility to develop the skills and awareness to become independent learners. The instructor’s job is to create and maintain the conditions, the learning environments, necessary to promote this. (Weimer, 2002) The instructor can help organize and make a map to guide the student through materials, but it is the students who undertake the journey. (Weimer, 2002) This includes connecting students with learning resources and designing activities and assignments should be the vehicles for student learning. Activities and assignments that engage and motivate learners, which requires ingenuity and creativity. (Weimer, 2002) As mentioned previously he materials presented and assessed in Chapters 8-13 of this work are all designed exactly to fulfill this purpose. This should also includes using instructional time to teach skills. This should not be considered “below” an instructor or diminishing the content of a course., rather it should be an integral part of a course and not an extra that is simply “added-on” or “fit-in.” (Weimer, 2002) 3.7 Challenges for the Instructor Stepping aside and letting the students lead can be difficult for many instructors. It is hard to resist “showing what you know,” or being the “Sage on the Stage “ rather than the “Guide on the Side.” (King, 1993) It is far much easier and, for some instructor more satisfying, to give a quick, “snap,” answer to a student’s question, but this is not always in the student’s best interest.. 52. It is also difficult to admit that there is no guarantee of.
(54) success, that learning cannot be forced, but rather that it is a student decision. “You can lead a horse to water, but you cannot make them drink.” In learner-centered instruction, it can also be hard to deal with the “messiness” (Weimer, 2002) involved when students do not do something well. Instructors must stop doing things for students, do less telling and allow more discussion and discovery to occur. Students, almost inevitably, want to be told the answer, as this is how they have been taught all of their lives. Also, allowing what students do and do not learn must drive instructional decisions. This requires frequent feedback, usually formative assessments that also involve the students monitoring their own learning.. 53.
(55) 54.
(56) 55.
(57) Chapter 4 How Students Learn Science 4.1 Introduction In 2005, the National Research Council released How Students Learn-Science in the Classroom, (Donovan & Bransford, 2005) a follow up to How People Learn (Bransford et al., 2000) pertaining specifically to the application of the HPL principles and environments (HPL pedagogy) to teaching science. New guidelines resulted in recommendations for effective science instruction. The guidelines are that students be assisted in: becoming familiar with the concepts and theories of scientific disciplines (what we know); understanding how scientific knowledge is attainted, (how we know it); and the ability to use the understanding to engage in inquiry (doing science). These guidelines lead to recommendation for effective science instruction that are aligned with HPL pedagogy: that student preconceptions be addressed; that students be taught what it means to “do” science; and that students be encouraged and given the opportunity to reflect on what they have learned. These three recommendations together will henceforth be abbreviated as the “HSLS recommendations.”. 4.2 Addressing Preconceptions This recommendation is aligned directly with first of the HPL principles and addressed by three of the learning-environments. Students have preconceptions about science rooted in their everyday knowledge and experience that are often sensible, but are not scalable beyond a narrow range of input data. Examples are that forces are properties of objects rather than interactions between them, that objects “are” certain colors rather than reflecting those colors (or wavelengths) of light. One physics instructor reported that despite having “covered” gravity, many students in his physics class believed that objects in the room were held on the ground by the weight of the air and would float away if the air were pumped out of the room. Students may also have preconceived ideas about how 56.
(58) science is done. Most students do not understand that science is a process of inquiry and not just a body of knowledge or facts and figures that lead to right or wrong answers. (Donovan & Bransford, 2005) In an assessment-centered learning environment, science instruction should start with discussion or activities meant to draw what students think they know and how or why they know it. As in a community-centered environment, this can be done in groups with a culture of respect, where questioning is valued and errors are looked at as learning opportunities. Since students are active participations in this process, it is also an example of instruction in a learner-centered environment. 4.3 Preconceptions in Astronomy As was clear from A Private Universe (Harvard-Smithsonian Center for Astrophysics, 1987) that begins by showing interviews with Harvard students at their graduation that students hold many interesting theories about nature and the Universe. There has been much work done on preconceptions and misconceptions in astronomy showing that they are rampant. (Sadler, 1992, Zeilik et al., 1998, Comins, 2001, Plait, 2002 Zeilik & Morris, 2003, Fucili, 2005, see Pasachoff & Percy, Metaxa, 2008 see Pasachoff et al.) A recent study at HFCC (LoPresto & Murrell, 2011) showed that among other misconceptions that 79% of N=528 incoming introductory college astronomy students believed that varying distance between Earth and the Sun is the cause of the seasons, that 74% believe that the North Star is the brightest star in the sky and that 71% believe that lunar phases are caused by Earth’s shadow being cast on the moon. These and a number of other misconceptions revealed by the survey support HPL teaching by showing that dealing with preconceptions must become an integral part of the instruction of introductory astronomy if it is expected to be successful.. 57.
Figure

+7


Outline
Related documents
guests. However, our average charter has about 120-150 passengers as capacity is reduced from its certified capacity to allow for tables, seating, caterer’s needs, entertainment,
The findings from this AINE Project are consistent with the literature, the Quality-Caring model, and the Civility in Nursing model, that when incivility is perceived as mild within
Journal of Membrane Science International Journal of Hydrogen Energy Water Science & Technology RSC Advances Water Environment Research (2017 Top Reviewer)
Provide ventilation during use to control HOAc within exposure guidelines or use respiratory protection.. Avoid
51,000/- only was taken as an advance to take/ occupy a room of the defendant, situated over the upper portion of My Dear restaurant and the said amount has already
Thus, when there are two samples of range-metric measurements, it ispossible to estimate rotation and translation of the mobile robot, producing calculations only in the
The average PCC when presented with data from the training period rose from 0.9064 to 0.9419, as the strain gauges provided context to the condition of the bridge that was simply
