ADAPTING TO EXTREME EVENTS:
HOUSEHOLD RESPONSE TO FLOODS IN URBAN AREAS
Maura Connolly Allaire
A dissertation submitted to the faculty at the University of North Carolina at Chapel Hill in partial fulfillment of the requirements for the degree of Doctor of Philosophy in the
Department of Environmental Sciences and Engineering.
Chapel Hill 2015
ii © 2015
iii ABSTRACT
Maura Connolly Allaire: Adapting to Extreme Events: Household Response to Floods in Urban Areas
(Under the direction of Dale Whittington)
This dissertation is an economic study of household-level decisions related to flood risk mitigation. It is composed of four chapters that focus on the 2011 Thailand flood, the world’s most costly flood event in the past 30 years. The first chapter examines the magnitude and composition of economic costs that households in Bangkok bore during the 2011 flood. Two rounds of surveys with 469 Bangkok households collected detailed information on a broad set of flood costs. Results indicate that total flood cost was substantial. The median cost was
equivalent to half of annual household spending. However, structural damage to homes was surprisingly low, given the depth and duration of the flood.
The second chapter assesses how online information can enable households to reduce flood losses. Propensity score matching is used to test for evidence of a relationship between social media use and flood loss. Results indicate that social media use enabled households to reduce mean losses by 37%. Social media offered information that was not available from other sources, such as localized and nearly real-time updates of flood location and depth. With
knowledge of current flood conditions, households could move belongings to higher ground before floodwaters arrived.
iv
insurance and home retrofits. A sample of 364 flood-prone households in Bangkok was
randomly split into treatment and control groups. The treatment group received practical details on home retrofits and subsidized flood insurance as well as social norm information regarding insurance purchase decisions of peers. Results indicate that the information intervention increased insurance purchases by about four percent, while no effect was detected for home retrofits.
v
TABLE OF CONTENTS
LIST OF TABLES ... vii
LIST OF FIGURES ... viii
LIST OF ABBREVIATIONS ... ix
INTRODUCTION ... 1
REFERENCES ... 11
CHAPTER 1: ECONOMIC COSTS INCURRED BY HOUSEHOLDS IN THE 2011 GREATER BANGKOK FLOOD ... 14
1.1 Introduction ... 14
1.2 Background—The 2011 Thailand Flood ... 18
1.3 Description of the Study Sites, Sampling, and Fieldwork ... 23
1.4 Definitions, Calculations of Economic Costs Incurred by Households, and Modeling Strategy ... 26
1.5 Results ... 38
1.6 Discussion ... 56
REFERENCES ... 62
CHAPTER 2: INFORMING MITIGATION OF DISASTER LOSS THROUGH SOCIAL MEDIA: EVIDENCE FROM THAILAND ... 64
2.1 Introduction ... 64
2.2 Background ... 68
2.3 Description of Study Site and Fieldwork ... 73
2.4 Analysis and Modeling Strategy ... 75
2.5 Results ... 85
vi
REFERENCES ... 112
CHAPTER 3: USING INFORMATION TO INFLUENCE FLOOD MITIGATION BEHAVIOR: EVIDENCE FROM A FIELD EXPERIMENT ... 114
3.1 Introduction ... 114
3.2 Background ... 116
3.3 Research Design, Hypotheses, & Modeling Strategy ... 121
3.4 Results ... 126
3.5 Discussion ... 134
REFERENCES ... 136
CHAPTER 4: BENEFIT-COST ANALYSIS: INFORMATION CAMPAIGN FOR FLOOD INSURANCE ... 141
4.1 Introduction ... 141
4.2 Background ... 144
4.3 Theoretical Approach to Estimate Welfare Effects of Information Intervention ... 149
4.4 Fieldwork, Data, and Methods ... 163
4.5 Results ... 174
4.6 Discussion ... 182
REFERENCES ... 185
CONCLUSION ... 188
APPENDIX A: PROPENSITY SCORE MATCHING –ESTIMATION OF BALANCING SCORE... 193
APPENDIX B: CONCEPTUAL FRAMEWORK FOR INFORMATION FIELD EXPERIMENT... 196
vii
LIST OF TABLES
Table 1.1 Profile of the Study Area ... 24
Table 1.2 Components of Total Economic Costs Incurred by Households ... 31
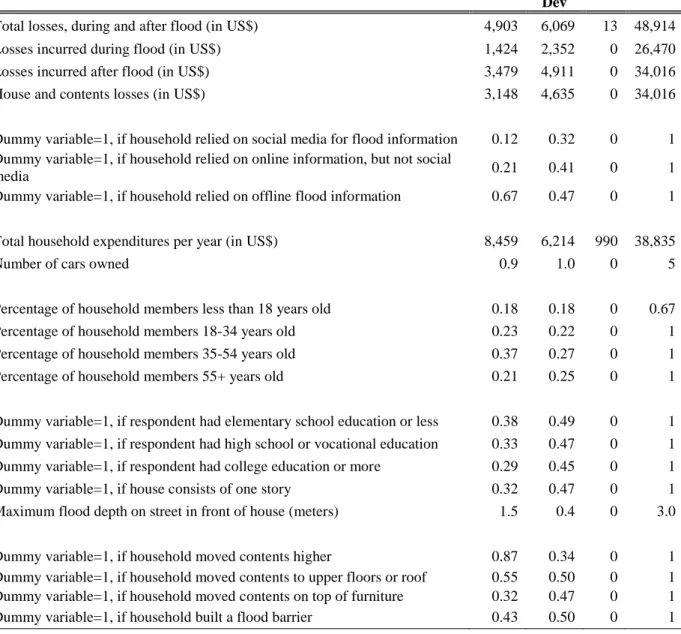
Table 1.3 Summary Statistics of Regression Variables (Obs = 469) ... 37
Table 1.4 Summary Statistics of Economic Cost Components, by poverty status ... 40
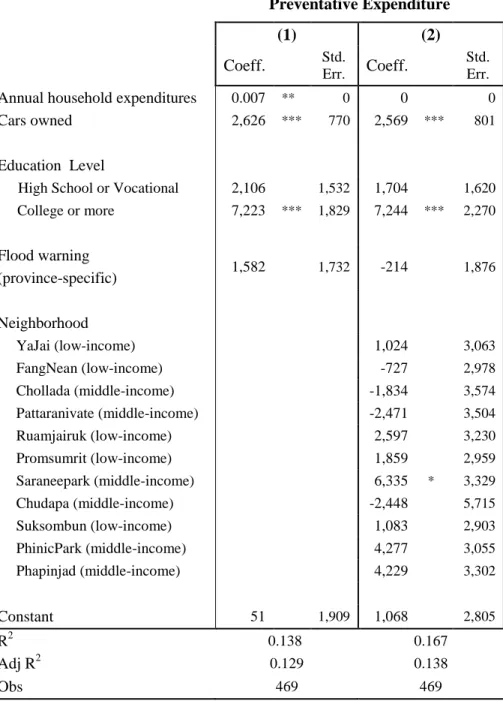
Table 1.5 OLS Regression Results for Preventative Costs ... 53
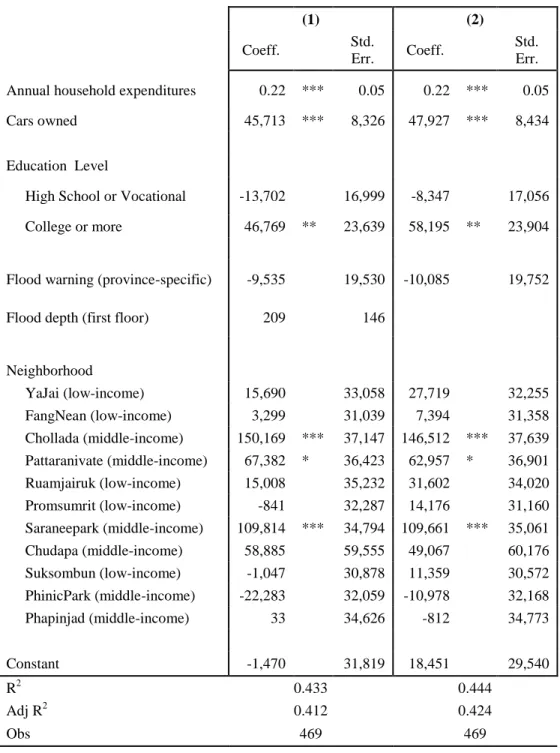
Table 1.6 OLS Regression Results for Ex Post Flood Losses, and Total Costs ... 55
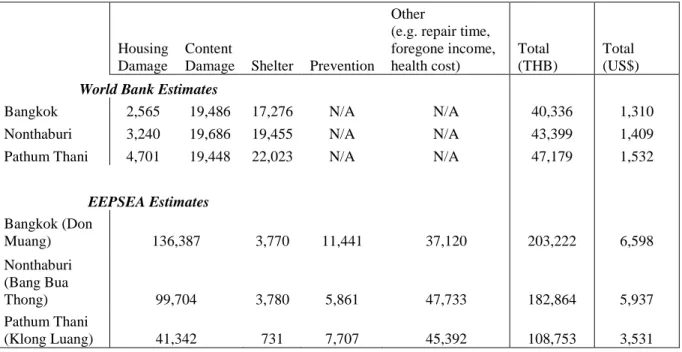
Table 1.7 Mean Household Damages, Comparison of Study Results to World Bank (2012) Estimates .... 60
Table 2.1 Categories of Flood Information Source (Before flood) ... 78
Table 2.2 Summary Statistics of Regression Variables, Full Sample (n=469) ... 87
Table 2.3 Summary Statistics of Regression Variables, by information source category ... 88
Table 2.4 Descriptive Statistics for Propensity Score Matching, Matched Sample ... 95
Table 2.5 Mean Differences in Total Flood Loss (in US$), Matched Samples ... 98
Table 2.6 Estimation of Average Treatment Effect on the Treated (ATT): Using regression analysis and PSM Matched Samples ... 99
Table 2.7 Regression results for flood losses – sources of flood information ... 103
Table 3.1 Household characteristics in the baseline ... 127
Table 3.2 Household retrofit behavior in the baseline ... 128
Table 3.3 Difference in insurance purchase and information seeking between control and treatment households at follow-up ... 132
Table 3.4 Difference in risk perception and home retrofits between control and treatment households .. 133
Table 4.1 Types of households, by awareness of insurance and demand ... 153
Table 4.2 Summary of Demand for Insurance Coverage, by household type ... 157
Table 4.3 Key parameters for Benefit Cost Analysis ... 166
Table 4.4 Estimated Household-level Coverage Demand, by household type ... 169
Table 4.5 Costs of Information Campaign ... 174
viii
LIST OF FIGURES
Figure 1.1 Economic cost, loss, and damage categories ... 27
Figure 1.2 Frequency of total, direct, and indirect costs ... 43
Figure 1.3 Frequency of total, direct, and indirect costs as a percentage of annual expenditure ... 44
Figure 1.4 Composition of mean household costs ... 45
Figure 1.5 Cumulative frequency distributions of economic costs ... 48
Figure 1.6 Median household costs, by loss type and income group ... 49
Figure 1.7 Median household costs, by province ... 52
Figure 2.1 Household internet use, by period of flooding ... 73
Figure 2.2 Summary of Study Design ... 75
Figure 2.3 Types of Moving Contents Actions, by information source ... 91
Figure 2.4 Number of stories in dwelling, by expenditure quartile ... 93
Figure 3.1 Summary of Experimental Design ... 123
Figure 3.2 Excerpt from Practical Information Brochure, English Translation ... 124
Figure 4.1 Household insurance demand, Type 3 household ... 152
Figure 4.2 Household insurance demand (Post-Information Campaign), by household type ... 155
Figure 4.3 Market Demand for insurance, after information campaign... 158
Figure 4.4 Sensitivity of NPV estimates to key parameter values (logarithmic decline in insurance uptake) ... 180
Figure 4.5 Sensitivity of NPV estimates to key parameter values (upside insurance uptake assumption) ... 182
ix
LIST OF ABBREVIATIONS
BCA Benefit-Cost Analysis GDP Gross Domestic Product NPV Net Present Value THB Thai Baht
1
INTRODUCTION
The costs of natural disasters have increased dramatically around the world in recent decades (Munich Re Group, 2005; Miller et al., 2008; IPCC, 2012). Multi-billion-dollar disasters are becoming common. While flood-related mortality has declined due to improved early warning, property costs continue to rise (White, Kates, & Burton, 2001). Increased disaster costs are largely driven by greater concentrations of people and assets in disaster-prone areas. In particular, coastal cities around the world face rising flood exposure due to growing population, greater asset values, land subsidence, and sea-level rise (De Sherbinin et al., 2007; Dixon et al. 2006; Hanson et al., 2011). The world’s population is urbanizing and moving to these vulnerable areas, nearly two-thirds of the global population is expected to live in cities by 2050 (United Nations, 2015). In addition, more severe and frequent precipitation events due to climate change could further increase flood frequency and intensity (World Bank, 2010).
2
Mitigating losses of life and property in vulnerable areas is a growing policy concern. However, limited knowledge of disaster costs and household mitigation behavior make informed public policy challenging. There is a worldwide lack of accurate, disaggregated, and comparable estimates of the economic costs of disasters. This limits analysis of disaster risk. Flood risk analysis has major two components – a hydrological assessment of the flood hazard (probability and physical intensity) and estimation of economic consequences (Mileti, 1999). While
hydrological hazard models are well developed in the engineering literature, economic damage models are not and could be greatly improved (Wind, Nierop, de Blois, & de Kok, 1999). A major barrier to the improvement of damage models is a lack of reliable and disaggregate flood cost data. International datasets on disaster damage underestimate indirect and production interruption cost. Furthermore, these datasets do not include non-financial costs or costs to the informal economy. Most engineering studies focus only on property and contents damage, while economics studies typically seek to find evidence of changes in macroeconomic indicators, such as gross domestic product (GDP).
Full costs of disasters extend beyond property damage and include impacts on health, the environment, and interruption of business and public services. Worldwide, there is a great need for comprehensive disaster cost data and improved understanding of factors that affect types and magnitude of damage. A lack of comprehensive loss data means that most economic
assessments do not include a full picture of mitigation costs and benefits. Improved data and understanding are crucial for selecting and prioritizing flood risk mitigation policies.
3
The focus has been on decreasing the probability of a flood and intensity. Under a more modern approach, flood control structures are assumed not to be fail-safe and communities are prepared for the possibility of inundation. This risk management approach considers the extent to which a given intervention can reduce those costs (Messner et al., 2007). A wide variety of mitigation strategies, both public and private, are conceivable under this modern approach and are not limited to publically-funded flood control structures. Private mitigation actions could play a role in reducing flood impacts. However, even after disasters, households often do not take risk mitigation actions and therefore remain vulnerable to future events (Burby et al., 1988; Kunreuther et al., 2009). Furthermore, little is known about how households prepare for, respond to, and recover from disasters (e.g. Bruneau et al., 2003; de Bruijn, 2004; Zhou, Wang, Wan, & Jia, 2010).
Household flood risk mitigation decisions tend not to be privately, let alone socially, optimal. For example, despite mandates and possible benefits, uptake of insurance against floods and other natural disasters tends to be low globally (Dixon et al., 2006). In U.S., only half of households in flood-prone areas are insured against flooding (Kriesel and Landry, 2004; Dixon et al., 2006). The failure of households to take mitigation actions is partly due to the fact that individuals rely on heuristics to assess hazards with low probability and can treat low-probability events as having zero probability (Kunreuther et al., 2002). Other reasons for household
4
US$ 97 million was cash transfers to compensate flood-affected households (DDPM, 2013). Therefore, as assets become more concentrated in coastal cities, both households and taxpayers bear costs.
My dissertation addresses how the economic cost of climatic disasters among households can be reduced. A particular focus is placed on how information can improve household
decision-making. In four chapters, I examine the types of costs households bore during the 2011 Bangkok flood, how online information allowed households to reduce flood costs, and how households can be encouraged to take flood loss mitigation actions. In all four dissertation chapters the 2011 Bangkok flood is used as an illustrative example in all four dissertation chapters. Bangkok is a highly relevant field site for issues regarding the economic costs of flooding and household decision-making. The 2011 flood ranks as the world’s most costly flooding disaster in the past 30 years (A.M. Best, 2012; Orie and Stahel, 2013).
Information provision could improve household decisions related to flood risk mitigation since there is often a lack of complete information. My dissertation addresses the role of
information in improving flood mitigation decisions. One chapter examines how online information can inform short-term loss prevention actions, while another investigates if information campaigns can encourage households to take longer-term adaptation actions.
5
and timing of the flood through the urban environment with much precision or lead time. Online sources, especially social media, may have offered households different types of information not provided by government or other traditional information sources. Online sources can be used as a tool to improve household preparedness and address new challenges presented by urban flood management.
When deciding to take longer-term flood mitigation measures, households evaluate information on flood loss (both magnitude and likelihood) as well as the cost of the action. Yet, even when measures are privately beneficial, households might fail to take action due to lack of awareness or incomplete information, inconvenience costs, or reliance on disaster relief. Mitigation actions could be encouraged via practical information on flood risk and mitigation options as well as social messages that convey the actions of others. Increasingly, practical and social messages are used in policy interventions to influence individual decisions. Experimental research has begun to investigate the effects of information on household behavior. The
effectiveness of practical information has been demonstrated in research on environmental hazards (e.g. Smith et al., 1995; Hamoudi et al., 2012). Meanwhile, the impacts of social norms on household behavior has been assessed within the realm of electricity and water conservation (e.g. Ferraro and Price, 2013; Allcott, 2011). In these water and electricity conservation studies, households are informed of peer use of services and how their behavior compares. There is evidence that information on social norms might be able to produce similar size effects on the quantity purchased as price incentives (Allcott and Mullainathan, 2010; Allcott, 2011).
6
how flood impacts can be mitigated and managed in the face of urbanization and climate change. Low-lying megacities, such as Bangkok, present new challenges for disaster risk mitigation. In these productive urban centers, neither massive evacuations nor limits on concentrations of people and assets are desirable. Rather than encourage relocation of people and assets, risk mitigation strategies in megacities must focus on how to reduced expected losses. Information could play a vital role in allowing individuals to take effective actions to reduce flood losses.
The 2011 Bangkok flood is an especially interesting case study because it offers a
window on the flood management challenges facing millions of people around. It represents one of the first major floods in a megacity in the twenty-first century. Asian megacities in particular are expected to face higher flood losses due to rapidly growing populations, climate change, and vulnerable low-income communities (Hallegatte et al., 2013; Shah, 2011). Slum populations face relatively high disaster losses since they tend to be located in hazard prone areas with poorly constructed dwellings. More than half of the world’s slum population lives in East and Southeast Asia (Shah, 2011). Risk mitigation measures could reduce vulnerability and expected disaster losses.
7
Chapter 1 assesses the magnitude and types of economic costs borne by households during the historic 2011 Bangkok flood. This chapter presents the first estimates of flood costs based on in-person interviews and modern nonmarket valuation techniques. It contributes to the literature by demonstrating how household-level data on the economic costs of flooding can be collected and analyzed in order to inform decision making. A worldwide lack of comprehensive cost data means that most economic assessments do not include a full picture of mitigation costs and benefits. Some countries are beginning to address this knowledge gap in order to inform flood risk mitigation policies. For example, the U.S. Army Corps of Engineers is actively exploring improved methods to estimate flood costs.
Cost estimates analyzed in this study represent a broad set of adverse consequences that extend beyond property damage. These costs include preventative costs, evacuation
expenditures, increased travel time, property damage, health costs, and foregone income. Two rounds of surveys were conducted with 469 Bangkok households. Households were first interviewed immediately after floodwaters receded and were asked about preventative actions, expenses to repair and replace property, health care costs, and time lost from work. The second interview was conducted one year later to collect additional expenses incurred to repair and replace property damaged in the flood. This chapter presents summary statistics of economic costs as well as multivariate analysis that examines factors associated with these costs, such as characteristics of the respondent, household, and neighborhood.
8
was one of the first major disasters to affect an urban area with a substantial population
connected to social media. To explore the role of online information in mitigation of flood loss, a mixed methods approach was employed, making use of both quantitative (propensity score matching and multivariate regression analysis) and qualitative (in-depth interviews) techniques. Regression analysis of survey responses identifies associations between online activity and flood losses as well as before flood mitigation actions. Propensity score matching is used to test for evidence of a causal relationship between social media use and flood losses. The study relies on two data sources – survey responses from 469 Bangkok households (also used in Chapter 1) and in-depth interviews with twenty-three internet users who are a subset of the survey participants. Understanding the effect of social media information on flood losses would have broad
implications for incorporating online applications into disaster preparedness and response efforts. For example, the U.S. Federal Emergency Management Agency is testing the use of social media for distributing emergency updates.
The third chapter shifts attention to loss mitigation actions and how households can be encouraged to take action. Private mitigation actions could play a prominent role in reducing flood impacts. Yet, even after disasters, households often fail to mitigate future losses. This chapter presents a field experiment that tests the effect of information on household uptake of flood insurance and home retrofits. A sample of 364 flood-prone households in Bangkok was randomly split into treatment and control groups. All participants were homeowners who did not have catastrophe insurance at the time of the baseline interview. The treatment group received practical details on home retrofits and subsidized flood insurance as well as social information regarding insurance purchase decisions of households in their district. The control group
9
households. Six months later, a follow-up survey recorded experiment outcomes such as insurance purchase, home retrofits, information gathering, and risk perception.
This study is the first randomized experiment to address household flood loss mitigation actions, such as home retrofits and flood insurance. Generally, experimental evaluation designs are rare in the environmental policy field (Ferraro and Hanauer, 2014). Yet, such designs are important since they are less prone to bias than observational designs. This chapter also makes a contribution to understanding flood insurance demand. Little empirical work has been done on household demand for flood insurance, especially in developing countries (Akter et al., 2011; Landry and Jahan‐Parvar, 2011; Kunreuther et al., 2013). Households tend to lack perfect information regarding flood risk and the costs and benefits associated with flood insurance and home retrofits. Information could influence perceptions of flood probability, losses, and costs of insurance and home retrofits. This study tests the hypothesis that household inaction is in part due to incomplete and insufficient information.
10
A key question that this BCA addresses is whether or not the information campaign is preferable to the status quo of government compensation for flood losses. The BCA accounts for the distribution of costs and benefits across stakeholders including new insurance policyholders, insurance providers, and the general taxpayer. Taxpayers bear the cost of the information campaign, annual expected subsidized claims and administrative costs. Insured households benefit from insurance claims, limited flood aid, and consumer surplus, but must pay subsidized premiums. The net social benefit to society is equal to the consumer surplus, less the cost of the information campaign, administrative cost of flood aid and insurance, and deadweight loss. Parameter values for the BCA are derived from datasets compiled in two previous chapters. The first is from the randomized experiment that tested the effect of the information campaign
(Chapter 3), while the second is from the household survey of costs incurred due to the 2011 flood (Chapter 1). Sensitivity analysis is conducted for all key parameters, with particular attention given to level of government flood compensation, persistence of information treatment effect, and household demand for insurance.
11
REFERENCES
Akter, S., Brouwer, R., van Beukering, P., French, L., Silver, E., Choudhury. S., and Aziz, S. (2011). Exploring the feasibility of private micro flood insurance provision in Bangladesh. Disasters, 35 (2) 287-307.
A.M. Best. (2012). Flood Losses Prompt Key Changes in Thai Insurance Industry, Best's Briefing: Global Insurance, Oldwick, N. J.
Allcott, H. (2011). Social norms and energy conservation. Journal of Public Economics, 95(9)1082-1095. Allcott, H., and Mullainathan, S. (2010). Behavioral science and energy policy. Science, 327(5970) 1204-1205.
Bernedo, M., Ferraro, P., and Price, M. (2014). The persistent impacts of norm-based messaging and their implications for water conservation. Journal of Consumer Policy. 37(3) 437-452
Bruneau, M., Chang, S., Eguchi, R., Lee, G., O’Rourke, T., Reinhorn, A., . . . von Winterfeldt, D. (2003). A framework to quantitatively assess and enhance the seismic resilience of communities. Earthquake Spectra, 19, 733-752.
Burby, R., Bollens, S., Holway, J., Kaiser, E., Mullan, D., and Sheaffer, J. (1988). Cities under Water: A Comparative Evaluation of Ten Cities' Efforts to Manage Floodplain Land Use. Boulder, CO: Institute of Behavioral Science, University of Colorado.
de Bruijn, K. (2004). Resilience indicators for flood risk management systems of lowland rivers. International Journal of River Basin Management, 2(3), 199-210.
De Sherbinin, A., Schiller, A., and Pulsipher, A. (2007). The vulnerability of global cities to climate hazards. Environment and Urbanization, 19(1) 39-64.
Department of Disaster Prevention and Mitigation (DDPM). (2013). Reported spending according to Ministry of Finance official advances to help victims of disaster emergency: Fiscal Year 2555. Bangkok, Thailand. September 30, 2013.
Dixon, L., Clancy, N., Seabury, S., and Overton, A. (2006). The National Flood Insurance Program’s Market Penetration Rate: Estimates and Policy Implications. Santa Monica, CA: RAND.
Ferraro, P. and Hanauer, M. (2014). Advances in Measuring the Environmental and Social Impacts of Environmental Programs. Annual Review of Environment and Resources, 39, 495-517.
Ferraro, P. and Price, M. (2013). Using Nonpecuniary Strategies to Influence Behavior: Evidence from a Large-Scale Field Experiment. Rev. of Econ. and Stats, 95(1) 64-73
Hallegatte, S., Green, C., Nicholls, R., and Corfee-Morlot, J. (2013). Future flood losses in major coastal cities. Nature Climate Change, 3(9), 802-806.
12
Hanson, S., Nicholls, R., Ranger, N., Hallegatte, S., Corfee-Morlot, J., Herweijer, C., and Chateau, J. (2011). A global ranking of port cities with high exposure to climate extremes. Climatic Change, 104(1) 89-111.
Intergovernmental Panel on Climate Change (IPCC). (2012). Managing the risks of extreme events and disasters to advance climate change adaptation. A special report of working groups I and II of the intergovernmental panel on climate change. Cambridge, UK: Cambridge University Press.
Kriesel, W. and Landry, C. (2004). Participation in the National Flood Insurance Program: An Empirical Analysis for Coastal Properties. Journal of Risk and Insurance, 71(3) 405–420.
Kunreuther, H., Michel-Kerjan, E., and Pauly, M. (2013). Making America More Resilient toward Natural Disasters: A Call for Action. Environment: Science and Policy for Sustainable Development, 55(4) 15-23.
Kunreuther, H., Michel-Kerjan, E., Doherty, N., Grace, M., Klein, R., and Pauly, M. (2009). At War with the Weather: Managing Large-Scale Risks in a New Era of Catastrophes. Cambridge, MA: MIT Press. Kunreuther, H., Meyer, R., Zeckhauser, R., Slovic, P., Schwartz, B., Schade, C., Luce, M.F., Lippman, S., Krantz, D., Kahn, B., and Hogarth, R. (2002). High stakes decision making: Normative, descriptive and prescriptive considerations. Mark. Lett., 13(3) 259.
Landry, C. and Jahan‐Parvar, M. (2011). Flood Insurance Coverage in the Coastal Zone. Journal of Risk and Insurance, 78(2) 361-388.
Messner, F., Green, C., Meyer, V., Tunstall, S., and van der Veen, A. (2007). Evaluating flood damages: Guidance and recommendations on principles and methods. Wallingford, UK: FLOODSite Consortium. Mileti, D. (1999). Disasters by design: A reassessment of natural hazards in the United States.
Washington, D. C.: Joseph Henry.
Miller, S., Muir-Wood, R., and Boissonnade, A. (2008). An exploration of trends in normalized weather-related catastrophe losses. In Climate extremes and society. H. Diaz, and R. Murnane, Eds., pp. 225-247. Cambridge University Press.
Munich Re Group. (2005). Topics geo, annual review: Natural catastrophes 2005. Munich, Germany. Orie, M., and Stahel, W. (2013), Case study 3. The 2011 Thai floods. In The Geneva Reports: Risk and Insurance Research. Insurers' Contributions to Disaster Reduction—A Series of Case Studies. Edited by M. Orie and W. Stahel, 30 pp., Geneva Assoc., Geneva, Switzerland.
Shah, F. (2011). Methodology report: Calculating multi hazard city risk. Washington, DC: World Bank. Smith, V., Desvousges, W., and Payne, J. (1995). Do Risk Information Programs Promote Mitigating Behavior? Journal of Risk and Uncertainty. 10(3) 203-221.
United Nations. (2015). World Urbanization Prospects: The 2014 Revision. Department of Economic and Social Affairs. New York, NY.
13
Wind, H., Nierop, T., de Blois, C., and de Kok, J. (1999). Analysis of flood damages from the 1993 and 1995 Meuse Floods. Water Resources Research, 35(11), 3459-3465.
World Bank. (2010). Climate risks and adaptation in Asian coastal megacities. Washington, DC: World Bank.
14
CHAPTER 1: ECONOMIC COSTS INCURRED BY HOUSEHOLDS IN THE 2011
GREATER BANGKOK FLOOD1
1.1 Introduction
1.1.1 Overview
This paper presents the first comprehensive estimates of the economic costs experienced by households in the 2011 Greater Bangkok flood. More generally, it contributes to the literature by presenting the first estimates of flood costs based on primary data collected from respondents of flooded homes using in-person interviews. Two rounds of interviews were conducted with 469 households in three of the most heavily affected districts of greater Bangkok. The estimates of economic costs include preventative costs, ex post losses, compensation received, and any new income generated during the flood. Median household economic costs were US$3089, equivalent to about half of annual household expenditures (mean costs were US$5261).
Perhaps surprisingly given the depth and duration of the flood, most houses incurred little structural damage (although furniture, appliances, and cars were damaged). Median economic costs to poor and non-poor households were similar as a percentage of annual household expenditures (53% and 48%, respectively). Compensation payments received from government did little to reduce the total economic losses of the vast majority of households. Two flood-related deaths were reported in our sample—both in low-income neighborhoods.
1
15
Overall, ex post damage was the largest component of flood costs (66% of total). These findings are new, important inputs for the evaluation of flood control mitigation and preventive measures that are now under consideration by the Government of Thailand. The paper also illustrates how detailed microeconomic data on household costs can be collected and summarized for policy purposes.
1.1.2 Motivation
Climate change is increasing the risks populations face from hydrological uncertainty. Water resource planners are devoting more and more attention to the development of planning protocols and procedures that can better incorporate these new uncertainties surrounding the magnitude and consequences of extreme hydrological events such as floods. A common element in all methods for addressing the implications of climate change for water resources planning is the need for better estimates of the economic costs that hydrological risks impose on households and businesses. Decision makers need accurate estimates of these economic costs in order to design and choose improved, cost-effective risk management and adaptation strategies.
Surprisingly, the methodology for estimating the economic costs to households from flood events has not advanced much over the last several decades. Although there have been major theoretical and methodological advances in nonmarket valuation techniques in the environmental and resource economics field, these have not made their way to research on the economic costs to households of major flood events. There are several reasons for this peculiar state of affairs.
First, by definition the precise timing of flood events are unknown in advance and
16
in a timely manner to study the economic costs of unpredictable flood events. Second, dealing with the humanitarian crisis created by major flood events naturally takes precedence over longer-term research objectives. Simply put, researchers have an ethical obligation not to get in the way of relief efforts.
Third, research on flood damages usually has been conducted by teams of engineers, planners, financial analysts, and infrastructure economists, and is largely focused on estimating the financial losses to buildings and contents, for both households and businesses. This is perhaps understandable when the purpose of the study is to determine financial compensation to be paid by government and insurance companies. But the resulting cost estimates will be
incomplete measures of the welfare costs imposed by the risk of floods that are needed for improved decision making.
There are no published studies of costs households incur from floods in either
industrialized countries or developing countries in which the researchers' findings are based on data collected from affected households using in-person interviews and modern nonmarket valuation techniques. Because the microeconomic literature on estimating the economic costs to households is thin, and because much of the existing research has been conducted by
noneconomists, the terminology used in the literature to describe and categorize different types of household costs due to floods is inconsistent and confusing. This study addresses these gaps in the literature on the economic costs households incur from extreme hydrological events such as floods.
17
world and for their governments in a time of climate change. There are seven megacities in South and Southeast Asia with over 10 million people located near the coast that are experiencing rapid population growth and must confront the combined threats of land
subsistence, increased extreme rainfall and storm events, and rising sea levels (Mumbai, Dhaka, Kolkata, Karachi, Manila, Jakarta, and Bangkok).
In this case study, we examine the magnitude and composition of the economic losses experienced by 469 households from the 2011 flood in three of the most affected neighborhoods of the Greater Bangkok Metropolitan area. We first interviewed individuals in these households in January and February 2012, while their memories of the flood were fresh. A second round of interviews was conducted a year later to measure additional recovery costs incurred between January 2012 and January 2013. The attrition rate between the first and second round surveys was 20%; 589 households participated in the first survey. In the first round survey, respondents were asked about the actions they took before the flood arrived to try to reduce the direct and indirect costs incurred as a result of the flood, and the financial expenses they expected in order to repair and replace their property after the flood waters receded. Questions to estimate both health-related and nonhealth-related costs were included in the survey instrument. In the second round survey, we were able to collect data on the actual expenses incurred to repair and replace property damaged in the flood, as well as time lost from work.
18 1.2 Background—The 2011 Thailand Flood
The Chao Phraya River Basin drains about 30% of the surface area of Thailand. Four main rivers—Ping, Wang, Yom, and Nan—merge in Nakhon Sawan province (in Thailand's Upper Central Region) to form the Chao Phraya River. The river begins in the northern, mountainous region of Thailand, and then flows south through the flat central plains. Greater Bangkok is located at the southern, downstream end of the Chao Phraya River Basin in the Chao Phraya river delta near the coast.
In late 2011, Thailand was hit with the worst floods experienced in 50 years (since the floods in 1942). The 2011 flood, which eventually inundated much of greater Bangkok, had three distinct phases. The first phase was from March to April when heavy rainfall caused widespread flooding in southern Thailand, resulted in 61 deaths, damaged 600,000 homes, and caused extensive damage to businesses and transportation infrastructure. Rainfall in March 2011 was over 3 times the average for the past 30 years. Land became saturated and further infiltration was limited even before the summer monsoon rains arrived. Eight provinces in Thailand were
declared disaster zones.
19
since records began in 1901. World Bank (2012) estimated the annual probability of such high rainfall to be 1 in 250 years.
Month after month of heavy rains led to widespread flooding in the northern,
northeastern, and central portions of Thailand. Major dams filled to capacity and 10 major flood control structures experienced breaches from mid-September to early October. Flash flooding and landslides occurred in central and northern Thailand. This long period of heavy rainfall also caused very high flows in the northern sections of the Chao Phraya River, and these floodwaters spread southward. By mid-September, many provinces in the central part of the basin were affected by the flood. The agricultural lands in the central plain initially served as water retention areas and slowed the southward flow of the floodwaters toward Bangkok.
20
neighborhoods, frustrated residents tore down flood barriers, sending floodwaters into other parts of the city. By late November and early December, the floodwaters had receded in many areas, but some places remained flooded until mid-January 2012.
The inability of the two major dams in the Chao Phraya basin, Bhumibol and Sirikit, to mitigate the severity of the 2011 flood has been the subject of much public discussion and debate in Thailand. Some argued that the dams had been mismanaged since a large quantity of water was stored at the beginning of the monsoon, resulting in large subsequent releases after the heavy rains occurred in the late summer and fall. Early in the 2011 monsoon season, these dams held large amounts of water in storage. During the 2010 monsoon season, rainfall had been low, and dam levels were at record lows in June 2010 (Asian Correspondent, 2011a). The Bhumibol Dam was filled to capacity in only 3 months, from August to October 2011 (Asian Correspondent, 2011b). Once the Bhumibol Dam reached capacity, heavy rains continued and releases from the dam had to be increased. Of course, had the monsoon rains in 2011 again been low as in 2010, the opposite situation would have occurred. Reservoir managers would have been criticized if they had released too much water early in the season to minimize flood control risks, and then had too little water in storage to meet irrigation needs.
21
Thailand's relatively low flood mortality risk is partly because residents in flood-prone areas of the Chao Phraya River Basin and other parts of the country have coped with regular flooding for centuries. People expect floods and have adapted to reoccurring flood events. Historically, people in flood-prone areas have constructed their homes on stilts and built two-story housing so that they can move their possessions and themselves up to the second floor during floods. Although the rural areas in the northern Chao Phraya basin are especially used to regular flooding, severe flooding in Bangkok is more infrequent. Large parts of Bangkok were inundated for 2 months in 1942 and for 5 months in 1983. Before the 2011 flood hit the Greater Bangkok Metropolitan Area, the last severe flood was in 1995. However, in 2006, other parts of Thailand experienced severe flooding. Bangkok was not affected because local rainfall was not excessive, and the city's flood protection system of canals, embankments, and pumps was able to contain the floodwaters. In 2011, many Bangkok residents (mistakenly) used the 1995 flood as a benchmark of the worst that could happen in their neighborhood.
A combination of factors has led to increasing flood risks in Thailand. Increased agricultural cultivation in the upstream portions of the Chao Phraya Basin has caused deforestation, which has resulted in a decrease in flood retention areas. Urban growth in the lower Chao Phraya basin has reduced the ability to disperse floodwaters over agricultural lands in a flooding emergency. Many canals in and around Bangkok have low gradients and are filled with silt and debris, reducing the ability of the drainage system to remove floodwaters.
22
Consultants, 2009). Most of the increase in flood-prone area is expected in western Bangkok, where flood control infrastructure is especially inadequate.
During the 2011 flood, more than 680 people were killed nationwide, and 6 million hectares (nearly 12% of the surface area of the country) were flooded over the 4 month period from September to December (A.M. Best, 2012). The 2011 Thailand flood was the fifth most costly insured loss event worldwide in the last 30 years (A.M. Best, 2012). The World Bank estimated economic losses and damages at THB1.4 trillion (US$ 47 billion, or about US$ 700 per capita) (World Bank, 2012). Thailand's annual GDP growth in 2011 declined from midyear estimates of 4.0% to 2.9%.
In the past, a major focus of flood damage mitigation has been on early warning systems to alert people of the imminent risk of flood events, and the hope has been that people could act effectively on this information before the flood arrives to reduce the costs they are likely to incur. The 2011 Bangkok flood was the first major flooding disaster to hit a population center in South or Southeast Asia in which many people were connected to the web with smart phones and other types of internet access. The flood unfolded slowly, and most households in greater
Bangkok had access to information from multiple sources—television, radio, internet, friends and neighborhood leaders, and local and national governments (television was the most
23
automobiles to higher ground (e.g., elevated motorways), and some of their possessions to the second story or roof of their dwellings. The current transportation infrastructure will not support a mass exodus, and there are few places for this many people to go. Moreover, as in many types of disasters, some people will not want to leave their homes, due in part from a desire to protect their possessions from theft.
1.3 Description of the Study Sites, Sampling, and Fieldwork
The study was conducted in three provinces of the Greater Bangkok Metropolitan Area: Nonthaburi, Pathum Thani, and Bangkok. We purposively selected three districts, one in each province, that were among the hardest hit by the 2011 flood: Bang Bua Thong District
(Nonthaburi); Klong Luang District (Pathum Thani); and Don Mueang District (northern Bangkok). Within each of these three districts, we purposively selected two middle-income neighborhoods and two low-income neighborhoods, for a total of 12 neighborhoods.
24 Table 1.1 Profile of the Study Area
Bang Bua Thong, Nonthaburi
Don Mueang, Bangkok
Klong Luang, PathumThani History of flooding Major flood in 1995 Did not flood in 1995 Flooded in 1995
When flood arrived Mid-October Late October Mid- October
Speed of rising water Fast (nearly 2 meters within 24 hours)
Moderate (80 cm within 24 hours)
Slow (50 cm within 1 week) Median depth of flood (on road) 1.5 meters
(range: 0.5 to 3 m)
1.5 meters (range: 0.5 to 3 m)
0.6 meters (range: 0.5 to 2 m)
Population of study area districts 1 201,254 166,951 120,766
Distance from Central Business
District 39 km 30 km 45 km
Elevation(meters above sea level) 0 meter 0.5 to 1 meter 2.30 meters
Number of districts flooded 4 out of 6 36 out of 50 7 out of 7
Note: 1 Population of Nonthaburi province =1,135,299; Bangkok = 5,668,502 ; and Pathum Thani =1,026,934. Source: Department of Provincial Administration
In each of the three districts, we tried to interview 200 respondents; the total target sample size was thus 600 respondents. Within each of the 12 residential areas, we set a quota of 50 respondents to be interviewed. To the extent practicable, we tried to distribute the 50
respondents in each residential area across the entire spatial area of the neighborhood. For
25
Not all households living in a “low-income” neighborhood are poor. In fact, only about half of the households in low-income neighborhoods were classified as poor.
In all three districts, during the first round of the survey the response rates were higher in low-income neighborhoods than in middle-income neighborhoods. For the low-income
neighborhoods in Bang Bua Thong District (Nonthaburi), the response rate was 93% compared to 68% in the middle-income neighborhoods (Chollada and Pattaraniwetr). In the Klong Luang District (Pathum Thani), the response rate was of 97% and 61% for the low-income and middle-income neighborhoods, respectively. For Don Mueang District (Bangkok), response rate was 91% for the low-income group and 61% for the middle-income group. The locations of all the households interviewed were geocoded. We do not claim that our final sample is representative of households either in greater Bangkok or within the three provinces. We do believe, however, that sample households span a wide range of socioeconomic and housing conditions in some of the most severely flooded neighborhoods in different parts of the city.
To assist with question selection and design, six pilot interviews were conducted during which respondents were told to “think out loud” as they answered the questions. This helped us to better understand the respondents' experience with the flood and how they interpreted the questions. Before the first round of the survey was implemented, the survey instrument was pretested with 36 respondents. During the actual first-round survey implementation four field staff supervised 18 enumerators. All of the first-round interviews were conducted during January and February 2012, soon after the floodwaters had receded from respondents' houses. On
26
1.4 Definitions, Calculations of Economic Costs Incurred by Households, and Modeling Strategy
1.4.1 Terminology
There is no standardized methodology to estimate the economic costs of floods (White et al., 2001). Nor is there a standardized terminology used to describe the adverse consequences of floods. When estimating the economic consequences of a flood event, one should consider the effects on households' well-being in three time periods, or stages of the event—(1) before the flood arrives; (2) during the flood, (3) after the floodwaters recede. We use the term “economic costs” as inclusive of the negative consequences of a flood in all three of these stages. We refer to the costs incurred before the flood arrives (stage 1) as ex ante costs; and costs incurred after the flood hits as ex post costs during the flooding event and after the floodwater recede, (stages 2 and 3, respectively).
27 Figure 1.1 Economic cost, loss, and damage categories
Households make financial expenditures before the flood to reduce economic losses after the flood arrives. They also make financial expenditures after the flood has hit in order to deal with the economic losses they have suffered. Both types of financial expenditures are
components of the total economic costs of the flood event. Preventative (ex ante) expenditures made before the flood arrives are real costs to the household, but are not best conceptualized as “damages” or “losses.” Expenditures made after the flood hits to deal with the consequences are one monetary measure of the magnitude of the losses incurred by the household, but such expenditures are not a comprehensive or complete measure of the ex post loss incurred because residual losses may remain even after financial expenditures have been made to reduce the losses (damages).
Economic Cost
Loss
Damage
Before + During + After
During + After
28
Some of the engineering literature on the costs of floods separates ex post costs incurred into tangible and intangible components based on the extent to which the consequences of the flood can be expressed in monetary terms Dutta et al. (2003); (Smith and Ward, 1998; Thieken et al., 2005). Tangible losses include damages to property, buildings, and business interruptions that can be expressed in financial terms. Intangible losses are more challenging to monetize and include, for example, mortality and psychological suffering. However, over the past few decades, nonmarket valuation techniques (both revealed and stated preference methods) have experienced continual methodological improvements, and losses that once were considered impossible to quantify in monetary terms (and thus “intangible”) may now be counted as “tangible” and expressed in monetary, welfare-theoretic terms (Hanemann, 1992; Smith, 2004). For example, in the past, some studies of flood losses considered mortality and morbidity losses to be
29
as depreciated property and business values (White et al., 2001). For households with insurance coverage, insurance claims can sometimes be used as a measure of some components of property damages.
In this study, we classify economic costs using three distinctions:
(i) Timing: before the flood arrives (ex ante); during the flood (ex post), and after the floodwaters recede (ex post),
(ii) Direct and indirect,
(iii) Health-related and nonhealth-related.
We do not attempt to classify economic costs as “tangible” versus “intangible” costs. Nor do we report damages separately from losses, although we do use both these two terms (as defined above). Finally, we do not report “financial expenditures” separately; but these are closely associated with our category of “direct costs.”
1.4.2 Calculation of Household Economic Costs
We used the data obtained from the first and second rounds of the household survey described above and other data obtained from secondary sources to estimate the economic costs that sample households incurred as a result of the 2011 Thailand flood. Our estimates of the economic costs include both ex ante (pre-flood) expenditures and other costs incurred to reduce
ex post economic losses (e.g., damages to property, health, and forgone income incurred during and after the flood). We do not include residual damages, i.e., property damages that households do not plan to repair after the flood event, or any property damages that remain after repairs and rehabilitation efforts are complete.
We report estimates for five categories of flood-related economic costs: (1) ex ante
nonhealth-30
related losses after the flood, (4) ex post health-related losses both during and after the flood; and (5) household contributions to community (both ex ante and ex post). We further report the direct and indirect costs associated with each of these five components. In addition, some households received compensation from government and other sources, which is a transfer payment to the household that reduces the total household costs. A very small number of sample households may have received payments from insurance companies for the property damages they incurred.
31
Table 1.2 Components of Total Economic Costs Incurred by Households Cost Component Equation
Total Economic Cost = A+B+C+D+E
A. Preventative Costs (Ex ante)
Direct
Hired labor = # of days * minimum daily wage of THB 300
Materials & Activities
Parking car in alternate location
Preventative materials (sandbags, pumps, etc.) = total preventative materials cost/ 2
Indirect
Own labor = # of days * monthly income/ 22 days
Volunteer labor = # of days * THB 300 per day
B. During-Flood Economic Loss (Non-health related)
Direct
Preparation expenditures
Alternate accommodation (shelter)
Kitchenware, food supplies, boats, clothing
Other (sandbags, pumps, construction materials) = total preventative materials cost / 2
Increased work commute costs = Δ work commute costs * # flooded days
Increased cost to travel home = Δ home travel costs * # of trips home
Increased food cost = Δ weekly food costs * flood duration
Indirect
Increased travel time to work = Δ commute time * (flood duration*(5/7) –holiday – work days missed)* (monthly income/22 days) Increased travel time to house = Δ time to travel home * # trips * opp. cost of time a
Foregone income
C. After-Flood Economic Loss (Non-health related)
Direct
Car Repairs
Housing and belongings damage
Hired labor for moving + repair = # of days * THB 300 per day
Cost to repair, clean, replace
Indirect
Housing and belongings damage
Own labor for moving + repair = # of days * monthly income/ 22 days
Volunteer labor for moving + repair = # of days * THB 300 per day
D. Health-related Cost
Direct: Doctor visits; medicine
Indirect: Foregone income of patient c and care taker = # of days * opp cost of time b
E. Household contributions to community
Direct: Cash contribution and volunteer time =contribution + ( # of days * THB 300 per day)
Cash contribution
32
Preventative costs comprised ex ante expenditures and self-supplied labor to prepare for the arrival of the floods and hopefully mitigate losses. Households parked cars in alternate locations and purchased goods to prepare for the flood such as construction materials, sandbags, and small boats. Nonhealth related economic costs during the flood included expenditures for alternative shelter, materials to cope with flooding, emergency food and drinking water, and increased travel costs. Foregone income due to days of worked missed was also included for respondents who were wage workers, self-employed, or business owners. Direct nonhealth-related losses during the flood included coping costs (shelter, supplies, etc.), increased expenses to commute to work and home, and increased food expenditure. Indirect nonhealth-related losses during the flood included increased travel time to work and home as well as foregone income due to not being able to commute to work.
Ex post nonhealth-related economic losses included expenditures for car repairs and to repair, clean, and replace housing and other property damage. Ex post health-related costs were based on the information reported by survey respondents about flood-related diseases
experienced by household members. Expenditures on medicine and doctor visits were included in direct costs, while indirect costs were comprised of foregone income of the patient and caretakers. As for indirect nonhealth-related losses, respondent's time was valued based on self-reported income, and for sick household members other than the survey respondent, time was valued at the minimum daily wage rate of THB 300 (US$ 9.7).
33
Some households were able to generate new income during the flood, by offering needed goods and services such as prepared food and boat transport. The net economic costs experienced by a household are the total costs minus any compensation received or new income generated.
In summary, our estimates of the costs incurred by households in the 2011 Bangkok flood go far beyond the typical engineering estimates of financial damages to households' dwellings and contents. Notably, they include:
(i) Not only ex post costs, but also ex ante expenditures; (ii) Health-related costs;
(iii) Productivity losses due to lost work and illness; and
(iv) Households' coping costs for alternative shelter and supplies when they were forced to leave their homes.
Households' payments for flood insurance can be considered one measure of the perceived ex ante costs of flooding risks. We have not included these payments because (1) few households (less than 1%) in Bangkok had flood insurance at the time of the 2011 flood (Orie and Stahel, 2013); (2) the policies were subsidized, and thus not a good measures for estimating expected real costs; (3) information was not collected on insurance company payments for property
damage. Including insurance payments to households as a cost component would result in double counting real resource costs.
34
the public health field (Poulos et al., 2011). Of course, the costs borne by households are not the total economic costs of the flood event. For example, they do not include foregone production or property damages in the flooded industrial districts of Bangkok.
1.4.3 Modeling Strategy: Factors Associated With Preventative Costs and Household Economic Losses
We used regression analysis to estimate the association between preventative costs and whether the household received a provincial-level flood warning, and respondent, household, and neighborhood characteristics. Our model specification was:
𝑃𝑟𝑒𝑣𝑒𝑛𝑡𝐶𝑜𝑠𝑡 = β0 + β1 𝑤𝑎𝑟𝑛𝑖𝑛𝑔 + γ𝑗X𝑗+ 𝜇𝑘H𝑘+ ω𝑚V𝑚 (1.1) where PreventCost = total preventative costs incurred by household
warning = household received a district-level flood warning or not Xj = personal characteristic j (e.g. education level)
Hk = household characteristic k (e.g. annual expenditure, number of cars owned)
Vm = neighborhood controls
We expected information in the form of provincial-level flood warnings to increase the magnitude and effectiveness of preventative actions. However, in addition to being aware of the flood risk, households can only take carefully considered preventative actions if they are
35
related to previous flood experience due to correlation with household income and
neighborhood. Higher-income households tended to have shorter residence periods in their current homes and therefore tended to have less previous flood experience. The household decision to undertake flood mitigation measures is also influenced by expectations regarding responsibility for flood control and response, i.e., whether these responsibilities lie more with individual households or the government.
In order to determine which factors were associated with losses incurred during and after flooding, ex post household economic losses were regressed on characteristics of the respondent, the household, and the neighborhood. We also included depth of flood and whether the
household received a provincial-level flood warning. Our model specification was:
𝐹𝑙𝑜𝑜𝑑 𝐿𝑜𝑠𝑠 = β0 + β1 𝑤𝑎𝑟𝑛𝑖𝑛𝑔 + β2𝑓𝑙𝑜𝑜𝑑 𝑑𝑒𝑝𝑡ℎ + γ𝑗X𝑗 + 𝜇𝑘H𝑘+ ω𝑚V𝑚+ ε (1.2)
where Flood Loss = total ex post flood loss (costs incurred during and after the flood)
warning = district-level flood warning received
flood depth = Depth of flood water (first floor of house)
Xj = personal characteristic j (e.g. education)
Hk = household characteristic k (e.g. annual expenditure, number of
cars owned)
Vm = neighborhood controls
36
constrained by its income. A similar model was specified for total flood costs (preventative costs plus flood loss):
𝑇𝑜𝑡𝑎𝑙 𝐹𝑙𝑜𝑜𝑑 𝐶𝑜𝑠𝑡 = β0 + β1 𝑤𝑎𝑟𝑛𝑖𝑛𝑔 + γ𝑗X𝑗+ 𝜇𝑘H𝑘+ ω𝑚V𝑚+ ε (1.3)
Table 1.3 provides definitions and summary statistics for all variables included in the
preventative expenditure, ex post flood loss, and total flood cost models (i.e., equations 1.1 to 1.3). Preventative costs were excluded from the ex post loss model (equation 1.2) due to
endogeneity concerns. We do not have good, household-specific measures of either the objective or perceived flood risk. Therefore, there is the possibility that households with higher
preventative costs knew that they were at greater risk, especially in Klong Luang, and thus spent more ex ante on mitigation strategies. Since preventative costs are a function of flood risk, and people act on perceived flood risk, establishing a causal relationship between preventative expenditures and ex post losses is challenging. This is a common problem in flood cost estimation studies, and we do not claim to have a compelling identification strategy.
Nevertheless, we believe that the association between preventative expenditures and ex post
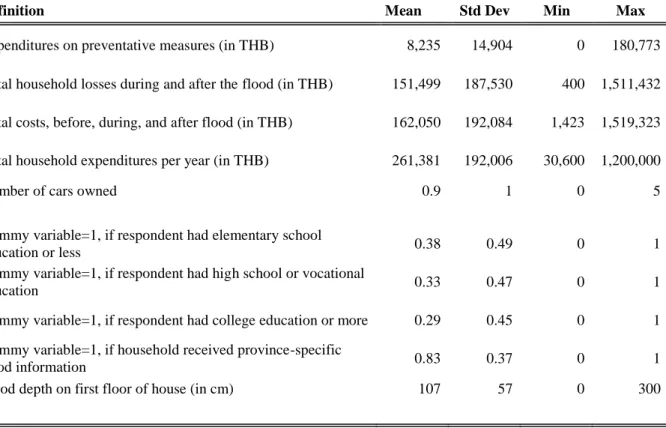
Table 1.3 Summary Statistics of Regression Variables (Obs = 469)
Definition Mean Std Dev Min Max
Preventative Cost Expenditures on preventative measures (in THB) 8,235 14,904 0 180,773
Ex Post Losses Total household losses during and after the flood (in THB) 151,499 187,530 400 1,511,432
Total Flood Losses Total costs, before, during, and after flood (in THB) 162,050 192,084 1,423 1,519,323
Annual Household expenditures Total household expenditures per year (in THB) 261,381 192,006 30,600 1,200,000
Cars owned Number of cars owned 0.9 1 0 5
Education Level
Elementary or less Dummy variable=1, if respondent had elementary school
education or less 0.38 0.49 0 1
High School or Vocational Dummy variable=1, if respondent had high school or vocational
education 0.33 0.47 0 1
College or more Dummy variable=1, if respondent had college education or more 0.29 0.45 0 1
Flood warning (district-specific) Dummy variable=1, if household received province-specific
flood information 0.83 0.37 0 1
Flood depth (first floor) Flood depth on first floor of house (in cm) 107 57 0 300
38 1.5 Results
1.5.1 Socioeconomic Profile of Respondents
Respondents were located in both middle-income neighborhoods (220 households) and low-income neighborhoods (249 households). The 220 respondents living in middle-income neighborhoods were mostly self-employed or employed by businesses in the private sector. The average monthly expenditure of middle-income households (estimated using data from the second-round of the survey) ranged from THB 50,843 in Klong Luang to THB 82,053 in Bang Bua Thong to THB 156,391 in Don Mueang.
Most respondents in low-income neighborhoods were wage workers; about a quarter were self-employed. The average monthly expenditure of households in low-income
neighborhoods of Bang Bua Thong and Don Mueang (THB 11,643 and THB 12,412,
respectively) were significantly lower than in Klong Luang district (THB 15,238). The years of education and household expenditures of the respondents in middle-income neighborhoods were significantly higher than of respondents in low-income neighborhoods.
39
(US$ 9590) and THB 317,000 (US$ 10,280), respectively. Average house values for Bang Bua Thong were slightly higher (THB 368,000; US$ 11,946).
1.5.2 Total Economic Costs from the 2011 Flood
40
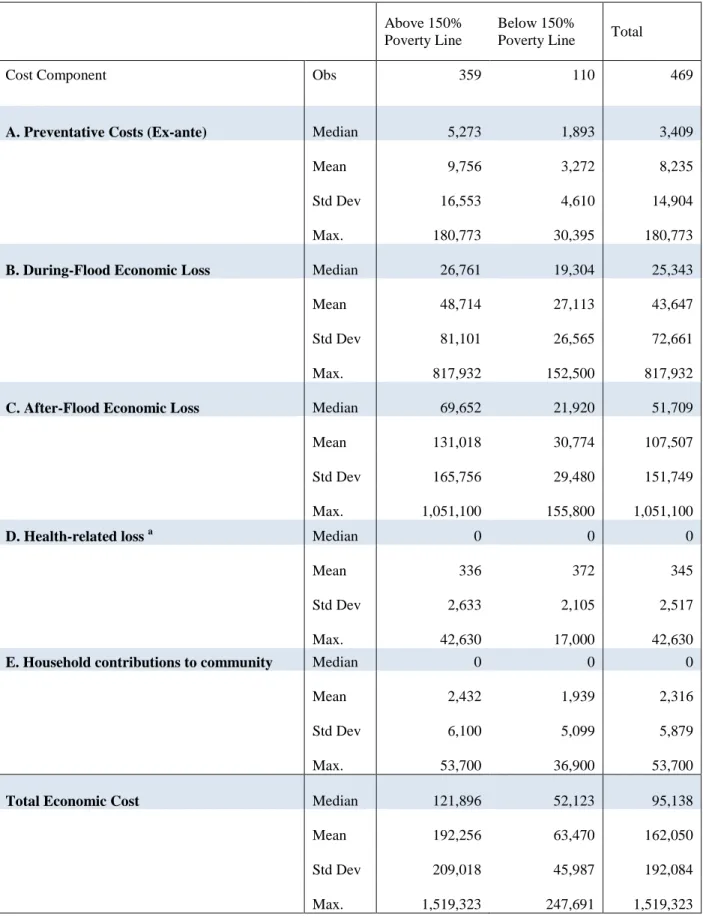
Table 1.4 Summary Statistics of Economic Cost Components, by poverty status
Above 150% Poverty Line
Below 150%
Poverty Line Total
Cost Component Obs 359 110 469
A. Preventative Costs (Ex-ante) Median
5,273 1,893 3,409 Mean 9,756 3,272 8,235 Std Dev 16,553 4,610 14,904 Max. 180,773 30,395 180,773
B. During-Flood Economic Loss Median
26,761 19,304 25,343 Mean 48,714 27,113 43,647 Std Dev 81,101 26,565 72,661 Max. 817,932 152,500 817,932
C. After-Flood Economic Loss Median
69,652 21,920 51,709 Mean 131,018 30,774 107,507 Std Dev 165,756 29,480 151,749 Max. 1,051,100 155,800 1,051,100
D. Health-related loss a Median 0 0 0
Mean 336 372 345 Std Dev 2,633 2,105 2,517 Max. 42,630 17,000 42,630
E. Household contributions to community Median 0 0 0
Mean 2,432 1,939 2,316 Std Dev 6,100 5,099 5,879 Max. 53,700 36,900 53,700
Total Economic Cost Median
41 Table 1.4 (Continued)
Above 150% Poverty Line
Below 150%
Poverty Line Total
Total Economic Cost (continued)
Direct Median
80,200 30,807 59,000 Mean 139,874 37,822 115,939 Std Dev 169,797 33,501 155,530 Max. 1,088,700 176,800 1,088,700
Indirect Median
27,158 18,178 24,545 Mean 52,382 25,648 46,112 Std Dev 83,724 25,207 75,091 Max. 807,023 167,159 807,023
Total Economic Cost (% annual
expenditures) Median
0.48 0.53 0.48 Mean 0.65 0.60 0.64 Std Dev 0.5 0.4 0.5 Max. 2.8 2.6 2.8
Total Economic Cost (% annual income) Median
0.27 0.25 0.26 Mean 0.35 0.31 0.34 Std Dev 0.3 0.2 0.3 Max. 3.0 1.4 3.0
Dwelling-Related Cost (% of house value) Obs
42 Table 1.4 (Continued)
Above 150% Poverty Line
Below 150%
Poverty Line Total
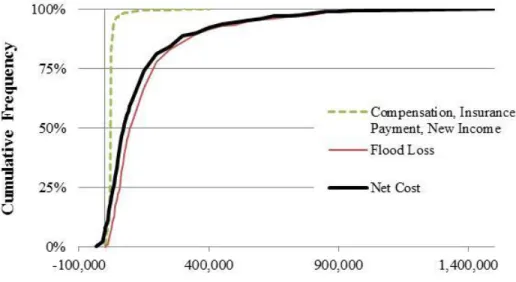
F. Compensation Median
25,000 24,250 25,000 Mean 22,973 21,450 22,616 Std Dev 9,536 6,279 8,897 Max. 125,000 35,000 125,000
New Income During Flood Median 0 0 0
Mean 739 326 642 Std Dev 5,623 2,895 5,116 Max. 80,000 30,000 80,000
Net Economic Cost Median
93,987 31,711 71,789 Mean 166,004 41,395 136,778 Std Dev 206,113 46,154 189,174 Min (33,347) (26,138) (33,347) Max. 1,496,323 222,691 1,496,323 a
43
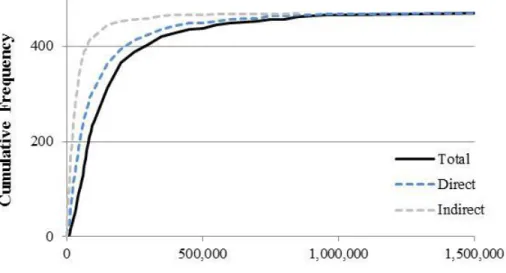
For most households, direct costs were greater than indirect costs (Figure 1.2). As a proportion of annual household expenditure, median costs were 48% of annual expenditure. As a percentage of annual household income, median costs were 26%. A considerable number of households incurred high costs relative to annual expenditure (Figure 1.3). About 18% of households had costs that were equivalent to or greater than their annual expenditure, while only 2% of households had costs that were equivalent to or greater than twice their annual
expenditure. The cost of house repairs was surprisingly low given the depth and duration of the floods (Tables 1.4 and 1.5). Median house repair costs as a percent of house value were 2% (mean of 8%). Most houses incurred little structural damage.
Figure 1.2 Frequency of total, direct, and indirect costs
1.5.3 Composition of Economic Costs
The total household economic cost was subdivided into five components: (1) ex ante
44
(5) household contributions to community (both ex ante and ex post). The largest component was the ex post nonhealth-related losses after the flood, which accounted for 66% of mean household total cost, followed by nonhealth losses during the flood (27% of mean total cost) (Figure 1.4, Panel A).
Figure 1.3 Frequency of total, direct, and indirect costs as a percentage of annual expenditure
Median nonhealth-related losses after the flood were about THB 51,700 (US$ 1680). Damage to homes and belongings was by far the largest component of ex post economic loss. Particularly high losses were incurred for replacement of furniture, cleaning of home, and replacement of electrical appliances.
45 Figure 1.4 Composition of mean household costs Panel A. Full sample
Panel B. By poverty category
46
households had no foregone income during the flood largely because salaried employees were able to collect their salary even when they missed work due to the flood. It is therefore the
organizations that employed salaried workers that bore these losses. Only 5% of households were estimated to have foregone income over THB 100,000.
Few households experienced health-related losses. Only 52 households (11% of the sample) had at least one member who suffered from an illness or accident that the respondent attributed to the flood. In total, 62 disease episodes or accidents were reported and attributed to flood-related causes. Of these, 36 households (58%) reported incurring health costs. The majority of reported episodes were due to one of two causes: (1) Tinea pedis, a contagious skin infection caused by ringworm fungus, (23 cases), or (2) accidents (13 cases). In addition, rheumatism and muscular pain, common colds, and diarrhea were reported by several
households, but it is difficult to know the proportion of these cases that were actually due to the flood. Two flood-related deaths were reported. One was due to electrocution and the other due to cramps that resulted in drowning. Both cases involved the death of the head of household and were in the poor neighborhoods of Bang Bua Thong in Nonthaburi. We have not adjusted our estimates of household economic losses using the value of a statistical life (VSL) in Bangkok (Vassanadumrongdee and Matsuoka, 2005) to include these two deaths. Had we done so, the total economic losses experienced by the households in our sample would have been much higher (roughly double).