COMMUNITY ASSEMBLY AND VEGETATION PATTERNS ACROSS SPACE AND TIME IN THE LONGLEAF PINE ECOSYSTEM
Kyle Ann Palmquist
A dissertation submitted to the faculty at the University of North Carolina at Chapel Hill in partial fulfillment of the requirements for the degree of Doctor of Philosophy in Ecology in the
Curriculum for the Environment and Ecology.
Chapel Hill 2014
Approved by:
Robert K. Peet
Alan S. Weakley
Allen Hurlbert
Steve Mitchell
ABSTRACT
Kyle Ann Palmquist: Community assembly and vegetation patterns across space and time in the longleaf pine ecosystem
(Under the direction of Robert K. Peet and Alan S. Weakley)
Community assembly is the process in which species are filtered into ecological
communities. Multiple processes, which often operate at different spatial and temporal scales,
are thought to act synergistically to influence the number and identity of species in local
communities. Thus, a key challenge in ecology is to identify those processes and determine their
relative importance. Here, I document vegetation patterns in the longleaf pine ecosystem and
quantify the relative importance of multiple ecological processes structuring those patterns.
Chapters 2 and 3 explore how fire frequency, soil properties, and drought have influenced
species richness and composition patterns across ~ 20 years in longleaf pine plant communities
located in southeastern North Carolina. This work also informs land management agencies on
best practices for implementing prescribed fire to maintain plant species richness. Chapter 4 uses
849 vegetation plots to determine how soil properties, climate, and biogeographic history
simultaneously shape species richness across the longleaf pine range. This work reflects on
where species richness is highest and identifies what processes drive differences in species
richness across latitude. Chapter 5 uses species co-occurrence metrics to quantify the relative
importance of stochastic processes in assembling longleaf pine plant communities by examining
whether competition, environmental filtering, and stochastic processes shift in relative
longleaf pine communities and then extends those findings by drawing parallels to other
species-rich grasslands. Local environmental filtering (e.g., soil properties) emerged as the most
consistent and important factor structuring both species richness and species composition
patterns across time and space. However, competition, climate, stochastic processes, fire
frequency, and biogeographic history explained additional variation in species richness and
composition unaccounted for by soil properties. As predicted, the relative importance of
processes changed with spatial scale: environmental filtering became more important at larger
spatial grains, while competition, stochasticity, and fire frequency became more important as
spatial grain decreased. Thus, these results suggest vegetation patterns and their drivers are
scale-dependent and community patterns in the longleaf pine ecosystem are shaped concurrently and in
ACKNOWLEDGEMENTS
Countless people have helped make my graduate career at UNC Chapel Hill successful,
rewarding, and fun. This work would not have been possible without the support,
encouragement, and collaboration of several outstanding people.
First and foremost, I would like to thank the members of my committee. My co-adviser
Bob Peet has taught me so much over the years, both about ecology and how to be an
independent, motivated scientist, along with generally being an inspiration. I attribute much of
the success I have had in graduate school to the support and opportunities Bob has given me.
Thank you! Alan Weakley, also my co-adviser, has been a thoughtful and supportive listener and
has greatly increased my knowledge about conservation, vegetation of the southeastern US, and
the longleaf pine ecosystem. I am very grateful to have been given the opportunity to work with
these two great ecologists. Many thanks to my other committee members: Allen Hurlbert, Steve
Mitchell, Tom Wentworth, and Aaron Moody. Allen Hurlbert provided excellent feedback on
each chapter and greatly improved the quality and presentation of this dissertation. Thanks to
Allen for getting me to think more “big picture” and helping to grow my interests in
macroecology and biogeography. I am grateful to Steve Mitchell for his valuable feedback,
support, and for expanding my knowledge of ecosystem ecology. Thank you to Tom Wentworth,
who served on my committee for several years. I am grateful to have gotten to know and work
This dissertation would not have been possible with the support of several funding
agencies. First and foremost, I would like to thank the Curriculum for the Environment and
Ecology for taking me on as a student. Special thanks to Kathleen McNeil and Jaye Cable, who
have done an incredible job re-building the Curriculum. It has been a true pleasure to be a part of
the Curriculum and I will always look back on this time with fond memories. Many thanks to the
Biology Department, who employed me as a teaching assistant for several years during my time
at UNC. In addition, this dissertation would not have been possible without several Biology
Department fellowships including, the Mrs. Coker Fellowship, the Dr. Coker Fellowship, the
Alma Beers Scholarship, and the Gwendolyn Burton Caldwell Graduate Scholarship, which
supported me during the beginning and end of my graduate career, during summer field work,
and allowed me to travel to share my research with others. My first summer of field work was
funded by Norm Christensen through a Department of Defense grant. Thanks to Norm and to
several people at Environmental Management on Camp Lejeune for making my work on Camp
Lejeune possible and enjoyable. Special thanks to the North Carolina Native Plant Society for
funding that allowed me to re-sample plots in the Green Swamp Preserve in 2013.
In addition to being part of the Curriculum for the Environment and Ecology, I had the
pleasure of being a member of the Plant Ecology Lab (PEL) at UNC. My best experience in
graduate school was being a part of a big lab full of amazingly supportive and intelligent peers.
To all the members of PEL, past and present, thank you for your support, encouragement, and
friendship. To Brenda and Jackie: I will always remember our trip to Baja with a smile. Glad I
could be your “momma”. Thanks to Caroline and Brooke for our lunch and coffee breaks that
kept me sane during my early years of graduate school. Megan, Stephanie, and Liz provided
the rock of PEL, a database whiz, and an incredibly kind and thoughtful person. Thanks to my
writing and work pals, Peter, Bianca, and Naomi, who are not only peers, but also dear friends.
To Sam- I have truly enjoyed our collaborations and am grateful to have gotten to know you and
work with you. I hereby pass on the official title of lab mom to the ever competent Dennis- enjoy
and keep the traditions alive!
I would like to thank all of the landowners and land management agencies that granted
me access to their properties to conduct my field work. Thanks to managers at the Croatan
National Forest, North Carolina Wildlife Resource Commission, The Nature Conservancy, Cedar
Island National Wildlife Refuge and North Carolina State Parks. Special thanks to Angie Carl
and Margit Bucher, who worked with me to implement prescribed fire in Big Island Savanna, so
I could re-sample permanent plots consistently six months after fire.
My field work in the summer of 2009 would not have been possible with the help of my
amazing field assistant, Courtney Colwell. Thank you Courtney, for your positive attitude, work
ethic, organizational skills, and botanical expertise. Without you, I would have undoubtedly
missed plants and lost chaining pins. In subsequent years, several volunteers helped me collect
the data used in this dissertation: Whitney Brown, Diane Palmquist, Bianca Lopez, Naomi
Schwartz, Brenda Wichmann, Jackie White, Jan Goodson, Steve Mitchell, Jean Lynch, and
Susan Gale. Thank you for your time and dedication! Thanks to Bob Peet, Alan Weakley, and
Richard LeBlond, who took me out in the field and taught me how to identify tiny vegetative
Asteraceae basal rosettes. Thanks to Bob especially, who also joined me for several days of field
work in the Green Swamp in Preserve and has now sampled two plots three times in 25 years.
many volunteers who participated and collected data during the Carolina Vegetation Survey
(CVS) PULSE events.
I’ve had the opportunity to collaborate with several other people during my time here at
UNC and would like to acknowledge these outstanding persons. First, I would like to thank all of
the student participants of the NSF-funded Dimensions of Biodiversity Distributed Graduate
Seminar (DBDGS). Being a part of this seminar and working with you has been both
enlightening and enjoyable. I’ve learned a lot about biodiversity science and how to form
effective collaborations. To Jes Coyle, Bianca Lopez, Peter Wilfahrt, Fletcher Halliday, and
Allen Hurlbert: I truly enjoyed our meetings, discussion, and promise in the future I will try to
keep my mouth shut more. In addition, I would like to thank Susan Carr, who collected a lot of
the data used in Chapter 4 and has taught me a lot about the longleaf pine ecosystem. Thanks to
Jen Costanza, who generously shared her fire history data set from the Onslow Bight region with
me.
I am lucky to have such an amazing group of friends who supported me and traveled with
me on my graduate school journey. First and foremost, I would like to thank Emily Wallace.
Emily straddles the line between family and friend and is one of the first people I call during
times of crisis and success. I am so happy graduate school brought me to North Carolina to meet
you Emily. I wrote a large portion of my dissertation in Emily’s company and without her
support this dissertation would not have gotten completed when it did. To my other dear friends:
Kate, Whitney, Katy, Erin, Noah, Carly, Kristen, Nicolette- thank you!! Whitney witnessed the
up and downs of my graduate career, always encouraged me, and distracted me with a lot of fun
hiking and backpacking trips in the mountains. Kate is an amazing listener and I am truly
an adventurous play mate. Thanks to Katy for hiking with me in Shenandoah and generally being
a fun-loving person. You have inspired me to have more “leisure” time. Thanks also for the
delicious pies! Noah, my running and beer drinking pal- It’s been great getting to know you over
these last years. Erin- you inspire me to be a better ecologist. You are also an awesome lady and
I’m glad UNC brought you into my life. To my high school friends- Carly, Kristen, and Nicki-
you set the bar high academically, it’s only fair I get a PhD after your J.D., PharmD, and PhD in
Neuroscience. I love you ladies! Lastly, I would like to thank all of the CEE and Biology
graduate students over the years for their support and friendship and for making graduate school
a more rewarding experience.
My family has been my rock during the trials and tribulations of graduate school. Thanks
to my brother Eric, who doesn’t live close by, but in always close in my heart. Two years ago,
Atlas, my crazy, but sweet Catahoula Leopard Dog, came into my life. He has brightened my
world and kept me calm. This degree would not have been possible without the steady support of
my husband, Doug Moody. Thank you for loving me unconditionally and for sacrificing for me
during the last several years. I’m not sure what I love more, you or your tempeh almondine.
Finally, I would like to acknowledge my incredible parents, John and Diane Palmquist, who are
the best parents any person could wish for. Smart, adventurous, generous, and extremely kind:
TABLE OF CONTENTS
LIST OF TABLES...xiii
LIST OF FIGURES...xiv
CHAPTER 1: INTRODUCTION...1
REFERENCES...8
CHAPTER 2: FIRE FREQUENCY AND ENVIRONMENTAL FILTERING DRIVE VEGETATION PATTERNS ACROSS TIME AND SPACE IN LONGLEAF PINE WOODLANDS...12
Abstract...12
Introduction...13
Methods………...………...……16
Study Area……….………16
Sampling Design and Vegetation Data……….……….…16
Environmental and Fire History Data………17
Analysis……….………….19
Results...23
Species Richness………23
Species Composition………..……24
Discussion...27
REFERENCES...40
Abstract………...45
Introduction………46
Methods………..49
Study Area……….………49
Sampling Design………51
Analysis………..………52
Results……….56
Species Richness and Frequency Patterns over Time………56
Species Richness and Frequency in Drought vs. Non-drought Years………...…………57
Disentangling the Effects of Long-term Drought and Reduced Fire Frequency………...57
Discussion………...………59
REFERENCES………...72
CHAPTER 4: SPECIES RICHNESS PATTERNS ARE SHAPED BY LOCAL, REGIONAL, AND HISTORICAL PROCESSES ACROSS SPACE IN THE LONGLEAF PINE ECOSYSTEM……….………...77
Abstract………...77
Introduction……….78
Methods………..………81
Study Area……….………81
Vegetation History……….82
Vegetation and Environmental Data…………..………83
Building Regional Species Pool……….………84
Analysis……….……….86
Discussion………..…….………89
REFERENCES…….……….……….99
CHAPTER 5: FIRE FREQUENCY AND SPATIAL SCALE MEDIATE THE STRENGTH OF DETERMINISTIC AND STOCHASTIC PROCESSES IN LONGLEAF PINE WOODLANDS………102
Abstract……….102
Introduction………...………103
Methods………108
Study Area………...………108
Vegetation Data………...………108
Fire History Data……….……….………109
Analysis………110
Results………...………113
Discussion………...………..116
REFERENCES……….126
CHAPTER 6: CONCLUSIONS AND SYNTHESIS………..131
APPENDIX A. GROWTH FORM ASSIGNMENTS FOR CHAPTER 2 SPECIES………..………..147
APPENDIX B.PERCENTAGE OF SUBPLOTS OCCUPIED BY SPECIES FROM 1985-2013………....………158
APPENDIX C. OBSERVED AND SIMULATED C-SCORES FOR CHAPTER 5…...…170
LIST OF TABLES
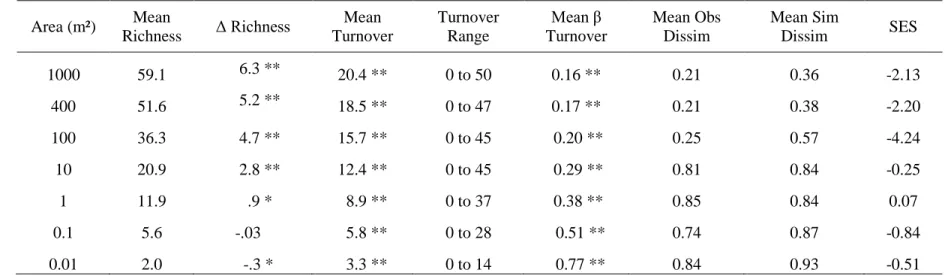
Table 2.1: Changes in species richness and beta-diversity from the 1990s to
2009 across multiple spatial grains in southeastern NC……….32
Table 2.2: Mean species richness, raw turnover, and beta turnover summarized
by community type at 100, 400, and 1000 m² in southeastern NC……….33
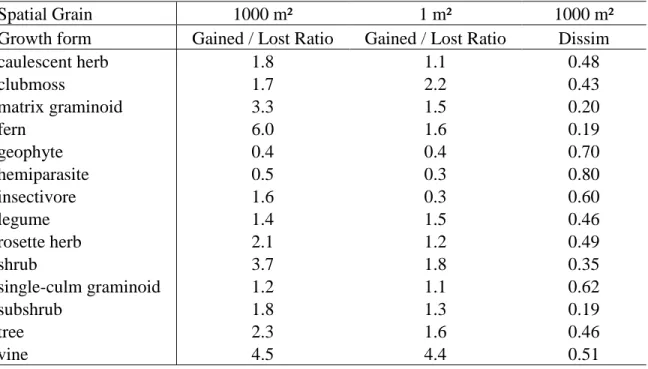
Table 2.3: Number and types of species gained and lost over time summarized
by growth form at 1 and 1000 m² in southeastern NC………34
Table 3.1: Average number of species lost and gained over time at each spatial
scale in Big Island Savanna from 1985 to 2013…….…………...……….65
Table 3.2: Mean number of species of different growth form, plant height and
habitat affinity in 0.25m² subplots in Big Island Savanna……..………66
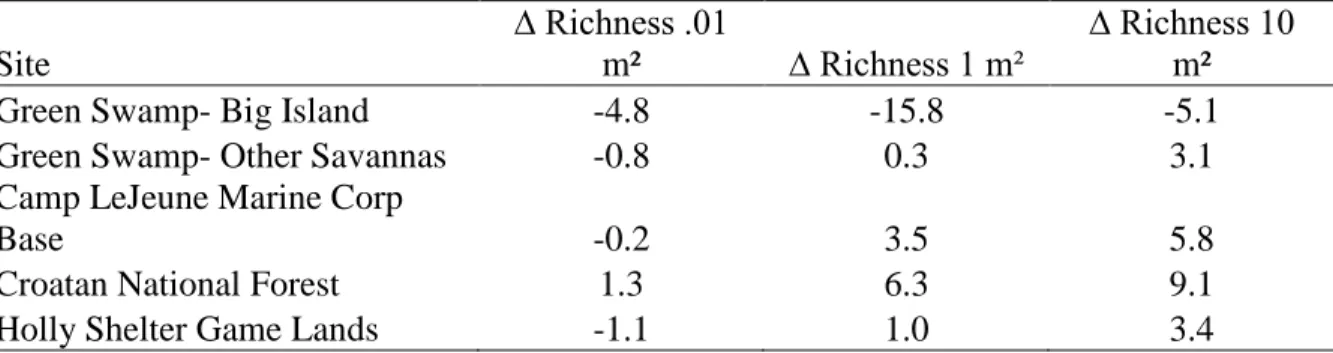
Table 3.3: Mean change in richness at three spatial scales from 1993 to 2009 for
Ultisol savannas in the southeastern Coastal Plain of NC…….……….67
Table 4.1: Species pool size for each ecoregion, community type, and
ecoregion-community type combination………...……….93
Table 4.2: Predictors at 1 and 100 m² that explained the most variation in species
richness across all plots and each of the four ecoregions in the southeastern US…………..94
Table A.1: Growth form assignments to all 398 taxa in the data set for Chapter 2……….147
Table B.1: Percentage of 0.01m² subplots occupied by all species from 1985-2013…………..158
Table B.2: Percentage of 0.25m² subplots occupied by all species from 1985-2013…….…….162
Table B.3: Percentage of 1m² subplots occupied by all species from 1985-2013……...………166
Table C.1: Observed and simulated C-score values for each broad community type
LIST OF FIGURES
Figure 2.1: Study area in the outer Coastal Plain of North Carolina showing
plot locations of 59 CVS plots………35
Figure 2.2: Longleaf pine vegetation can be partitioned into broad community
types based on soil moisture and soil silt percentage……….…36
Figure 2.3: Change in species richness over time at 1000 m² versus silt percentage
and fire frequency…………...………37
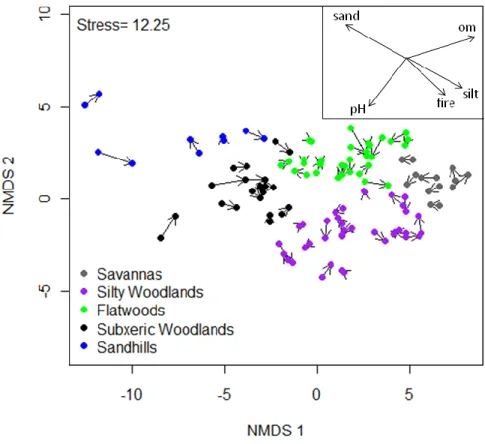
Figure 2.4: NMS ordination showing changes in community composition over
time for different community types, represented by the length of vectors……….…38
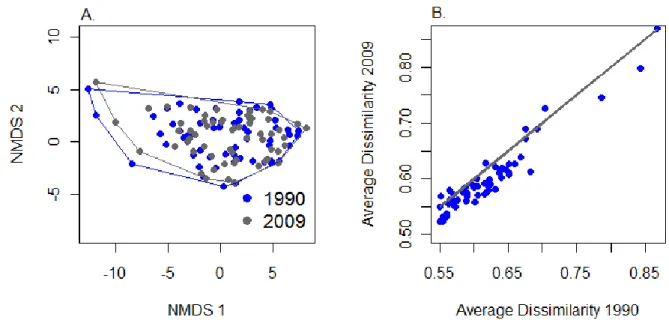
Figure 2.5: NMS ordination highlighting plots by sampling year (1990s, 2009)………..…39
Figure 3.1: Mean annual Palmer Drought Severity Index and mean annual Palmer
Z Index from 1970-2013 for the southeastern Coastal Plain of North Carolina………68
Figure 3.2: Plot locations in southeastern North Carolina, USA………...…69
Figure 3.3: Mean species richness at each spatial scale in Big Island Savanna during
1985-1989, 1994, and 2011-2013……….………..…70
Figure 3.4: Comparison of the variation in mean species richness at 1m² and mean
annual Palmer Z Index between 1985 and 2013……….…71
Figure 4.1: Southeastern Coastal Plain of the US showing locations of 849 plots and
the four major ecoregions in the study area………95
Figure 4.2: Average richness at 100m² for each ecoregion and community type……….…96
Figure 4.3: Variance partitioning results for richness at 1 m² and 100 m² for all plots……….…97
Figure 4.4: Variance partitioning results for richness at 1 m² and 100 m² for the four
longleaf pine ecoregions……….…98
Figure 5.1: Mean modified Raup-Crick dissimilarity metric at 0.01 m² to 1000 m²
highlighted by community type and time since fire category………...…121
Figure 5.2: Mean modified Raup-Crick dissimilarity metric at 1 m² and 1000 m² for
each time since fire category highlighted by each community type……….…122
Figure 5.3: Mean C-score at 0.01 m² to 1000 m² highlighted by community type
and time since fire……….…123
highlighted by each broad community type…..………124
Figure 5.5: Mean C-score versus mean βrc at 1000 m² for each time since fire category…...…125
Figure 6.1. Frequency of plant species in 1000 m² plots in eastern North Carolina
and across the southeastern US……….………139
Figure 6.2. Number of plots occupied by each species versus abundance for that
species in eastern North Carolina and across the longleaf pine range………..…140
Figure 6.3. Number of satellite species versus species richness at 1000 m² for the 59
plots located in eastern North Carolina...………...….……….141
Figure 6.4. Mean species turnover from 1990 to 2009 and from 2009 to 2010 for 30
CHAPTER 1: INTRODUCTION
A key challenge for ecologists is to identify which processes act to assemble
communities to produce the patterns we see at local, regional, and global scales. Community
assembly is the process in which species are filtered into ecological communities, and can be
thought of as a number of sieves or filters, allowing certain species through, while excluding
others (Diamond 1975, Weiher & Keddy 1995). Multiple community assembly processes (e.g.,
biotic interactions, environmental filtering, dispersal, disturbance, evolutionary history), often
operating at different spatial and temporal scales, are thought to act simultaneously to determine
both the identity and number of species that get to a site (e.g., diversity and composition;
Ricklefs 2004, Harrison & Cornell 2008, Chase & Myers 2011, HilleRisLambers et al. 2012).
Thus, a new goal in community ecology is to determine how the relative importance of multiple
processes changes across space, time, or across communities structured along gradients (e.g.,
elevation, environmental stress, predator abundance; Leibold & McPeek 2006).
In this dissertation, I document vegetation patterns and identify the important processes
responsible for the assembly of plant communities across space and time in the longleaf pine
ecosystem. Specifically, I attempt to tease out the relative importance of fire regimes (e.g.,
frequency and timing), local environmental filtering (e.g., soils), regional environmental filtering
(e.g., climate), biogeographic history reflected by the size of the regional species pool, stochastic
processes, and competition. For several reasons, the longleaf pine ecosystem is an ideal system
especially at small spatial scales (52 species in 1 m², representing the highest reported
small-scale species richness in North America), which has resulted in debate amongst botanists and
plant ecologists about how so many species can coexist together (Walker & Peet 1983, Myers &
Harms 2011; also see Wilson et al. 2012). Second, this ecosystem is fire-dependent, occurs over
a broad spatial extent, and is structured along strong regional and local environmental gradients.
Thus, there is some expectation that multiple processes will be important for structuring plant
species richness and composition patterns, and that the relative importance of those processes
may change across space and time. Third, the longleaf pine ecosystem is of great conservation
concern in the southeastern United States as less than 3% of the original, pre-settlement acreage
remains, of which very little is high-quality, fire-maintained habitat. In addition, the longleaf
pine ecosystem is known for its high levels of endemic and rare taxa, including several federally
endangered and threatened species (Estill & Cruzan 2001, Sorrie & Weakley 2001, Sorrie
&Weakley 2006, Noss 2013). Thus, a better understanding of what processes influence species
richness and species composition should help guide restoration and conservation of this
endangered ecosystem.
A second unifying theme across my chapters is the component of scale. Scale is a central,
key concept that connects research across disciplines in ecology (Levin 1992). Over the last
several decades, much attention has been focused on the scale-dependence of ecological patterns
and processes (Shmida & Wilson 1985, Auerbach & Shmida 1987, Palmer & White 1994,
Rosenzweig 1995, Crawley & Harral 2001, Götzenberger et al. 2012, Peet et al. 2014). More
recently, time and space have been combined in a single conceptual framework for considering
1960. The relative importance of processes changes somewhat predictably with spatial or
temporal scale, generally with processes operating at larger temporal and spatial extents
becoming more important as spatial grain size increases. For instance, biotic interactions and
demographic stochasticity are thought to act most strongly in structuring communities at small
spatial scales (Stoll & Weiner 2000, Götzenberger et al. 2012). In contrast, environmental
filtering (e.g., climate) often becomes more important at large spatial scales, since environmental
heterogeneity generally increases with spatial scale (Williams 1943, Shmida & Wilson 1985,
Crawley & Harral 2001, Field et al. 2009).
Examining pattern and process across multiple spatial and temporal scales is becoming
increasingly important in ecology for several reasons. First, studies conducted at multiple scales
are more effective in elucidating the processes that structure ecological communities. Since,
ecological processes are scale-dependent, studies that do not examine community patterns at
certain spatial scales, will be unlikely to find evidence of processes thought to operate primarily
at those scales. For example, if climate is thought to be important in structuring species
distributions across a landscape, sampling only a small portion of the landscape might lead to the
conclusion that climate is not an important filter; rather, the spatial scale of sampling was not
matched appropriately to the spatial scale at which climate is operating. Second, studies
conducted at multiple scales that have considerable temporal or spatial breadth allow for testing
the generality of ecological principles across sets of communities. Rather than simply examining
ecological patterns in a spatial or temporal snap-shot, studies conducted across large spatial or
temporal extents can assess whether a process is generally important. My dissertation explores
the scale-dependence of ecological patterns and processes by examining vegetation patterns
Using this approach, I identify which processes act at particular spatial and temporal scales and
how their relative importance changes with scale.
Disturbance and local environmental filtering (e.g., soil properties and site conditions)
have been identified as key drivers of plant community structure, especially in fire-dependent
grasslands (Walker & Peet 1983, Glitzenstein et al. 2003, Kirkman et al. 2004, Uys et al. 2004,
Overbeck et al. 2005). Chapter 2 of this dissertation examines how soil properties and fire
frequency have influenced species richness and beta-diversity (e.g., turnover in community
composition) over 20 years in longleaf pine plant communities in eastern North Carolina. The
goals of this work were threefold. First, I was interested in quantifying how dynamic longleaf
pine plant communities are over decadal temporal extents and how vegetation change may
proceed differently depending on fire history and environmental context. The magnitude of
vegetation change is expected to vary across sites that differ in key environmental attributes
(e.g., N and P availability, soil moisture) because of underlying variation in resource availability
(Gibson & Hulbert 1987, Gauthier et al. 2010, Amatangelo et al. 2011). Furthermore, the effects
of fire or other disturbances can change with environmental context (e.g., higher fire frequency
on nutrient-rich, moist sites that produce more biomass), which has direct consequences for plant
species richness and composition (Kirkman et al. 2001, Harrison et al. 2003, Collins & Calabrese
2012, Pausas & Ribeiro 2013). The second goal of this study was to investigate whether
vegetation patterns and their drivers were scale dependent. To this end, I examine how species
richness and beta-diversity change with spatial grain from 0.01 m² to 1000 m². Lastly, this work
informs land managers about best management practices for implementing prescribed fire for
understand the outcome of this management decision and to inform land management agencies
accordingly, I relate prescribed fire frequency to changes in species richness and beta-diversity
patterns over time.
Chapter 3 builds on Chapter 2 and examines how changes in the fire management regime,
compounded with additional stress from long-term drought have impacted plant species richness
at a single site, Big Island Savanna, located in the Green Swamp Preserve, North Carolina.
Chapter 2 revealed species richness at small scales had declined over time in Big Island Savanna.
Recently, the fire management regime in this site changed from nearly annual fire during at least
1940-1997 (Kologiski 1977, Rome 1988) to a fire return interval of 2 to 3 years during
1997-2011. In addition, the southeastern Coastal Plain of the US has been experiencing long-term,
ongoing drought for the last 25 years. To identify whether reduced fire frequency, long-term
drought, or some combination of the two is responsible for the loss of biodiversity detected in
Big Island Savanna, I re-sampled two sets of nested, permanent plots after ~20 and 25 years,
respectively. Understanding why plant species richness has decreased over time in Big Island
Savanna is critical for several reasons. First, Big Island Savanna, and more broadly the Green
Swamp Preserve, is of great conservation importance in the southeastern US as it was never truly
fire-suppressed in the early and mid-20th century like so many other longleaf pine sites
(Kologiski 1977, McIver 1981, Rome 1988). Furthermore, the Green Swamp Preserve contains
some of the best remaining examples of species-rich, mesic longleaf pine savanna on the Atlantic
Coastal Plain (McIver 1981). Third, this site is famous for its high biodiversity at small spatial
scales, formerly holding the North American record at 0.25 m² and 1 m² (Walker & Peet 1983). I
believe this work not only has applications for land managers in the longleaf pine ecosystem, but
changes in disturbance regimes and may require frequent disturbance to maintain high plant
species richness.
In addition to local environmental filtering and disturbance, plant community structure at
the local scale may be driven by processes that operate at larger spatial and temporal extents
(e.g., climate, evolutionary history; Zobel 1997, Pärtel 2002, Harrison & Cornell 2008). Thus, an
emerging goal in community ecology is to identify how local, regional, and historical processes
simultaneously influence community patterns at the local scale (Carr et al. 2009, White &
Hurlbert 2010, Gazol et al. 2012). In Chapter 4, I explore how processes operating at larger
spatial and temporal extents (e.g., climate, biogeographic history), in addition to local processes
(local environmental filtering) concurrently shape plant species richness patterns across the range
of the longleaf pine ecosystem. The longleaf pine ecosystem is an excellent system in which to
explore the relative importance of local, regional, and historical processes because it occurs
across a broad spatial extent and along strong environmental gradients (e.g., climate, soil
properties). Thus community structure in this ecosystem is likely influenced by multiple
processes that vary in spatial and temporal breadth. This work builds on Chapter 2 and 3 by
examining whether local environmental filtering continues to be an important filter across space
in addition to time, but also expands on that work by examining the effects of climate and
historical processes on longleaf pine community assembly. Variance partitioning is used to
identify the unique variation in species richness explained by soil properties, climate, and species
pool size (a proxy for historical processes). I then examine whether climate and species-pool size
increase in relative importance as spatial grain changes from 1 m² to 100 m².
(Tilman 1982, van der Maarel & Sykes 1993, Chesson 2000, Hubbell 2001, Silvertown 2004).
Recently these two competing hypotheses have been merged into a single conceptual framework
that seeks to identify how the relative importance of deterministic versus stochastic processes
changes across a set of communities (Tilman et al. 2004, Gravel et al. 2006). Where
communities fall along the continuum between solely niche-based processes and solely
stochastic processes depends on multiple factors, including the frequency or intensity of
disturbance. One approach to quantifying the relative importance of different community
assembly processes is through species co-occurrence metrics, which reveal whether community
structure is more aggregated (evidence of environmental filtering), segregated (evidence of
limiting similarity), or no different than random expectation (evidence of stochastic assembly).
In Chapter 5, I use two different, yet complementary species-co-occurrence metrics coupled with
null model analysis to explore where longleaf pine plant communities fall along the continuum
of deterministic to stochastic assembly. More specifically, I examine how the relative importance
of environmental filtering, competition, and stochastic processes change across a gradient of
environmental stress, with spatial grain (0.01 m² to 1000 m²) and with time since fire.
Chapter 6 identifies the important community assembly processes and synthesizes their
synergistic effect on plant species richness and composition patterns in the longleaf pine
ecosystem over space and time. I then put my findings into context and examine similarities and
differences between the drivers of vegetation patterns in the longleaf pine ecosystem and other
species-rich grasslands in the world. In total, this dissertation explores how plant species richness
and community composition are structured over space and time, how dynamic longleaf pine
plant communities are over time, and how the relative strength of community assembly processes
REFERENCES
Adler, P.B. & Lauenroth, W.K. 2003. The power of time: spatiotemporal scaling of species diversity. Ecology Letters 6: 749-756.
Adler, P.B., White, E.P., Lauenroth, W.K., Kaufman, D.M., Rassweiler, A. & Rusak, J.A. 2005. Evidence for a general species-time-area relationship. Ecology 86: 2032-2039.
Amatangelo, K.L., Fulton, M.R., Rogers, D.A. & Waller, D.M. 2011. Converging forest community composition along an edaphic gradient threatens landscape-level diversity. Diversity and Distributions 17: 201-213.
Auerbach, M. & Shmida, A. 1987. Spatial scale and the determinants of plant species richness. Trends in Ecology & Evolution 2: 238-242.
Carr, S.C., Robertson, K.M., Platt, W.J. & Peet, R.K. 2009. A model of geographical,
environmental, and regional variation in vegetation composition of pyrogenic grasslands of Florida. Journal of Biogeography 36: 1600-1612.
Chase, J.M. & Myers, J.A. 2011. Disentangling the importance of ecological niches from stochastic processes across scales. Philosophical Transactions of the Royal Society 366: 2351-2363.
Chesson, P. 2000. Mechanisms of maintenance of species diversity. Annual Review of Ecology, Evolution, and Systematics 31: 343–366.
Collins, S.L. & Calabrese, L.B. 2012. Effects of fire, grazing and topographic variation on vegetation structure in tallgrass prairie. Journal of Vegetation Science 23: 563-575.
Crawley, M.J. & Harral, J.E. 2001. Scale dependence in plant biodiversity. Science 291: 864-868.
Diamond, J.M. 1975. Assembly of species communities. Ecology and Evolution of Communities (ed. by M.L. Cody and J.M. Diamond), pp. 342-444. Belknap Press, Cambridge, MA.
Estill, J.C. & Cruzan, M.B. 2001. Phytogeography of rare plant species endemic to the southeastern United States. Castanea 66: 3-23.
Field, R., Hawkins, B.A., Cornell, H.V., Currie, D.J., Diniz-Filho, A.F., Guegan, J. Kaufman, D.M., Kerr, J.T., Mittelbach, G.G., Oberdorff, T., O’Brien, E.M. & Turner, J.R.G. 2009. Spatial species-richness gradients across scales: a meta-analysis. Journal of Biogeography 36: 132-147.
Gauthier, S., Boucher, D., Morissette, J. & De Grandpre, L. 2010. Fifty-seven years of
Gazol, A., Tamme, R., Takkis, K., Kasari, L., Saar, L., Helm, A. & Pärtel, M. 2012. Landscape-and small-scale determinants of grasslLandscape-and species diversity: direct Landscape-and indirect influences. Ecography 35: 944-951.
Gibson, D.J. & Hulbert, L.C. 1987. Effects of fire, topography and year-to-year climatic variation on species composition in tallgrass prairie. Vegetatio 72: 175-185.
Glitzenstein, J.S., Streng, D.R. & Wade, D.D. 2003. Fire frequency effects on longleaf pine (Pinus palustris P. Miller) vegetation in South Carolina and northeast Florida, USA. Natural Areas Journal 23: 22-37.
Götzenberger, L., de Bello, F., Bråthen, K.A., Davison, J., Dubuis, A., Guisan, A., Lepš, J., Lindborg, R., Moora, M., Pärtel, M., Pellissier, L., Pottier, J., Vittoz, P., Zobel, K. & Zobel, M. 2012. Ecological assembly rules in plant communities - approaches, patterns and
prospects. Biological Reviews87: 111-127.
Gravel, D., Canham, C.D., Beaudet, M. & Messier, C. 2006. Reconciling niche and neutrality: the continuum hypothesis. Ecology Letters 9: 399-409.
Harrison, S., Inouye, B.D. & Safford, H.D. 2003. Ecological heterogeneity in the effects of grazing and fire on grassland diversity. Conservation Biology 17: 837-845.
Harrison, S. & Cornell, H. 2008. Toward a better understanding of the regional causes of local community richness. Ecology Letters 11: 969-979.
HilleRisLambers, J., Adler, P.B., Harpole, W.S., Levine, J.M. & Mayfield, M.M. 2012.
Rethinking community assembly through the lens of coexistence theory. Annual Review of Ecology, Evolution, and Systematics 43: 227-248.
Hubbell, S.P. 2001. The Unified Neutral Theory of Biodiversity and Biogeography. Princeton University Press, Princeton, NJ.
Kirkman, L.K., Mitchell, R.J., Helton, R.C. & Drew, M.B. 2001. Productivity and species
richness across and environmental gradient in a fire-dependent ecosystem. American Journal of Botany 88: 2119-2128.
Kirkman, L.K., Goebel, P.C. & Palik, B.J. 2004. Predicting plant species diversity in a longleaf pine landscape. Ecoscience 11: 80-93.
Kologiski, R.L. 1977. The phytosociology of the Green Swamp, North Carolina [North Carolina Agricultural Experiment Station Technical Bulletin 250]. North Carolina Agricultural Experiment Station, Raleigh, NC.
Leibold, M.A. & McPeek, M.A. 2006. Coexistence of niche and neutral perspectives in community ecology. Ecology 87: 1399-1410.
Levin, S.A. 1992. The problem of pattern and scale in ecology. Ecology 73: 1943-1967.
Myers, J.A. & Harms, K.E. 2011. Seed arrival and ecological filters interact to assembly high-diversity plant communities. Ecology 92: 676-686.
Noss, R.F. 2013. Forgotten grasslands of the south: natural history and conservation. Island Press, Washington DC, US.
Overbeck, G.E., Miller, S.C., Pillar, V.D. & Pfadenhauer, J. 2005. Fine-scale post-fire dynamics in southern Brazilian subtropical grasslands. Journal of Vegetation Science 16: 655-664.
Pärtel, M. 2002. Local plant diversity patterns and evolutionary history at the regional scale. Ecology 83: 2361-2366.
Palmer, M.W. & White, P.S. 1994. Scale dependence and the species-area relationship. American Naturalist 144: 717-740.
Pausas, J.G. & Ribeiro, E. 2013. The global fire-productivity relationship. Global Ecology and Biogeography 22: 728-736.
Peet, R.K., Palmquist, K.A. & Tessel, S.M. 2014. Herbaceous layer species richness of
southeastern forests and woodlands: Patterns and causes. The herbaceous layer in forests of eastern North America (ed. by F.S. Gilliam and M.R. Roberts), pp. 255-276, 2nd edition. Oxford University Press, New York, NY.
Preston, F. W. 1960. Time and space and the variation of species. Ecology 41: 611-627.
Ricklefs, R.E. 2004. A comprehensive framework for global patterns in biodiversity. Ecology Letters7: 1-15.
Rome, A. 1988. Vegetation variation in a pine-wiregrass savanna in the Green Swamp, North Carolina. Castanea 53: 122-131.
Rosenzweig, M.L. 1995. Species diversity in space and time. Cambridge University Press, Cambridge, UK.
Scheiner, S.M., Chiarucci, A., Fox, G.A., Helmus, M.R., McGlinn, D.J. & Willig, M.R. 2011. The underpinnings of the relationship of species richness with space and time. Ecological Monographs 81: 195-213.
Shmida, A. & Wilson, M.V. 1985. Biological determinants of species diversity. Journal of Biogeography 12: 1-20.
Silvertown, J. 2004. Plant coexistence and the niche. Trends in Ecology and Evolution 19: 605-611.
Sorrie, B.A. & Weakley, A.S. 2001. Coastal Plain vascular plant endemics: phytogeographic patterns. Castanea 66: 50-82.
Stoll, P. & Weiner, J. 2000. View of interactions among individual plants. The geometry of interactions: Simplifying spatial complexity (ed. by R. Law and J. H. J. Metz),pp. 48–64. Cambridge University Press, Cambridge, UK.
Tilman, D. 1982. Resource competition and community structure. Princeton University Press, Princeton, NJ.
Tilman, D. 2004. Niche tradeoffs, neutrality, and community structure: a stochastic theory of resource competition, invasion, and community assembly. PNAS 101: 10854-10861.
Uys, R.G., Bond, W.J. & Everson, T.M. 2004. The effect of different fire regimes on plant diversity in southern African grasslands. Biological Conservation 118: 489-499.
van der Maarel, E. & Sykes, M.T. 1993. Small-scale plant species turnover in limestone grassland: the carousel model and some comments on the niche concept. Journal of Vegetation Science 4: 179-188.
Walker, J. & Peet, R.K. 1983. Composition and species diversity of pine-wiregrass savannas of the Green Swamp, North Carolina. Vegetation 55: 163-179.
Weiher, E. & Keddy, P.A. 1995. Assembly rules, null models, and trait dispersion: new questions from old patterns. Oikos 74: 159-164.
White, E.P. & Hurlbert, A.H. 2010. The combined influence of the local environment and regional enrichment on bird species richness. The American Naturalist 175: 35-43.
White, E.P., Ernest, S.K.M., Adler, P.B., Hurlbert, A.H. & Lyons, S.K. 2010. Integrating spatial and temporal approaches to understanding species richness. Philosophical Transactions of the Royal Society 365: 3633-3643.
Williams, G.B. 1943. Area and the number of species. Nature152: 264-267.
Wilson , J.B., Peet, R.K., Dengler J. & Pärtel, M. 2012. Plant species richness: the world records. Journal of Vegetation Science 23: 796-802.
CHAPTER 2: FIRE FREQUENCY AND ENVIRONMENTAL FILTERING DRIVE VEGETATION PATTERNS ACROSS TIME AND SPACE IN LONGLEAF PINE
WOODLANDS
Abstract
Disturbance is an important factor that shapes plant community structure in
fire-dependent grasslands, and alteration of disturbance regimes can have large consequences on
species richness and species composition. However, the response of vegetation to disturbance
may change with environmental context. I re-sampled 59 permanent vegetation plots in the
longleaf pine ecosystem twenty years after they were established to determine the magnitude of
vegetation change at a range of spatial scales (0.01 m² to 1000 m²). I was interested in how
environmental context and fire frequency concurrently influence vegetation change over time
and if those relationships change with spatial scale. I quantified the magnitude of vegetation
change using two different metrics of beta-diversity (beta turnover, the proportion of species
turning over and Bray-Curtis dissimilarity, an abundance-weighted metric) and by tabulating
changes in species richness. The magnitude of vegetation change was highly dependent on
environmental context and fire frequency. Changes in species richness, beta turnover, and
Bray-Curtis dissimilarity were greatest on silty, frequently-burned sites, whereas most sandy,
infrequently-burned sites remained stable. Furthermore, the amount of change detected was
scale-dependent. Species richness increased at larger spatial scales over time, but decreased at
However, the magnitude of compositional change (e.g., dissimilarity of plots to themselves over
time) was relatively modest, despite large amounts of beta turnover across time. I attribute this
initial contradiction to the turnover of infrequent, mobile species amidst a matrix of dominant
bunchgrasses. Interestingly, and in contrast to other longleaf pine studies, I found environmental
site conditions to be more important in predicting the magnitude of vegetation change than fire
frequency. Thus, future work addressing vegetation change in the longleaf pine ecosystem and in
other species-rich grassland systems should consider not only disturbance, but environmental
context as well. Since species richness and species turnover patterns were scale-dependent, I
recommend sampling vegetation across multiple spatial scales to comprehensively quantify
changes in community structure over time.
Introduction
Fire shapes plant community structure in many terrestrial ecosystems (Bond & Keeley
2005, Bowman et al. 2009, Turner 2010). In fire-dependent systems, particularly grasslands, fire
often increases species richness through the release of resources, such as nutrients, space, and
light, while preventing competitive exclusion (Walker & Peet 1983, Glitzenstein et al. 2003,
Kirkman et al. 2004, Uys et al. 2004, Overbeck et al. 2005, Peet et al. 2014). However, fire
regimes (including the frequency, intensity, severity, and timing of fire) are changing throughout
the world (Millennium Ecosystem Assessment 2005, Westerling et al. 2006, Bowman et al.
2009), with large and lasting consequences for plant species distributions, plant species richness
patterns, and plant community composition, especially where fire is necessary for the
maintenance of community structure (Leach & Givnish 1996, Johnstone & Chapin 2003). For
this reason, increased effort in recent years has been focused on how fire regimes affect
In addition to disturbance regimes, plant communities are structured by both local and
regional environmental filtering and hence vegetation change over time may be strongly
dependent on the environmental context in which sites occur. Sites that differ in key
environmental attributes (e.g., N and P availability, soil moisture) may have different rates of
change because of underlying variation in resource availability (Gibson & Hulbert 1987,
Gauthier et al. 2010, Amatangelo et al. 2011). Furthermore, the effects of fire or other
disturbances can change with environmental context (e.g., increased fire frequency on
nutrient-rich, moist sites that produce more biomass), which has direct consequences for plant species
richness and composition (Kirkman et al. 2001, Harrison et al. 2003, Collins & Calabrese 2012,
Pausas & Ribeiro 2013).
The longleaf pine (Pinus palustris) ecosystem is a fire-dependent woodland ecosystem located in the southeastern United States, characterized by an often species-rich herbaceous layer
dominated by graminoids and forbs. Community structure in this ecosystem is strongly
influenced by both fire and environmental filtering. Frequent fire (every 1-5 years) is necessary
for the maintenance of plant species richness, plant species composition, and vegetation structure
(Walker & Peet 1983, Frost et al. 1986, Kirkman et al. 2004). Without frequent fire, species
richness declines, woody components increase, and the understory becomes dense and closed
(Heyward 1939, Frost et al. 1986, Glitzenstein et al. 2003). Several studies have examined how
fire frequency influences community structure across time and suggest that more frequent fire
often results in increases in species richness and the abundance of herbaceous species (Lewis &
Harshbarger 1976, Waldrop et al. 1992, Brockway & Lewis 1997, Glitzenstein et al. 2003).
properties and climate; Walker & Peet 1983, Carr et al. 2009, Peet et al. 2014). Several studies
have shown that soil properties, particularly soil moisture and texture, are the most important
environmental drivers of plant community structure (Drewa et al. 2002, Glitzenstein et al. 2003,
Kirkman et al. 2004, Peet 2006, Carr et al. 2009, Peet et al. 2014). Although much work has
investigated how fire regimes or environmental context influence species richness and
composition in the longleaf pine ecosystem (Lemon 1949, Lemon 1967, Hartnett 1987, Kirkman
et al. 2001, Keddy et al. 2006, Hinman & Brewer 2007), no studies have investigated how these
factors concurrently affect species richness and composition over longer temporal extents.
Here I assess how prescribed fire frequency and environmental context have impacted
patterns of plant species richness and community composition over time in longleaf pine
communities by re-sampling 59 permanent vegetation plots nearly twenty years after they were
originally installed. I quantified several aspects of community structure over time and across
multiple spatial scales to pursue three main questions. First, how does the magnitude of change
in community composition and species richness across time vary with spatial scale? Studies that
examine how community composition (e.g., species turnover) changes simultaneously in time
and space are rare (Soininen 2010) and I know of no other studies in the longleaf pine ecosystem
that have documented how vegetation change proceeds across time at differential spatial grains.
However, ecologists have developed a strong theoretical framework for understanding species
richness and turnover in space and time, built from Preston’s classic work of 1960 (Adler &
Lauenroth 2003, Adler et al. 2005, White et al. 2010, Soininen 2010). Second, do the effects of
fire and environmental context on the above metrics change with spatial scale? Lastly, are
species composition and richness responding in similar ways over time to fire frequency and
regime, relative to the current fire regime have influenced plant species richness and composition
over time.
Methods
Study Area
This work was conducted on the outer Coastal Plain of North Carolina in the southeastern
United States (Figure 2.1). Elevation ranges from 0 to 30 meters above sea level, with very little
topographic relief. However, subtle differences in elevation (0.5 meters or less) have large
consequences for hydrology, soil properties, and hence vegetation (Rome 1988, Christensen
2000). The climate is humid sub-tropical, with an average mean annual temperature of 15.5 °C
and an average annual precipitation of 160 cm, most of which occurs during the growing season
(Ruffner 1985, State Climate Office of North Carolina). Summer convectional storms not only
provide heavy rain, but lightning and an ignition source for frequent, low-intensity fires
(Christensen 2000, Frost 2006). Soils within the region derive from nutrient-poor,
unconsolidated sediments of alluvial and marine origin. Several soil orders occur within the
study area and soil texture is extremely important in determining water holding capacity, nutrient
retention, species richness, and community composition (Peet 2006).
Sampling Design and Vegetation Data
During the summers of 1991-1993, 200 plots were sampled in the longleaf pine
ecosystem of the North Carolina Coastal Plain using the Carolina Vegetation Survey protocol
(CVS; Peet et al. 1998). In the summers of 2009 and 2010, I re-located and re-sampled 59 plots
to span a range of fire histories. Plots were not re-sampled if there were signs of human
disturbance or development. The CVS sampling design consists of 1000 m² plots with several
smaller sub-plots nested within (0.01 m², 0.1 m², 1 m², 10 m², 100 m², 400 m²). Each CVS plot
was permanently marked with 10 pieces of steel conduit, which ensured that I re-sampled
precisely the same physical location. Once a plot was re-located, presence of all vascular plant
species was recorded at all six spatial scales and each species was assigned a cover class value
(see Peet et al. 1998). The same sampling methodology was used during both sampling events to
ensure the data collected were directly comparable. In addition, I attempted to standardize
sampling effort across the two time periods by discussing effort spent (survey time) with several
of the original, key participants.
Environmental and Fire History Data
In addition to vegetation data, slope, aspect, and soil samples from the A horizon were
collected at the time of sampling. Soil samples were then analyzed for texture (sand, silt, clay
%), nutrients (N, P, Al, B, Ca, Cu, Fe, H, K, Mg, Mn, Na, S, Zn), organic matter, base saturation,
cation exchange capacity, pH, Ca/Mg ratio, and bulk density by Brookside Laboratories Inc,
using Mehlich III extraction (Mehlich 1984). Elevation was determined from a digital elevation
model.
Fire history data for all plots through 2008 were obtained from a GIS layer of prescribed
fire events dating back to 1985, compiled from several land management agencies in
southeastern North Carolina (Costanza 2010). Additional years of fire history data (2009, 2010)
were obtained directly from the land management agencies. These data delineate the areas
frequency (the number of fires), average fire return interval (mean number of years between
fires), and time since fire (number of years since fire) were determined for all plots. During the
last 20 years, most land managers on government-owned lands in North Carolina have increased
the frequency of prescribed burning on longleaf pine tracts.
A broad community type was also assigned to each plot, so the magnitude and direction
of vegetation change could be examined with respect to vegetation types. These groups follow
Peet (2006), who categorized longleaf pine vegetation into 5 community groups based on soil
moisture and soil texture: silty woodlands, savannas, flatwoods, subxeric woodlands, and
sandhills (Figure 2.2). These correspond relatively well to four Groups recognized within the US
National Vegetation Classification: G009 Dry-Mesic Loamy Longleaf Pine Woodland, G190
Wet-Mesic Longleaf Pine Woodland, G596 Mesic Flatwoods Longleaf Pine Woodland, and for
the final two G154 Xeric Longleaf Pine Woodland (http://www.usnvc.org). Silty woodlands and
savannas occur on fine-textured ultisol soils. These two types are the most species-rich, with
savannas being slightly wetter (Peet 2006). Flatwoods occur on spodosols with a spodic horizon
below the surface where fine-textured particles and organic matter accumulates, creating a mesic
to hydric growing environment, despite a mostly sandy substrate (Soil Survey Staff 2010).
Subxeric woodlands, also occur on sandy substrates, but are drier than flatwoods and often
contain dry-site oaks, such as Quercus laevis and Quercus incana. Sandhills occur on the driest, sandy sites, have sparse herbaceous layers, oak co-dominance in the over-story, and lower
Analysis
Prior to analysis, all taxonomic names were standardized across the two sampling periods
to ensure that changes in nomenclature, taxonomic resolution, and taxonomic understanding of
the flora across time did not affect the magnitude of vegetation change detected. Unknown or
ambiguous species were removed from the data set, while several species were lumped into
larger taxonomic complexes. As the ability to identify grasses in the genera Andropogon, Dichanthelium, and Schizachyrium was much more limited during the 1991-1993 sampling, all occurrences of these two genera were lumped into Andropogon spp., Dichanthelium spp. and Schizachyrium spp. in both data sets (1991-1993 and 2009-2010).
Several approaches were used to quantify the magnitude and direction of vegetation
change over time (Table 2.1). Species richness in 1991-1993 and 2009-2010 and raw species
turnover (defined here as the number of species lost and gained over time) were calculated across
multiple spatial scales (0.01, 0.1, 1, 10, 100, 400, and 1000 m²) for each plot. To quantify the
magnitude of compositional change over time, I used two different metrics of beta-diversity,
which capture somewhat different aspects of species turnover. The first metric I used was Wilson
and Shmida’s (1984) beta turnover metric: (βT) = (g + l) / 2α, which sums the number of species
gained (g) and lost (l) over time (e.g., raw species turnover) and divides by two times the mean
species richness (α; Wilson & Shmida 1984, see also Ricotta 2002, Ukmar et al. 2007). This
metric describes how many species have been lost and gained over time and does not consider
species abundance. The second beta-diversity metric, Bray-Curtis dissimilarity, considers how
many species are shared across two sites scaled by their abundance (cover class code, see Peet et
al. 1998). I calculated Bray-Curtis dissimilarity at spatial grains ≥ 100 m², at which I had
m² and below because abundance data were not available. Thus, it is not possible to directly
compare dissimilarity values calculated at larger scales (> 100 m²) to those calculated at smaller
scales (< 100 m²). However, it is still possible to compare differences between 100 m² and larger
spatial grains (i.e. 1000 m²), and between 10 m² and smaller spatial grains (i.e. 0.01 m²). The
dissimilarity of each plot to itself 20 years later was used as a quantitative estimate of the
magnitude of compositional change over time.
To determine if particular groups of taxa were consistently being lost or gained over time,
I assigned each species to a growth form category (caulescent herb, matrix graminoid, fern,
geophyte, hemiparasite, insectivore, legume, rosette herb, shrub, single-culm graminoid,
subshrub, tree, and vine; Table A.1) and then examined how the frequency of each growth form
changed over time (Table 2.4). These growth form categories are modified from Raunkaier 1983
(see Table A.1 for full descriptions). I expected fire history over the last 30 years would
influence the types of species turning over, with addition of woody species and loss of
small-statured herbaceous species (e.g., rosette herbs) on fire-suppressed sites. In addition, I expected
that certain types of species would inherently turn over more frequently than others due to life
history characteristics (e.g., annual species, sparse species, species sensitive to changes in soil
moisture availability). I summarized vegetation change by growth form in two ways. First, I
calculated the total number of times each growth form was gained and lost over time at both
1000 and 1 m². I then calculated a ratio that reflects the number of species gained versus lost, by
dividing the total number of gains for each growth form by the total number of losses. This
allowed me to examine whether particular growth forms tended to be gained or lost more over
whether they were lost or gained, I re-calculated Bray-Curtis dissimilarity matrices for each
growth form at 1000 m² and then calculated a mean dissimilarity value for each growth form
from plots to themselves over time.
To compare dissimilarity values across spatial scales, I used null model analysis. This
was necessary because I expect beta-diversity to be larger at small scales due to chance; as the
size of the sample approaches the size of the pool, species composition becomes more similar. I
first generated 1000 null communities using the swap-method (Gotelli and Entsminger 2003),
which held row and column totals constant (e.g., species richness per site and species occupancy
across all sites). I then calculated a dissimilarity matrix on each null community and extracted
the dissimilarity of plots to themselves over time. To compare results across spatial grain, I
calculated a standardized effect size (SES) for each scale,
SES= (I obs – I sim)/S sim,
where I obs is the observed mean dissimilarity of all plots to themselves over time, I sim is the
mean simulated dissimilarity of all plots to themselves over time and, S sim is the standard
deviation of the simulated indices (Gurevitch et al. 1992; Gotelli and McCabe 2002). SES values
above 2 indicate dissimilarity values that are greater than expected from random chance, while
SES values below 2 indicate dissimilarity values that are less than expected from random chance.
Null model analysis was implemented in R version 2.15.2 using the vegan and bipartite packages
(R Core Development Team 2012).
Linear models were used to quantify species richness, beta turnover, and dissimilarity
history. Model selection using AIC was utilized to identify which soil (nutrients, texture, organic
matter, bulk density), site (elevation, slope, aspect), and fire (fire frequency, average fire return
interval, time since fire) attributes should remain in the model for species richness and
beta-diversity at 100, 400, and 1000 m² (Burnham & Anderson 2002). The influence of soil properties
on vegetation change could not be examined at spatial scales below 100 m² because soil data
were unavailable at those scales. Fe, Ca, Mg, and Al in parts per million (ppm) were
log-transformed before analysis due to large data ranges for these variables across plots. Variance
partitioning analyses were then conducted to determine the unique variance explained by each
predictor in the best-fit model, along with the shared and unexplained variance in each model
(Legendre and Legendre 1998).
Non-metric multi-dimensional scaling (NMS) ordination was used to examine the
magnitude and direction of compositional change visually. NMS is considered the most
appropriate indirect ordination technique for plant community data, as it is suited to
non-normality and preserves dissimilarity values as distances in ordination space (Clarke 1993,
McCune and Grace 2002). NMS displayed all plots from both sampling events in ordination
space, and vectors were drawn from each plot during the 1991-1993 sampling to the same plot
during 2009-2010 (Figure 2.4). Environmental overlays of soil, site, and fire variables were used
to identify the environmental attributes and disturbance regimes of plots in ordination space.
These graphics helped illustrate whether sites with certain fire regimes or environmental
conditions had experienced more or less compositional change than other plots. Additionally,
NMS ordination was used to examine whether the ordination space during 1991-1993 had
plots are becoming more similar to one another in community composition over time. NMS was
performed in R v.2.15.2 using the labdsv packages (R Core Development Team 2012).
Results
Species Richness
Overall, species richness increased significantly over time at spatial scales from1 m² to
1000 m², remained constant at 0.1 m² and decreased at the smallest spatial scale examined (0.01
m², Table 2.1). Silt % and quadratic transformed fire frequency explained the most variation in
species richness across time at 1000 m² (unique variance explained by silt %: R² = 0.27, p <
.001; by fire frequency: R² = 0.17, p < .01 for both terms; shared variance = 0.06, Figure 2.3).
Silt % and quadratic transformed fire frequency were also the most important predictors of
species richness patterns over time at 400 m² (unique variance explained by silt %: R² = 0.32, p <
.001; by fire frequency R² = 0.18, p < .01 for both terms) and 100 m² (unique variance explained
by silt %: R² = 0.25, p < .001; by fire frequency R² = 0.16, p < .01 for both terms). Quadratic
transformed fire frequency was a better fit to the data than untransformed fire frequency,
suggesting the most frequently burned places have not gained as many species over time as those
burned less frequently. This relationship was being driven by a single site, Big Island Savanna in
the Green Swamp Preserve, which had lost species over time (Figure 2.3). I attribute this species
loss to reduced fire frequency in recent years, compounded with ongoing, long-term drought (see
Chapter 3 for further discussion and exploration of this species loss). However, on average, silty
sites burned more frequently in the last 20 years, relative to the original fire management regime,
species richness on fire-suppressed sites has decreased over time, while species richness on
xeric, sandy sites has remained relatively stable over time.
Species Composition
Raw species turnover, defined as the number of species lost and gained over time, was
high, especially at larger spatial scales (mean = 15.7 at 100 m² and mean = 20.4 at 1000 m²;
Table 2.1). Beta turnover was also high regardless of spatial scale, representing turnover of
between 16 percent and 77 percent of plant species over time, but was greatest at the smallest
spatial scales (< 1 m²; Table 2.1). Thus, although there are more species physically coming and
going over time at larger scales, they make up a smaller portion of the total flora than the amount
turning over at small scales. Community type was the only significant predictor of beta turnover
(1000 m²: R² = 0.25, p < 0.01; 400 m²: R² = 0.22, p < 0.01; 100 m²: R² = 0.19, p < 0.01). This is
in contrast to species richness, where silt percentage was a better predictor than community type.
Silt percentage and community type are correlated, but not completely redundant, as silt
percentage is one of two key axes that defines longleaf pine community types (Figure 2.2).
Therefore, because community type also encompasses a soil moisture gradient, it appears soil
texture and soil moisture are both important drivers of species turnover, with greater turnover on
silty, mesic sites (e.g., silty woodlands and savannas, Table 2.2). Fire frequency was not
significant in explaining variation in beta turnover at any scale.
To summarize the types of species turning over across time, I assigned each species to a
growth form category and calculated a ratio of gains to losses, along with Bray-Curtis
dissimilarity for each growth from at 1000 m² (see Table 2.3). At 1000 m², the ratio of gained
have exceeded losses, >1; Table 2.3). Notable exceptions include geophytes and hemiparasites,
which have consistently been lost over time (ratio = 0.4, 0.5, respectively). At 1 m², insectivores
(ratio = 0.3), along with geophytes (ratio = 0.4) and hemiparasites (ratio = 0.3) have been lost
preferentially. Many types of species turned over across time, but species turnover (Bray-Curtis
dissimilarity) was especially high for hemiparasites (0.80; e.g., Seymeria cassioides), geophytes (0.70; e.g., Calopogon spp.), single-culm graminoids (0.62; e.g., Dichanthelium spp., Scleria spp.), insectivores (0.60; e.g., Drosera capillaris), rosette herbs (0.49; e.g., Eurybia paludosa, Liatris spp.), and caulescent herbs (0.48; e.g., Polygala lutea, Symphyotrichum dumosum). Relatively small-statured herbaceous species and species sensitive to changes in moisture (e.g.,
insectivores) have been gained and lost most frequently across time. In contrast, ferns, matrix
graminoids, shrubs, and subshrubs have remained relative stable over time (Table 2.3).
Dissimilarity of a plot to itself over time was largely driven by spatial scale, soil
properties, and fire frequency. As with beta turnover, I expected the mean dissimilarity to
increase as spatial scale decreased for the reasons described above. To examine whether the
observed dissimilarity was greater or less than null expectation, I used null model analysis to
calculate a mean simulated dissimilarity and standard effect size (SES). I found the observed
dissimilarity was significantly lower than the simulated dissimilarity at larger spatial grains,
suggesting vegetation is more stable over time at those scales (Table 2.1). In contrast, vegetation
change at smaller scales (< 100 m²) was not different than random expectation (SES: -0.84 to
.07). At small scales there is greater stochasticity with higher rates of local extinction and
colonization owing to the smaller number of individuals present, leading to greater
At 1000 m², the best predictor of dissimilarity over time was community type, with moist,
silty sites (e.g. savannas) experiencing the greatest compositional change over time (R² = 0.31, p
< 0.001). Silt % was the best predictor of compositional change at 400 m² (R² = 0.13, p < 0.01),
while both silt % and quadratic transformed fire frequency were important at 100 m² (unique R²
for silt % = 0.07, p < 0.01, unique R² for fire = 0.09, p < 0.01). The shared variance explained by
both silt % and fire frequency was 0.04 at 100 m². Thus, the total explained variance in
dissimilarity was relatively low. The importance of fire frequency increased as spatial scale
decreased and fire frequency became slightly more important in explaining compositional
change than silt % at 100 m². In general, silty, frequently-burned sites have experienced greater
compositional change over time, in addition to greater changes in species richness and beta
turnover.
NMS confirmed that compositional change for most plots has been relatively modest
across ~20 years. In Figure 2.4, vectors connect the same plot to itself over time, and the length
and direction of the vectors relates to the magnitude and direction of vegetation change,
respectively. Only a few plots show substantial change over time; these plots occur on
fire-suppressed sandhills and subxeric woodlands (Figure 2.4). In addition, the vectors are moving in
multiple directions, indicating that there is no consistency in how plots are changing over time.
NMS also revealed that there has been slight homogenization of the vegetation, indicated by a
small constriction in the amount of ordination space occupied by all plots over time (Figure 2.5).
Thus, plots have become more similar to other plots in their community composition. I attribute
this to increased burning efforts in the last 20 years by land management agencies within the