AN EMPIRICAL ANALYSIS OF MULTIMEDIA RIGHTS AMONG DIVISION I FBS INSTITUTIONS
Jacob J. Spreyer
A thesis submitted to the faculty of the University of North Carolina at Chapel Hill in partial fulfillment of the requirements for the degree of Master of Arts in the Department of Exercise
and Sport Science (Sport Administration)
Chapel Hill 2018
Approved by:
Jonathan Jensen
ABSTRACT
Jacob Spreyer: An empirical analysis of multimedia rights among Division I FBS institutions (Under the direction of Jonathan Jensen)
TABLE OF CONTENTS
ABSTRACT iii
LIST OF TABLES vii
CHAPTER I 1-7
Introduction 1
Statement of Purpose 4
Research Questions 5
Definition of Terms 5
Limitations 6
Delimitations 6
Assumptions 7
CHAPTER II 8-16
Introduction to Literature Review 8
Origin of Television Broadcast 8
Attendance 12 Television Ratings 13
Broadcast Rights Fees 15
Theoretical Framework 16
CHAPTER III 18-21
Instruments 18
Contract Review 20
Statistical Analysis 21
CHAPTER IV 23-29
Descriptive Statistics 23
Correlation Results 26
Predictive Modeling 29
CHAPTER V 31-36
Implications 33
Limitations 35
Conclusion 36
APPENDIX 37-41
Appendix A 37
Appendix B 39
LIST OF TABLES
Table I: Contract Analyzed 20
Table II: “Power 5” and “Group of 5” Descriptive Statistics 25
Table III: “Power 5” Descriptive Statistics by Conference 26
Table IV: “Group of 5” Descriptive Statistics by Conference 26
Table V: Multimedia Rights Descriptive Statistics by Company 26
Table VI: Demand Indicators Descriptive Statistics 28
Table VII: Property-Related Variables 29
Table VIII: Historical Football Performance Variables 29
Table IX: Historical Basketball Performance Variables 29
Table X: Historical Indicators of Demand 30
Table XI: Model Summary 31
Table XII: Historical Basketball Performance Variables 31
Table XIII: Top 10 Overpaid 34
CHAPTER I
INTRODUCTION
Today’s sport fans have more ways to consume televised broadcasts of their favorite team or event than any other time in history. In addition to live television, which has been around since 1939 when the first college football game was broadcasted, fans now have the ability to view them on their computers, tablets, or smart phones (Galily, 2014: Voort, 2014). The technological advancements in television viewership has helped to drive the increase in
broadcast rights fees paid by networks to televise college sports, to the staggering levels we see today. In 1985, the NCAA and CBS inked a three-year deal worth $94.7 million, which included the rights to broadcast all intercollegiate athletic events (Jensen, Wakefield, Cobbs, & Turner, 2016). Twenty-five years later, during the 2010 season, the same two companies signed a 14-year agreement, giving CBS the rights to only the NCAA Basketball tournament, worth $10.8 billion. And just last year, the two extended the current 14-year deal by eight years and $8.8 billion dollars (Sherman, 2016). During that same five-year period the NCAA signed deals with CBS for the broadcasting rights to the College Football Playoff. The 12-year deal was signed in 2012, and pays the NCAA an estimated $470 million annually, or $5.64 billion over the course of the agreement (Hinnen, 2012). Between those two agreements alone, the NCAA is now earning over $1 billion annually in broadcast rights fees (Sherman, 2016).
too many games were televised it would lead to a decrease in fan attendance (Greenhouse, 1984). However, on June 27th, 1984 the U.S. Supreme Court issued their ruling in the NCAA v. Board of Regents of the University of Oklahoma and the University of Georgia Athletic Association, which was a direct challenge to the NCAA’s broadcast regulations of football telecasts (NCAA v. Board of Regents of Oklahoma, 1984). The decision made that day, stating the 1983-1985 NCAA Television plan violated the Sherman Antitrust Act, returned the property rights of
football telecasts to individual schools, who could now sell their own broadcast rights as opposed to the NCAA selling them for the entire association (Bennett & Fizel, 1995). With the
regulations lifted, schools began to look for new way to monetize their broadcast rights. Conferences began to take control of selling “Tier 1”, “Tier II”, and “Tier III” broadcast rights on behalf of their member institutions. “Tier I” and “Tier II” rights consist of a conferences most valuable football and men’s basketball games, which are sold to national networks such as CBS, ABC, or Fox. The “Tier III” rights are lower level non-conference football and men’s basketball games, as well as all non-revenue generating sports (Smith, 2012). Depending on which
created a massive market for sponsors looking to partner with a university. These multimedia rights agreements are fast becoming a vital part of any athletic department, making a large chunk of their annual revenue.
While all information points to universities seeing large increase in the monetary value of their multimedia rights contracts, there has been minimal research done to study why such increases are happening. Cornwell, Pruitt and Clark (2005) stated that “this dearth is due in large part to the proprietary nature of costs incurred by sponsoring firms” (2005). Thus, this study delineates the factors that impact the revenue gained by universities as it pertains to collegiate multimedia rights contracts. In order to do this, a multiple regression analysis is employed to develop a predictive empirical model, to determine whether universities have been underpaid or overpaid for their multimedia rights (Jensen et al, 2015). The process is similar to the methods used in a previous study analyzing the athletic apparel industry (Jensen et al, 2015).
Collegiate sport sponsorship is highly irregular. Team performance can change
drastically from year to year, potentially impacting the financial value of the next sponsorship contract an institution signs. And, with sponsorship spending exceeding $20 billion in North America during 2015, additional research is more important than ever (Jensen et al. 2015). As previously stated, due to the proprietary nature of sponsorship contracts, there has been little empirical research done on the topic. This study seeks to fill the void by analyzing the contracts of 54 Division 1 institutions, making it particularly noteworthy for industry professionals. It will help allow marketing managers and collegiate administrators further insight into how variables affect sponsorship contracts, thus allowing them to create more accurate financial forecasts utilizing hard data.
STATEMENT OF PUPOSE
collegiate administrators to make more informed and educated decisions when reviewing sponsorship offers presented to them.
RESEARCH QUESTIONS
1. What are the financial differences between Football Bowl Subdivisions (FBS) institutions in guaranteed multimedia rights fees based upon the following criteria:
a. Whether the institution is a member of a “Power 5” conference b. Whether the institution is a member of a “Group of 5” conference 2. What are the difference among Football Bowl Subdivisions (FBS) institutions in
guaranteed multimedia rights fees based upon the third-party rights holder with whom they partner with?
3. Are there certain aspects of the individual institution that are statistically significant predictors of its guaranteed multimedia rights fees, including:
a. Student body enrollment b. Number of student-athletes
c. The media market in which the institution resides
4. Are the institutions’ guaranteed multimedia rights fees predicted by its historical performance in the following sports:
a. Football
b. Men’s Basketball
DEFINITION OF TERMS
Annual Rights Fee – the non-commissionable cash payment that is made by the third-party company to the university. (September 1, 2008 University of Connecticut Multi-Media Rights Agreement) attached as Exhibit B
Broadcast – this includes any live, delayed or repeat broadcast and/or transmission by means of radio or any similar methods (September 1, 2008 Exhibit B).
Copyright – ownership of University content, which can include but is not limited to, radio, television, print and internet, formed as a consequence of an Agreement (July 1, 2012 Exhibit A). Multi-Media Rights Contract – the exclusive sale and marketing rights to all inventory associated with a University’s athletic program, including, print, media, sponsorships, coaches radio shows (both radio and television), existing or new signage, other promotional and sponsorship rights, as well as mutually agreed upon television broadcast rights for football, men’s and women’s basketball (July 1, 2012 Exhibit A).
Sponsorship – the messages on signage, giveaway items and other promotional opportunities as stipulated by the Multi-Media Rights contract (July 1, 2012 Exhibit A).
Telecast – any live, delayed or repeat telecast and or transmission by means of television transmission or any similar methods (September 1, 2008 Exhibit B).
LIMITATIONS
An additional limitation, when trying to compare the means among third party
multimedia rights holders, will be the unequal number of contracts. New companies such as JMI have fewer than five contracts, while more established companies such as IMG and Learfield have over 30.
Finally, we only operationalized men’s basketball and football, meaning that other sports who could influence demand were not accounted for. One example of this would be the UConn women’s basketball team, who is frequently televised and could be a driver of demand.
DELIMITATIONS
This thesis will look at contracts from public institutions, competing at the NCAA D1 FBS level. Private institutions are not required to publicize multimedia rights contracts, however, since schools compete with one another athletically and academically, we can make
generalizations about private institutions based upon the collected data.
ASSUMPTIONS
The major assumption for this thesis is that the contracts provided by the universities to Matt Kish, who then made his database publicly available, were complete and accurate.
CHAPTER 2
INTRODUCTION TO LITERATURE REVIEW
To properly assess the demand for college athletics as it relates to multimedia rights, one must look at the historical evolution of football telecasts with a focus on changes that have resulted in increased demand for college athletics. Scully (1985), Greenspan (1998), and Mawson and Bowler III (1989), have analyzed the landscape of collegiate athletics with a specific focus on the environment before and after NCAA v. University of Oklahoma Board of Regents case, specifically look at the effects on attendance, TV ratings, and broadcast rights fees. Within the historical context, it is clear how these indicators, over time, have influenced the demand for multimedia rights contracts.
ORIGIN OF TELEVISION BROADCAST
to hire the National Opinion Research Center to conduct a study of their own, certain that football broadcasts were a direct threat to gate receipts (Scully, 1989). The study found that in areas which saw no TV competition to live games attendance rose by 10.5%, but in areas facing direct TV competition attendance dropped by 16.2% (Greenspan, 1988). The findings alarmed members of the NCAA, triggering their one game per week limit in 1951, which was ultimately adopted by the entire association in 1952, almost unanimously in fact (Mawson & Bowler III, 1989: Greenspan, 1988). The new set of rules adopted in 1952 drastically changed football broadcasts, limiting it to one televised game per week, for a total of 12 throughout the season. Teams could only appear once per season and needed to obtain NCAA approval if they wished to conduct local broadcasts. Member institutions believed that this system would be to the benefit of football attendance and voiced little displeasure for the next 25 years.
In 1976 the NCAA began to see more organized push back on their television rights plan, for this was the year that the College Football Association (CFA) came into formation. The CFA was comprised of institutions from the Big East, Southeastern Conference, Southwestern
Conference, Atlantic Coast Conference, Western Athletic Conference, and a handful of
independent football powers such as Notre Dame and Penn State. Notably absent, were the Big Ten and Pac-10, who felt that the CNAA plan benefited all parties involved and had no desire to see it changed. Originally formed to lobby and promote the interests of major football
institutions within the NCAA governance structure, the CFA soon realized that the seminal issue facing the prominent football institutions was the NCAA’s restrictive television plan (Greenspan, 1988). The CFA believed that by limiting the number of broadcasts, in addition to controlling the number of appearances a university could make in a given year, that prominent football
2004). Despite dissent from the CFA who as still trying to figure out the proper course of action once the current television agreement with ABC expired in 1981, the NCAA began negotiations for the 1982-1985 seasons. When the negotiations were over the NCAA had signed a four-year deal with ABC and CBS worth $262 million, which more than doubled the television revenue it received in the 1977-1981 contract (Dunnavant, 2004). Still unhappy with the NCAA appearance rules as well as the fact smaller, non-football institutions received a share of the television
revenue, the CFA entered into a separate four-year, $180 million agreement with NBC
(Dunnavant, 2004). The agreement allowed institutions in the CFA to be televised four times per season, and reduced the number of schools who shared in the revenue to the 61 CFA members (Dunnavant, 2004). Soon after the NCAA issued a statement that any schools who chose to be a part of that deal risked probation or possible expulsion from the NCAA (Greenspan, 1988). This threat by the NCAA resulted in the CFA declining NBC’s offer, and prompted the University of Oklahoma and the University of Georgia to file suit on behalf of the CFA, arguing the NCAA’s restrictions on TV appearances violated the Sherman Antitrust Act (Mawson & Bowler III, 1989).
The ruling by Judge Burciaga on September 14, 1982 was a blow to the NCAA. Judge Burciaga stated that by having almost complete control over the supply of college football the NCAA was able to artificially inflate prices, place production limitations on their members, and set uniform prices with no regard to the differences in quality of product (Dunnavant, 2004). However, the decision was stayed until an appeals court could review the case, leaving in place the current television rules. During the two years it took the case to get before the court of
appearance (Dunnavant, 2004). When the ruling came down 2-1, upholding Judge Burciaga’s ruling the NCAA sought out Supreme Court Justice White, a former running back at the University of Colorado, to stay the appellate court’s decision (Dunnavant, 2004). Justice white agreed to stay the decision as the case made its way before the Supreme Court. While the Supreme Court admitted the NCAA’s implementation of the rules was intended to benefit the member institutions by sustaining competitive balance and protecting gate receipts; upon further investigation, they found that by prohibiting member institutions from selling their own
broadcast rights they created market restraints, and engaged in price fixing behavior (Scully, 1985: Greenspan, 1989). They ruled against the NCAA, finding they were indeed in violation of Section I of the Sherman Act, thus giving university’s the right to sell their own television broadcasts (Scully, 1985).
In the first year following the ruling, money from television was down over 60 percent. The NCAA had received $66 million in 1983 and was set to receive $74.5 million in 1984, but after the ruling, the CFA, Big Ten and Pac-10 were only receiving a combined $23 million in 1984 (Dunnavant, 2004). Along with a loss in network money, advertisements fell from an all-time high in 1983 to a mere $15,000 in 1984. College football spent the next decade trying to get back to the money they had seen in 1983, with the CFA, Big Ten and Pac-10 all feeling the financial impact. Adding insult to injury the CFA was being sued by the Federal Trade
and take $45 million less than originally offered. Five years later the CFA finally collapsed when the SEC left, signing a five year, $85 million-dollar contract with CBS, doubling the earnings they had received from the CFA. The CFA fought for more than twenty years to give football powers the right to control their own interests, succeeding in their battle of opening up the markets, and leaving us with what we see today.
ATTENDANCE
Attendance has long been used as the proxy through which researchers have attempted to explain demand. One reason for this is due to the prior research that has shown the three main sources of revenues for college athletic departments are gate receipts, TV revenue, and post season play, in that order (Noll, 1991). Starting in the 1940’s and 1950’s, collegiate sport leaders began to worry about the impact television could have on gate receipts. Several eastern
between 1975 and 1981, they failed to addresses the limitation of postulating these results to a post Supreme Court era. Following the model used by Kaempfer and Pacey (1986), Fizel and Bennett (1989) looked to expand upon their research by utilizing both pre and post Supreme Court ruling data to determine whether attendance and telecasts were complements or
substitutes. Fizel and Bennett (1989) had several contradictory findings when compared to those produced by Kaempfer and Pacey (1986), discovering a complementary relationship between past television exposure and current gate attendance. While they acknowledge some of the differences between the two studies could stem from market saturation or differing samples, Fizel and Bennett (1989) believe that Division I institutions are in a poorer position in regards to gate receipts following the Supreme Court decision than they were before.
While using attendance as a metric for demand has been employed for decades, there is still little consensus on how it is directly impacted by television broadcasts. This is partly due to the multitude of variables, both on the field and off the field that impact a fans decision to attend a game. Research in the area of assessing demand, whether for singular sport or for an athletic department as a whole, utilize television ratings, as they are a more modern and potentially more accurate reflection of demand.
TELEVISION RATINGS
study and past studies, noting that if one was to apply the same framework he applied it could be used to extrapolate information about other revenue sources, such as multimedia rights. Through studying television broadcasts per the lenses of multiple game-related variables, it was found that the quality of the team, game times, and the tenure of the team within the market all had positive influences on demand. Tainsky and McEvoy (2012) built upon the original study by focusing on the demand for football in areas which lacked NFL teams. Results indicated that similar
variables from Tainsky (2010), such as quality of team and market tenure, were shown to impact demand in markets which lacked NFL teams. Additional variables that similarly showed a correlation between television broadcasts and demand were the proximity of a fan to the team, late-season games, and games involving historically popular teams. The most recent study, Tainsky et al. (2012) used broadcast ratings to look at the uncertainty of outcome hypothesis and determined how that impacted demand. They found that game uncertainty played no role in impacting demand within a team’s local markets, but had an impact for outside markets. Fans, not in the local market, were more inclined to watch a game between two evenly matched teams. All three of these studies ought to reflect the growing importance that broadcast rights fees have had on the sport industry.
The importance of television ratings is illustrated further by the increase in sport
commercial breaks, to in game brand integration methods (Nielsen, 2016a: Jensen, 2012: Jensen & Cobbs, 2014). This change will allow sponsors to gain brand recognition both during the live event, and during commercial breaks. One such sponsor to utilize this type of marketing mix is Allstate, who partners with over 80 universities to have their logo hanging in the field goal netting, while also partnering with networks for the more traditional advertisement during commercial breaks. The prior research, combined with the recent data regarding the increase in popularity of live television programming, delineates how the same framework can be used to estimate the value of multimedia rights.
BROADCAST RIGHTS FEES
The literature published by Mawson and Bowler III (1989) regarding the NCAA TV broadcast rights fees prior to the 1984 ruling, when compared to the study done by Jensen, Turner, and McEvoy (2015) about modern broadcast rights fees as related to conference
affiliation, clearly illustrates that as demand for college sports increased, so did broadcast rights fees.
Following the Supreme Court decision broadcast rights fees have propagated
significantly more revenues for the NCAA, individual conferences and member institutions. The increased deals have resulted in considerably larger payouts to member institutions who have become more reliant on TV money to fund their athletic departments. There are numerous examples of recent broadcast rights contracts that illustrate the increased demand for
Hiestand, 2012). That same year the Big 12 who also happened to add two additional schools, West Virginia University and Texas Christian University, entered into a 13-year, $2.6 billion-dollar contract with ESPN and Fox (Smith 2012a, b). In 2016 the Big 12 flirted with another expansion, but ultimately decided against it when ESPN reportedly offered to pay an additional $10 million annually for the remainder of their contract (Bromberg, 2016). The Pac-12 partnered with ESPN and Fox, signing the largest ever broadcast rights contract at the time, worth $3 billion over 12 years, paying out over $250 million each season (Bachman, 2013). That record did not last long, with the Big Ten’s new deal signed in 2016. The Big Ten signed a 6 year deal with Fox, ESPN, and CBS that will bring in $440 million annually, resulting in member
institutions receiving $32.4 million each year (Ourand, 2016b: Dochterman, 2016).
The increases that we have seen between 1984 and 2016 in broadcast rights fees are one of the biggest indicators of demand that exists in sport. Although the total number of television viewers has actually declined in recent years broadcast rights fees continue to go up. Companies see the value in live sport, but they look carefully at which conferences and which universities will provide them the largest return on investment. It is through the use of broadcast rights fees, attendance, and television ratings that we can begin to see a clear picture about what drives demand for collegiate athletic departments.
THEORETICAL FRAMEWORK
This thesis is guided by the use of economic demand theory, which will help explain how the demand for college athletics, as demonstrated through fan attendance, television ratings, and broadcast rights fees, have impacted the value of individual institutions multimedia rights contracts.
CHAPTER 3
INSTRUMENTS
The primary research method employed for this study was contract review and
descriptive statistical analysis. This is comparable with Wishart et al. (2012) who advised using the actual contracts when attempted to analyze sponsorship costs. Per the review of each
multimedia rights contract, the study identified which media rights holder the institution is partnered with, as well as the size of the guaranteed rights fees they receive. Following the contract review, quantitative analysis was used to detect differences in sample means and determine whether the findings were statistically significant. If the results indicated statistical significance, it is necessary to determine if that significance is relevant when applied in a real-world context.
DRAWING THE SAMPLE
Table 1
Contracts Analyzed
School Annual Fee
(2015/2016) Rights Holder Conference
Texas $12,728,829 IMG Big 12
Nebraska $11,250,000 IMG Big Ten
Georgia $10,600,000 IMG SEC
Ohio State $10,315,000 IMG Big Ten
UCLA $10,000,000 IMG Pac-12
Kentucky $9,250000 JMI SEC
Connecticut $8,608,000 IMG American
LSU $8,000,000 IMG SEC
Michigan $7,750,000 IMG Big Ten
Auburn $7,500,000 Fox Sports Net SEC
North Carolina $7,127,769 Learfield ACC
Wisconsin $7,075,000 Learfield Big Ten
Arizona $6,990,000 IMG Pac-12
Michigan State $6,875,000 Fox Sports Net Big Ten
Oregon $6,800,000 IMG Pac-12
Iowa $6,607,000 Learfield Big Ten
Washington $6,500,000 IMG Pac-12
Kansas $6,350,000 IMG Big Ten
Oklahoma State $6,245,000 Learfield Big 12
West Virginia $6,201,000 IMG Big 12
Tennessee $6,191,862 IMG SEC
Florida State $5,900,000 IMG ACC
Louisville $5,650,000 Learfield ACC
Georgia Tech $5,450,000 IMG ACC
Rutgers $5,150,000 IMG Big Ten
Minnesota $5,125,349 Learfield Big Ten
Virginia $5,100,000 Outfront Media ACC
Virginia Tech $4,950,000 IMG ACC
New Mexico $4,768,000 Learfield Mountain West
North Carolina State $4,675,000 Learfield ACC
Kansas State $4,550,000 Learfield Big 12
Indiana $3,855,000 Learfield Big Ten
Purdue $3,850,000 Learfield Big Ten
Texas A&M $3,713,000 Learfield SEC
Texas Tech $3,475,000 Learfield Big 12
Iowa State $3,450,000 Learfield Big 12
Missouri $3,355,000 Learfield SEC
Boise State $2,935,000 Learfield Mountain West
Cincinnati $2,700,000 IMG American
Clemson $2,600,000 JMI ACC
South Florida $2,276,000 IMG American
Washington State $2,250,000 IMG Pac-12
Memphis $2,225,000 Learfield American
Oregon State $2.050,000 Learfield Pac-12
San Diego State $1,823,000 Learfield Mountain West
Nevada $1,800,000 IMG Mountain West
Texas El Paso $1,650,000 IMG Conference USA
East Carolina $1,625,000 IMG American
Western Kentucky $1,500,000 IMG Conference USA
Marshall $1,400,000 IMG Conference USA
Texas San Antonio $1,375,000 Learfield Conference USA
Southern Mississippi $1,230,000 IMG Conference USA
Louisiana Monroe $1,000,000 Self Sold Sun Belt
Middle Tennessee
State $900,000 Learfield Conference USA
Florida Atlantic $800,000 Nelligan Conference USA
Idaho $760,000 Learfield Sun Belt
Bowling Green $675,000 Learfield MAC
Georgia Southern $675,000 Learfield Sun Belt
Appalachian State $640,000 IMG Sun Belt
Ohio $625,000 IMG MAC
Akron $470,000 IMG MAC
Northern Illinois $425,000 IMG MAC
ACQUIRING THE CONTRACTS
An online database of multimedia rights contracts created by Portland Business Journal writer Matt Kish (Kish, 2017) was utilized. To create the database, public records requests to each of the 106 public institutions. The database consisted of 83 of the 106 possible contracts, however, not all contracts were accessible due to redactions.
CONTRACT REVIEW
by year basis for the duration of the contract. Conference affiliation was also recorded for each school according to that year’s guaranteed rights payment.
STATISTICAL ANALYSIS
Descriptive statistics and mean comparisons were utilized using the collected data. Descriptive statistics such as mean, maximum and minimum were used to illustrate differences within conferences, between “Power 5” and “Group of 5” schools, between various rights holders, and within Division 1 FBS as a whole.
CHAPTER 4
DESCRIPTIVE STATISTICS
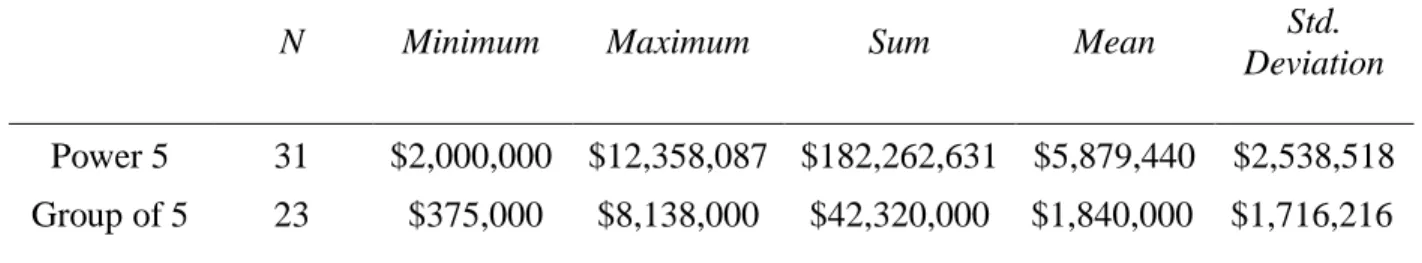
After conducting an analysis of descriptive statistics, as found in Table I, the results reveal that $224.6 million dollars (M=$4.16 million, SD=$2.99 million) was spent across the 54 multimedia rights agreements during the 2015-2016 school year. The smallest financial payout is $375,000 and belongs to Northern Illinois, while the largest contract $12,358,087 million,
belonging to the University of Texas.
The disparity among institutions becomes more evident when analyzing the multimedia rights contracts. Of the $224.6 million dollars spent during the 2015-2016 season, $182.3 million was spent on institutions who compete in one of the “Power 5” conferences, meaning that the 31 “Power 5” institutions in this study receive 81.2% of the multimedia rights money. As seen in Table II, the average “Power 5” institution receives an average payment of $5.879 million dollars with a SD of $2.539 million. The “Group of 5” institutions received a sum of $42.32 million from multimedia rights contracts during the 2015-2016 season, roughly $139 million less than their “Power 5” counterparts. As seen in Table II, the average payout for a “Group of 5” institution is $1.84 million with a SD of $1.72 million.
Table III shows that within the “Power 5” conferences the Big Ten Conference has the highest average payout at $6.58 million (SD = $2.57 million), followed by the SEC
Conference receive the highest average payouts among the “Group of 5”, with an average
guarantee of $3.32 million (SD= $2.72 million). Behind the American is the Mountain West (M= $2.78 million, SD= $1.29 million), Conference USA (M= $1.16, SD= $322,348), Sun Belt (M= $750,000, SD= $216,506) and lastly, with the smallest average guarantees, the MAC (M= $476,667, SD= $114,054).
IMG College is largest rights holder, both in terms of number of contracts, 29, and in terms of total spending during the 2015-2016 season, $131.43 million. In terms of total spending, IMG is followed by Learfield (Sum = $82.3 million), JMI (Sum = $11.9 million). It is important to note that JMI is relatively new when it comes to college multimedia rights contracts, and only has two institutions, which is reflected in their low total payout. However, as illustrated in Table V, JMI has a higher average payout than the two larger companies, IMG and Learfield,
(M=$5.93 million, SD= $4.7 million). JMI will see an increase in their average payout during the 2016-2017 as well as during the 2017-2018 seasons with addition of Clemson who will make $2.6 million to $7.7 million during the respective seasons. IMG and Learfield are relatively similar in average payouts, with IMG averaging $4.53 million (SD = $3.52 million) and Learfield averaging $3.74 million (SD= $1.87 million). IMG and Learfield, both with over 20 contracts a piece have a far greater range of contract sizes, with IMG controlling both the smallest payout, $375,000, and the largest payout, $12.36 million.
Table II
“Power 5” and “Group of 5” Descriptive Statistics
N Minimum Maximum Sum Mean Std.
Deviation
Table III
“Power 5” Descriptive Statistics by Conference
N Minimum Maximum Sum Mean Std.
Deviation
ACC 6 $4,525,000 $7,034,852 $32,209,852 $5,368,309 $889,364 Big Ten 9 $3,650,000 $10,750,000 $59,203,082 $6,578,120 $2,568,471 Big 12 7 $3,275,000 $12,358,087 $41,167,087 $5,881,012 $3,099,329 Pac 12 4 $2,000,000 $6,767,500 $17,167,500 $4,291,875 $2,569,260 SEC 5 $3,315,000 $10,500,000 $32,515,110 $6,503,022 $3,208,038
Table IV
“Group of 5” Descriptive Statistics by Conference
N Minimum Maximum Sum Mean Std.
Deviation
American 5 $1,525,000 $8,138,000 $16,614,000 $3,322,800 $2,721,248
MAC 3 $375,000 $600,000 $1,430,000 $476,667 $114,054
Sun Belt 3 $625,000 $1,000,000 $2,250,000 $750,000 $216,506 Conference USA 7 $700,000 $1,575,000 $8,120,000 $1,160,000 $322,348 Mountain West 5 $1,430,000 $4,668,000 $13,906,000 $2,781,200 $1,287,911 Table V
Multimedia Rights Descriptive Statistics by Company
N Minimum Maximum Sum Mean Std.
Deviation
CORRELATION RESULTS
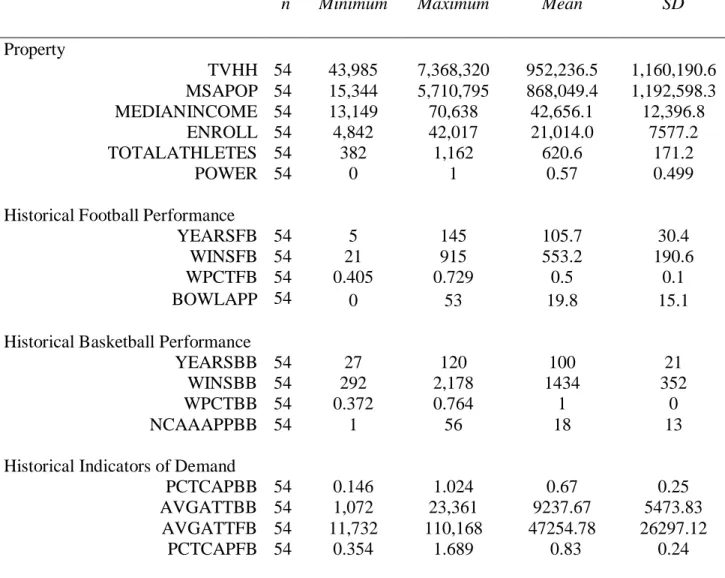
The variables outlined in Table VI were used in an attempt to explain the effect that numerous factors have on the guaranteed rights fee that a university receives from a third-party rights holder. Those variables were separated into four-categories; property-related, football performance, basketball performance, and demand indicators. From there, a Pearson product-moment correlation was applied to all of the variables, with the results being located in Tables VII through XI. It is important to note that of the 21 variables tested, 18 showed a significant positive correlation, with p < .05, and eight of the 18 had r values greater than .50.
Research question three asked whether certain aspects of individual institutions are statistically significant predictors of guaranteed multimedia rights fees, based on student body enrollment, number of student-athletes, and the media market in which the institutions resides. As indicated in Table VII, this was the case for two of the three variables: enrollment and number of student-athletes. The correlation between enrollment and rights fees was .476, which was significant at the p < .01 level, and the correlation between number of student-athletes and rights fees was .581, which was also significant at the p < .01 level.
Research question four sought to determine whether an institution’s guaranteed multimedia rights fee can be predicted by historical performance in football and men’s
wins, win percentage, and NCAA post season appearances, with the fourth indicator, years with a program, showing significant correlation at the p <.05 level.
Table VI
Demand Indicators Descriptive Statistics
n Minimum Maximum Mean SD
Property
TVHH 54 43,985 7,368,320 952,236.5 1,160,190.6 MSAPOP 54 15,344 5,710,795 868,049.4 1,192,598.3
MEDIANINCOME 54 13,149 70,638 42,656.1 12,396.8
ENROLL 54 4,842 42,017 21,014.0 7577.2
TOTALATHLETES 54 382 1,162 620.6 171.2
POWER 54 0 1 0.57 0.499
Historical Football Performance
YEARSFB 54 5 145 105.7 30.4
WINSFB 54 21 915 553.2 190.6
WPCTFB 54 0.405 0.729 0.5 0.1
BOWLAPP 54 0 53 19.8 15.1
Historical Basketball Performance
YEARSBB 54 27 120 100 21
WINSBB 54 292 2,178 1434 352
WPCTBB 54 0.372 0.764 1 0
NCAAAPPBB 54 1 56 18 13
Historical Indicators of Demand
PCTCAPBB 54 0.146 1.024 0.67 0.25
AVGATTBB 54 1,072 23,361 9237.67 5473.83
AVGATTFB 54 11,732 110,168 47254.78 26297.12
Table VII
Property-Related Variables
1 2 3 4 5 6 7
1. RIGHTS FEE -
2.TVHH .135 -
3. MSAPOP .158 .219 -
4. MEDIAN INCOME .272* .051 .407** -
5. ENROLL .476** .143 .105 .276* -
6. POWER .566** .053 -.034 .274* .585** -
7. TOTAL ATHLETES .581** .135 .102 .305* .626** .609** - *. Correlation is significant at the 0.05 level (2-tailed).
** Correlation is significant at the 0.01 level (2-tailed). Table VIII
Historical Football Performance Variables
1 2 3 4 5
1. RIGHTS FEE -
2. YEARSFB .404** -
3. WINSFB .464** .827** -
4. BOWLAPP .582** .437** .744** -
5. WPCTFB .314* .226 .709** .704** -
* Correlation is significant at the 0.05 level (2-tailed). ** Correlation is significant at the 0.01 level (2-tailed). Table IX
Historical Basketball Performance Variables
1 2 3 4 5
1. RIGHTS FEE -
2. YEARSBB .334* -
3. WINSBB .415** .802** -
4. PCTBB .371** .399** .826** -
5. NCAAAPPBB .557** .404** .788** .840** -
Table X
Historical Indicators of Demand
1 2 3 4 5 6 7
1. RIGHTS FEE -
2. PCTCAPBB .524** -
3. AVGATTBB .559** .864** -
4. AVGATTFB .637** .422** .452** -
5. PCTCAPFB .255 .178 .155 .543** -
6. STADCAPFB .634** .429** .469** .899** .185 -
7. STADCAPBB .499** .575** .880** .460** .126 .469** -
*. Correlation is significant at the 0.05 level (2-tailed). ** Correlation is significant at the 0.01 level (2-tailed).
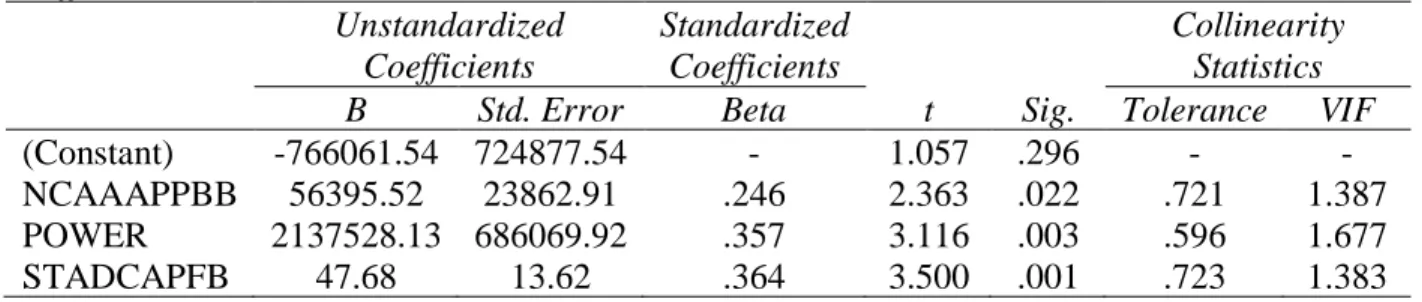
PREDICTIVE MODELING
Once the performance variables were analyzed using both descriptive statistics and a series of bivariate correlations, a stepwise linear regression was applied. This procedure is similar to the one utilized by Jensen et al. (2015) in their paper on athletic apparel contracts,and was employed to develop a possible set of predictor variables that could be used to project whether or not universities were receiving sufficient compensation via their multimedia guaranteed rights payments. The step wise multiple linear regression reduces the chance of multicollinearity while also maintaining informative capabilities.
membership in a Power 5 conference is worth $2,137,528 in increased revenue to the respective university.
Table XI
Model Summary
R R2 Adjusted R2 Std. Error of the
Estimate
.780a .609 .585 $1,925,131.946
a. Predictors: (Constant), STADCAPFB, NCAAAPPBB, POWER
Table XII
Coefficients Table
Unstandardized Coefficients
Standardized Coefficients
Collinearity Statistics
B Std. Error Beta t Sig. Tolerance VIF
(Constant) -766061.54 724877.54 - 1.057 .296 - -
NCAAAPPBB 56395.52 23862.91 .246 2.363 .022 .721 1.387
POWER 2137528.13 686069.92 .357 3.116 .003 .596 1.677
CHAPTER 5
IMPLICATIONS
This thesis investigated the relationship of multimedia rights contracts between third party rights holders and intercollegiate athletic departments, yielding several important results that will help collegiate administrator’s secure fair multimedia rights contracts.
Analysis into the data revealed financial differences in projected guaranteed multimedia rights payments based upon an institution membership in the “Power 5” or “Group of 5”. Being in a “Power 5” conference garnered institutions more money, however, according to the
predictive model, four of the five “Power 5” conferences were being underpaid. Institutions in the ACC were underpaid the most, cumulatively receiving $2.5 million less than they should have. Following the ACC is the Pac-12, who was underpaid by $2.18 million, the SEC who was underpaid $1.26 million and the Big-12 who was underpaid $34,990. The only conference, when their institutions totals were added together, resulted in being overpaid was the Big Ten. They were overpaid $4.12 million, with $7.29 million in overpayment attributed to two institutions, Nebraska and Ohio State.
institutions are overpaid more than they are underpaid, with three of the five conferences being overpaid. Both the Mountain West and American Athletic Conference, who have universities vying for membership into “Power 5” conferences, could be the factor for the overpayment of guaranteed rights fees.
The results also show that while IMG is the largest in the multi-media industry, they are unable to utilize this position for their favor. Application of the predictive model reveals that IMG should be paying around $117 million for 29 contracts. Rather, IMG overpaid by $13.9 million, paying $131 million. This is further illustrated in Table XIII showing that IMG has seven of the top ten overpaid multimedia rights contracts. An example of this is the University of Connecticut, who should be receiving $3 million for the 2015-2016 season, but receives $8.14 million. Connecticut is not alone, IMG pays millions more than predicted to Nebraska, Texas, Georgia, and many others.
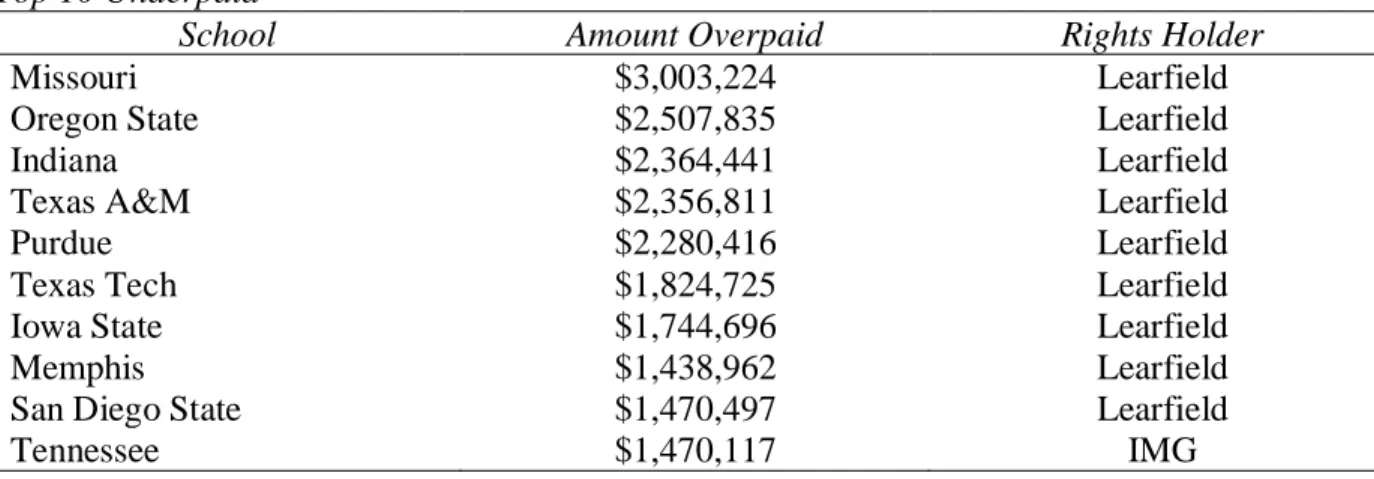
Learfield, IMG’s chief competitor, who was challenging IMG for market dominance prior to merging, consistently pays less than what the predictive model would suggest. As indicated by the predictive model, the 22 universities Learfield partners with should cost them $95.5 million in annual guaranteed rights payments. However, Learfield only paid $82.3 million, saving more than $13.2 million. Table XIV illustrates the extent to which they have been able to secure well known universities at a fraction of the cost.
Table XIII
Top 10 Overpaid
School Amount Overpaid Rights Holder
Connecticut $5,135,889 IMG
Nebraska $5,117,508 IMG
Texas $4,352,094 IMG
Georgia $4,029,843 IMG
New Mexico $2,718,007 Learfield
Ohio State $2,065,086 IMG
Boise State $1,467,207 Learfield
Kentucky $1,331,045 JMI
UNLV $1,083,601 IMG
Rutgers $839,258 IMG
Table XIV
Top 10 Underpaid
School Amount Overpaid Rights Holder
Missouri $3,003,224 Learfield
Oregon State $2,507,835 Learfield
Indiana $2,364,441 Learfield
Texas A&M $2,356,811 Learfield
Purdue $2,280,416 Learfield
Texas Tech $1,824,725 Learfield
Iowa State $1,744,696 Learfield
Memphis $1,438,962 Learfield
San Diego State $1,470,497 Learfield
Tennessee $1,470,117 IMG
significance for market-based variables, it can be said with greater confidence, multimedia rights companies can enter into agreements with universities in large media markets at a cost far lower than what the market dictates (Jensen et al, 2015). The predictive model that was applied is especially useful to collegiate administrators and multimedia rights holders alike. Both parties will be able to have a better understanding of value, as it pertains to a universities athletic department, allowing them to engage in more empirically driven negotiations.
While the findings illuminate a growing disparity between the “Power 5” and the “Group of 5”, perhaps more importantly, they illustrate the growing value for multimedia rights
institutions. They will either have to make a market correction or risk losing some of their biggest clients.
LIMITATIONS
A major limitation of this thesis was all of the relevant data was limited to contracts between multimedia rights companies and public universities. Although public universities are required by law to turn over such data, many universities chose not to do so, or if they did comply with the public records request, redacted all relevant information. The failure to comply, paired with private universities not being subject to the same laws, meant that some major
universities, who would likely have lucrative contracts, were left out of the thesis. Such contracts not included that would have impacted the thesis include, Alabama, University of Florida, Duke University, and University of Southern California, to name a few. Further research could collect additional public university contracts to improve the sample size. Should a university choose to redact certain contractual information there are legal steps which could be taken to force them to provide the complete information.
Another limitation this thesis faced was the predictor variables used were based upon previous research with an emphasis on sport sponsorship; and although they explained 60% of the variance, there are some variables not collected which could supply additional information. One such variable missing is the number of times that a university has a team televised, because it is likely that these multimedia rights companies value institutions who have greater television exposure. Future research may try to find a way to track television exposure and include that metric with the data used in this thesis.
multi-could be extrapolated out further, providing more concrete results that university officials multi-could use in their negotiations. The usage of qualitative analysis, to support the quantitative data, would help to build upon the results of this thesis. Each one of the contracts is written
differently, and contain specific rights, so performing an analysis on the contracts themselves to determine commonalities or differences would help to further explain the data.
CONCLUSION
The sale of multimedia rights within the intercollegiate landscape has become a source of much-needed revenue for institutions across the country; and as the landscape continues to shift, with universities spending more and more money in order to succeed, there is a greater need to accurately predict and plan for future financial needs. With television contracts encompassing “Tier I”, “Tier II” and “Tier III” rights, these multimedia rights contracts are the last vestige of rights institutions control, making it that much more vital they maximize the potential revenue of those rights. The first of its kind, this thesis explored multimedia rights contracts and the
variables which have significant impact on the size of those contracts. They now know, based upon the empirical evidence, that on-field performance (men’s basketball post season wins), as well as consumer demand (football stadium capacity), are significant predictive variables for an institutions multimedia guaranteed rights fee. Market variables, once thought to be an important factor for sponsorship value, should not be considered when predicting an institution’s
guaranteed rights fee due to the lack of significance and low impact on the total variance. The predictive model showed that IMG, while dominating the marketplace, have been forced to consistently over pay to maintain this advantage. Also, the data show that Learfield, IMG’s chief competition, has been able to frequently underpay. Meanwhile the newcomer, JMI, is
A PPENDIX
APPENDIX A
REFERENC ES
Angell, R., Gorton, M., Sauer, J., Bottomley, P., & White, J. (2016). Don't distract me when I'm media multitasking: Toward a theory for raising advertising recall and recognition. Journal of Advertising, 45(2), 198-210. doi:10.1080/00913367.2015.1130665
Belloni, M. (2016). Ari emanuel and patrick whitesell unleashed: WME-IMG's strategy, IPO plans, china and the doubters. Retrieved
from http://www.hollywoodreporter.com/features/ari-emanuel-patrick-whitesell-unleashed-879003
Bennett, R., & Fizel, J. (1995). Telecast deregulation and competitive balance: Regarding NCAA division I American Journal of Economics and Sociology, Inc.
Brewer, R. M., & Pedersen, P. M. (2013). A method for the financial valuation of national collegiate athletic association football bowl subdivision programs. Journal of Contemporary Athletics; Hauppauge, 7(3), 175-195. Retrieved
from http://search.proquest.com.libproxy.lib.unc.edu/docview/1627082435/abstract/E411C0 7DB89F4AF9PQ/1
Bromerg, N. (2016). Report: ESPN pays big 12 $10M in restructured TV contract after
conference doesn't expand. Retrieved from http://sports.yahoo.com/news/report-espn-pays-big-12-10m-in-restructuring-tv-contract-after-conference-doesnt-expand-144449541.html Burnsed, B. (2014). Growth in division I athletics expenses outpaces revenue increases.
Retrieved from http://www.ncaa.org/about/resources/media-center/news/growth-division-i-athletics-expenses-outpaces-revenue-increases
Byers, W., & Hammer, C. H. |. (1995). Unsportsmanlike conduct : Exploiting college athletes. Ann Arbor: University of Michigan Press.
Cornwell, T. B., Pruitt, S. W., & Clark, J. M. (2005). The relationship between major-league sports’ official sponsorship announcements and the stock prices of sponsoring firms. Journal of the Academy of Marketing Science, 33(4), 401-412. doi:10.1177/0092070305277385 Den Hondt, M., Vanaudenaerde, B., & Vranckx, J. J. (2017). Abstract. Plastic and
Reconstructive Surgery - Global Open, 5, 8. doi:10.1097/01.GOX.0000512411.04866.52 Dochterman, S. (2016). Big ten's delany confirms six-year TV deal, offers clue on retirement.
Retrieved from http://www.thegazette.com/subject/sports/big-tens-delany-confirms-six-year-tv-deal-offers-clue-on-retirement-20160726
Dunnavant, K. (2004). The 50 year seduction & nbsp; (1st ed.). New York, New York: St. Martin Press.
Galily, Y. (2014). When the medium becomes “Well done”: Sport, television, and technology in the twenty-first century. Television & New Media, 15(8), 717-724.
doi:10.1177/1527476414532141
Greenhouse, L. High court ends n.c.a.a. control of tv football. Retrieved
from http://www.nytimes.com/1984/06/28/us/high-court-ends-ncaa-control-of-tv-football.html
Greenspan, D. (1988). College football's biggest fumble: The economic impact of the supreme court's decision in national collegiate athletic association v. board of regents of the
university of oklahoma domestic antitrust. Antitrust Bulletin 33.1:
Hall, C. (2016). Dallas’ learfield sports has divided allegiance to alabama and clemson in monday’s championship | business. Retrieved
from http://www.dallasnews.com/business/business/2016/01/08/dallas-learfield-sports-has-divided-allegiance-to-alabama-and-clemson-in-mondays-championship
Hiestand, M. (2012). Long-term: ESPN lands ACC TV rights through 2027. Retrieved
from http://content.usatoday.com/communities/gameon/post/2012/05/talk-about-long-term-espn-lands-acc-tv-rights-through-2027/1
Hinnen, J. ESPN reaches 12-year deal to air college football playoffs. Retrieved
from http://www.cbssports.com/collegefootball/eye-on-college-football/21083689/espn-reaches-12year-deal-to-air-college-football-playoffs
Jensen, J. A. (2012). The importance of winning: An analysis of the relationship between an athlete's performance and sponsor exposure during televised sports events. International Journal of Sports Marketing & Sponsorship, 13(4), 282-294.
Jensen, J. A. (2015). The path to global sport sponsorship success: An event history analysis modeling approach Available from Dissertations & Theses Europe Full Text: Business. Retrieved from http://search.proquest.com/docview/1701979406
Jensen, J. A., & Cobbs, J. (2014a). Analyzing return-on-investment in sponsorship: Modeling brand exposure, price and ROI in formula one automotive competition. (). Rochester, NY: Retrieved from https://papers.ssrn.com/abstract=2322589
Jensen, J. A., & Cobbs, J. (2014b). Predicting return on investment in sport sponsorship
modeling brand exposure, price, and ROI in formula one automotive competition. Journal of Advertising Research, 54(4), 447; 447.
Jensen, J., Turner, B., & McEvoy, C. (2015). Resource valuation of non-profit organizations: The case of the intercollegiate athletics industry. International Review on Public and Nonprofit Marketing, 12(2), 169-187. doi:10.1007/s12208-015-0132-9
Jonathan A. Jensen, & Brian A. Turner. (2014). What if statisticians ran college football? A re-conceptualization of the football bowl subdivision. Journal of Quantitative Analysis in Sports, 10(1), 37-48. doi:10.1515/jqas-2013-0071
Kaempfer, W. H., & Pacey, P. L. (1986). Televising college football: The complementarity of attendance and viewing & nbsp; University of Texas at Austin:
Kish, M. (2013). See what your university gets from nike, adidas or under armour (database). Retrieved
from http://www.bizjournals.com/portland/blog/threads_and_laces/2013/12/database-nike-adidas-under-armour-ncaa.html
Kish, M. (2017). Marketing madness: Expansive marketing deals renew debate about corporate influence on campus. Retrieved
from https://www.bizjournals.com/portland/news/2017/03/09/marketing-madness-expansive-marketing-deals-renew.html
Mawson, L. M., & Bowler III, W. T. (1989). Effects of the 1984 supreme court ruling on the television revenues of NCAA division I football programs. Journal of Sport
Management, 3(2), 79-89.
McCarthy, M. (2013). Are sports prices too high to deliver return on investment? Retrieved from http://adage.com/article/media/sports-prices-soar-deliver-return-investment/240749/ Nathan Tomasini, Chris Frye, & David Stotlar. (2004). National collegiate athletic association
corporate sponsor objectives: Are there differences between divisions A, AA, and I-AAA?
Nielsen. (2015). Local television market, 2016. Retrieved
from http://www.nielsen.com/content/dam/corporate/us/en/public%20factsheets/tv/2016-local-television-market-universe-estimates.pdf
Ourand, J. (2011). How high can rights fees go? Retrieved
from http://www.sportsbusinessdaily.com/Journal/Issues/2011/06/06/In-Depth/Rights-Fees.aspx
Ourand, J. (2016a). Does media rights bubble have a leak? Retrieved
from http://www.sportsbusinessdaily.com/Journal/Issues/2016/05/02/In-Depth/Media-rights.aspx
Ourand, J. (2016b). ESPN stays in the game. Retrieved
from http://www.sportsbusinessdaily.com/Journal/Issues/2016/06/20/Media/ESPN-Big-Ten.aspx
Pacey, P. L., & Wickham, E. D. (1985). College football telecasts: Where are they going? Economic Inquiry, 23(1), 93-113. doi:10.1111/j.1465-7295.1985.tb01754.x
Popp, N., DeSchriver, T., McEvoy, C., & Diehl, M. A. (2016). A valuation analysis of corporate naming rights for collegiate sport venues. Sport Marketing Quarterly, 25(1), 7. Retrieved from https://search.proquest.com/docview/1784876627
Price, D. I., & Sen, K. C. (2003). The demand for game day attendance in college football: An analysis of the 1997 division 1-A season. Managerial and Decision Economics, 24(1), 35-46. doi:10.1002/mde.1100
Rainey, J. (2015). WME/IMG’s college sports unit struggles to meet lofty goals. Retrieved from http://variety.com/2015/biz/news/wme-img-worldwide-acquisition-1201539393/ Rovell, D. (2014). Kentucky sells marketing rights to JMI sports. Retrieved
from http://www.espn.com/college-sports/story/_/id/11122483
Scully, T. (1985). NCAA v. board of regents of the university of oklahoma: E NCAA's television plan is sacked by the sherman act. Washington, DC: Cathol. Univ. Press.
Shafer, L. (2013). The tie that binds: An examination of the relationship between fan motivations and sponsorship recognition among college sport consumers Available from Dissertations & Theses @ University of North Carolina at Chapel Hill. Retrieved
from http://search.proquest.com/docview/1438852831
Sherman, R. (2016). NCAA will now make $1 billion from TV rights. Retrieved
from http://www.sbnation.com/college-basketball/2016/4/12/11415764/ncaa-tournament-tv-broadcast-rights-money-payout-cbs-turner
Smith, C. (2012). The ACC's third tier rights and why they're killing the conference. Retrieved from https://www.forbes.com/sites/chrissmith/2012/06/04/the-accs-third-tier-rights-and-why-theyre-killing-the-conference/#3af481996375
Smith, M., & Ourand, J. (2011). Expanding ACC will reopen ESPN deal. Retrieved
from http://www.sportsbusinessdaily.com/Journal/Issues/2011/09/26/Colleges/ACC.aspx Tainsky, S. (2010). Television broadcast demand for national football league contests. Journal of
Upton, J., & Berkowitz, S. (2012). Budget disparity growing among NCAA division I schools. Retrieved from http://www.usatoday.com/sports/college/story/2012-05-15/budget-disparity-increase-college-athletics/54960698/1