DESIGN AND CHARACTERIZATION OF A MICROFLUIDIC FLOW CYTOMETER
Joshua K. Herr
A dissertation submitted to the faculty of the University of North Carolina at Chapel Hill in partial fulfillment of the requirements for the degree of Doctor of Philosophy in the Department of Chemistry.
Chapel Hill 2010
Approved by:
Professor J. Michael Ramsey Professor James Jorgenson Professor Mark Schoenfisch Professor Norman Sharpless
ABSTRACT Joshua K. Herr
DESIGN AND CHARACTERIZATION OF A MICROFLUIDIC FLOW CYTOMETER
(Under the direction of J. Michael Ramsey)
The development and characterization of a microfluidic flow cytometer is described in this dissertation for rapid, inexpensive fluorescence and scatter based cellular enumeration for biomedical diagnostic and monitoring applications. Microfluidic cytometry enables a portable, economical platform for performing point-of-care cellular assays that are impractical with large conventional flow cytometry systems. Microchips were fabricated from glass using standard photolithography and wet chemical etching techniques. These chips were used in conjunction with static optical and electronic components to construct a robust instrument capable of accepting disposable microchips. Flow cytometry measurements on-chip have demonstrated cellular analysis at rates greater than 2 kHz using vacuum driven flow, and positive pressure driven flow cytometry has been performed to measure cells at 12 kHz. Measurement precision has been investigated using commercially available calibration beads, and results demonstrate that the precision of chip based cytometry measurements is close to that seen using conventional instrumentation.
demonstrate the applicability of this instrument for clinical cellular diagnostic and monitoring applications. Comparison studies have been performed using conventional cytometry instrumentation to assess the accuracy of our microfluidic system for immunophenotyping applications.
Efforts have also been made to incorporate erythrocyte lysis on-chip in order to rapidly analyze whole blood in an automated fashion. Chemical erythrocyte lysis followed by leukocyte cytometry has been integrated on a single monolithic device to demonstrate the ability to accurately measure cell subtype ratios from a whole blood sample while reducing off-chip sample processing steps. Further, applications in blood dosimetry are described to reveal potential advantages of performing rapid blood cell counts for therapeutic monitoring and bioterrorism applications using only a fingerstick of whole blood.
ACKNOWLEDGEMENTS
I cannot begin to express how grateful I feel for having the help, advice, and support from so many people who have influenced me over the years and helped me to get to this point. I first would like to acknowledge Dr. Ramsey who has been very supportive of my work while allowing me to independently pursue my experimental curiosities throughout my graduate school career. The advice and guidance I have received from him over the past 5 years have helped me greatly both in my graduate studies and in the alignment of my professional goals. I have also received a great deal of help from Jean Alarie over the years, and I greatly appreciate his support and admire his dedication to helping everyone in our group with their issues while maintaining our smoothly running research lab. Others in the Ramsey group including Dr. Kevin Braun, Dr. Scott Mellors, and Dr. Hamp Henley have been great assets throughout my graduate career, and I appreciate both their friendship and their willingness to assist me whenever I asked. I am also very appreciative of the help I have received by Jeff SooHoo and Soren Johnson in the design, preparation, and execution of our specific projects.
my path towards a graduate degree in chemistry. I also had the opportunity to perform undergraduate research in the group of Professor Weihong Tan. Dr. Tan provided me with an excellent opportunity to make an impact in his group in a short amount of time, and I am grateful for the opportunity to work for him. Two members of the Tan group, Dr. James Yang and Dr. Steven Suljak were particularly helpful during my time as an undergraduate researcher. Both James and Steve had a significant impact on my development as a scientist, and I am glad to have had the opportunity to work with them as I learned a great deal about designing experiments from them.
TABLE OF CONTENTS
Page
LIST OF FIGURES………..…xiii
LIST OF ABBREVIATIONS………xviii
LIST OF SYMBOLS………xxi
Chapter 1 FOUNDATIONS FOR FLOW CYTOMETRY BASED ON MICROFLUIDIC TECHNOLOGY……….………...1
1.1 Introduction….………..1
1.2 Microfluidics Background………...….4
1.3 Microfluidics Theory………...….7
1.4 Flow Cytometry Background………...….8
1.5 Flow Cytometry Instrumentation……..………...…...11
1.6 Microfluidics for Cellular Applications………...14
1.7 Concluding Remarks………...…16
1.8 Figures………...……..18
2 DESIGN AND CONSTRUCTION OF THE MICROFLUIDIC
FLOW CYTOMETRY SYSTEM………...29
2.1 Introduction……..………....29
2.2 Theory………..30
2.2.1 Hydrodynamic Focusing………30
2.2.2 Laser Beam Shaping………..31
2.3 Microchip Design………32
2.4 Experimental………35
2.4.1 Computational Fluid Dynamic Simulations………...…35
2.4.2 Microchip Fabrication………36
2.4.3 Surface Modification……….37
2.4.4 Optical Instrumentation……….37
2.4.5 Signal Processing………...39
2.5 Conclusions………..39
2.6 Figures………..41
2.7 References………48
3 CHARACTERIZATION OF THE MICROFLUIDIC FLOW CYTOMETRY SYSTEM…....………49
3.1 Introduction………..49
3.2 Experimental………50
3.2.1 Optical Imaging….………...50
3.2.2 Cell Handling……….………...50
3.2.3 Cytometry Comparison Experiments………51
3.3.1 Characterizing Hydrodynamic Focusing Performance……….51
3.3.2 Cytometry Measurement Precision……….52
3.3.3 Assessment of System Throughput……….54
3.3.4 Scatter Based Detection………..55
3.4 Conclusions.………56
3.5 Figures….……….59
3.6 References………67
4 IMMUNOPHENOTYPING ON-CHIP……..……….68
4.1 Introduction………..68
4.2 Experimental………..………..69
4.2.1 Cell Handling and Labeling……….69
4.2.2 Preparation of Peripheral Blood Mononuclear Cells………...70
4.2.3 Cytometry Comparison Experiments………...70
4.3 Results.………71
4.3.1 Immunophenotyping Cultured Cells………71
4.3.2 Rare Cell Detection………72
4.3.3 Lymphocyte Characterization From Peripheral Blood Mononuclear Cells………...73
4.4 Conclusions………..73
4.5 Figures………..76
4.6 References………80
5.1 Introduction………..81
5.2 Experimental……….………...………83
5.2.1 Microchip Fabrication…....………..………83
5.2.2 Detection Configuration………...…83
5.2.3 Blood and Cultured Cell Handling……….…….84
5.2.4 Cytometry Comparison Experiments………...84
5.3 Results………..……85
5.3.1 Microchip Operation………85
5.3.2 Lysis Efficiency………...86
5.3.3 Lysis Selectivity………...…87
5.3.4 Immunophenotyping Erythrocyte Depleted Blood Samples……...88
5.4 Conclusions………89
5.5 Figures.……….91
5.6 References………95
6 MONITORING LEUKOCYTE DEPLETION ON-CHIP – MOUSE BLOOD DOSIMETRY………...97
6.1 Introduction………..97
6.2 Experimental………99
6.2.1 Detection Configuration………...99
6.2.2 Animal Experiments………..100
6.2.3 Blood Sample Preparation……….……100
6.2.4 Cytometry Comparison Experiments……….……101
6.3 Results………101
6.3.2 Radiation Dosimetry………..…………102
6.3.3 Serial Murine Dosimetry Measurements………...………104
6.3.4 Doxorubicin Dosimetry………...…..105
6.4 Conclusions………....107
6.5 Figures………..…..111
6.6 References………..116
7 INVESTIGATION OF OTHER MICRO-FLOW CYTOMETRY APPLICATIONS AND FUTURE DIRECTIONS………118
7.1 Introduction………118
7.2 Experimental………..119
7.2.1 Cell Culture and Staining Protocols………...…119
7.2.2 Animal Protocols………...119
7.2.3 Blood Sample Preparation……….120
7.3 Results………...…….120
7.3.1 Rare Cell Detection………...….120
7.3.2 Intracellular Protein Detection………...………122
7.4 Future Directions……….…..123
7.5 Conclusions………126
7.6 Figures………....129
7.7 References………..131
APPENDIX A LABVIEW SOFTWARE FOR DATA ANALYSIS………...…133
LIST OF FIGURES
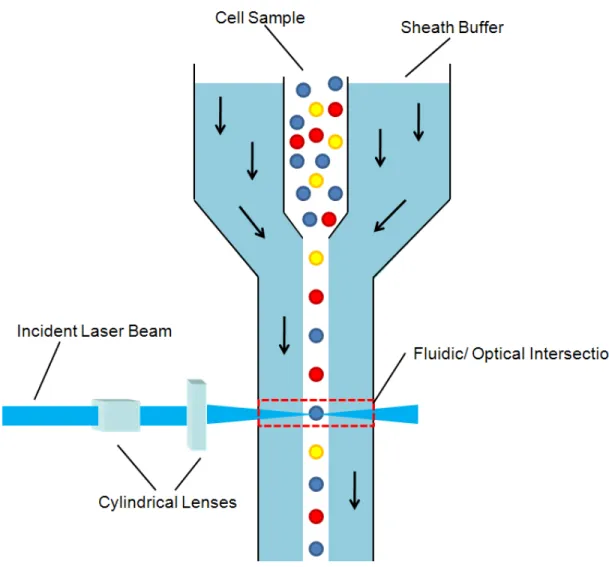
Figure 1.1 Schematic of a typical flow chamber in a conventional flow cytometry system, illustrating the principle of hydrodynamic focusing that ensures proper cell alignment for passage through a fluidic/ optical
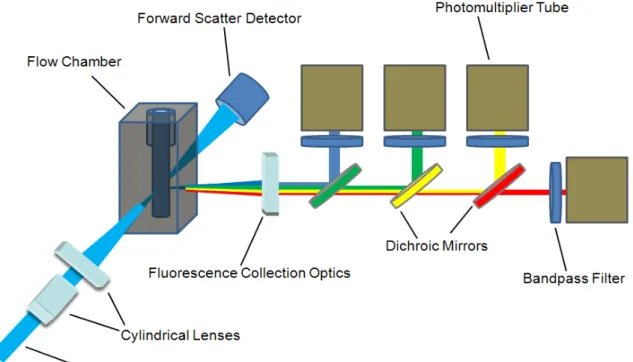
intersection………18 Figure 1.2 Schematic of a common optical configuration for a commercial
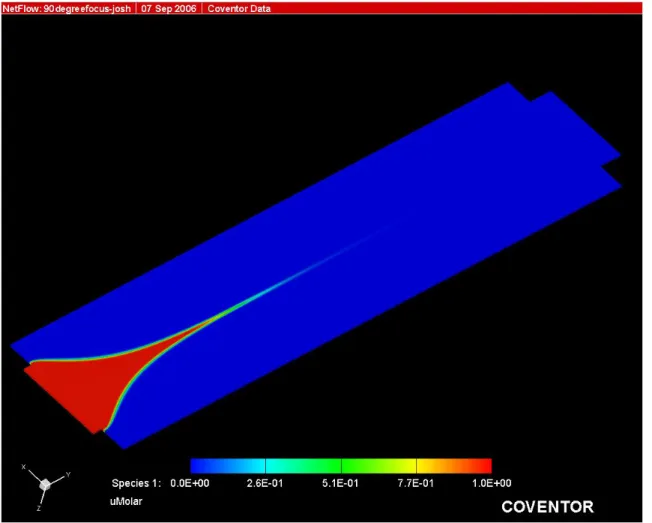
cytometry system……….. 19 Figure 2.1 Result from a computational fluid dynamic simulation
of a prospective microfluidic flow chamber design where the sheath
buffer intersects the cell solution at a 90º angle………41 Figure 2.2 Result from a computational fluid dynamic simulation
of a prospective microfluidic flow chamber design where the sheath
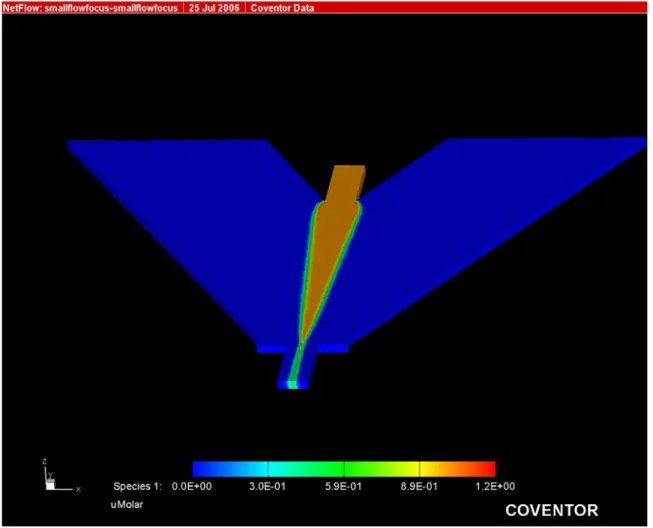
buffer intersects the cell solution at a 35º angle……….42 Figure 2.3 Result from computational fluid dynamic simulation
of a prospective microfluidic flow chamber design where the sheath
buffer intersects the cell solution at a 135º angle………...43 Figure 2.4 (A) Photograph of the glass microfluidic device loaded
with dye for better visualization of the channels. (B) Photograph of the microfluidic device in operational form with glass cylinders secured to the chip over the sheath buffer (SB) and cell solution (SC) reservoirs, and a threaded PEEK nanoport attached over the sample
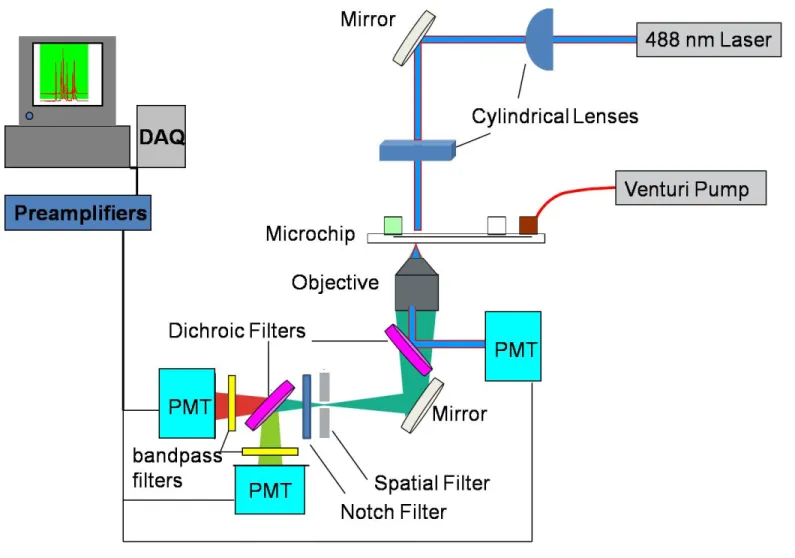
waste (SW) channel for vacuum connection……….44 Figure 2.5 Schematic diagram of the optical detection setup
of the microfluidic cytometry instrument for the detection of two
fluorescence channels and forward-scattered light………....45
Figure 2.6 Photograph of the microfluidic flow cytometry
detection system assembled on an optical table within a dark box………46 Figure 2.7 (A) Close-up photograph of the laser beam focusing
optical lenses. (B) Photograph of the fluorescence detection region of the optical assembly including the filter wheels for
Figure 3.1 Optical images obtained using the Zeiss 510 Meta confocal microscope to characterize the hydrodynamic
focusing properties of the microfluidic flow chamber. Vacuum was applied below the sheath buffer and cell sample intersection. (A) Magnified image (10x) of Rhodamine B hydrodynamically focused with water. (B) Magnified image (60x) of the
hydrodynamically focused Rhodamine B dye solution as
it enters the analysis channel………59 Figure 3.2 Stacked confocal xz-profile using Rhodamine B sheath
solution (red) and FITC dye (green) in the sample stream to investigate the fluid profile below the hydrodynamic
focusing intersection on the microfluidic flow chamber………...60
Figure 3.3 Time-integrated (1-sec) CCD image of an operating microfluidic flow cytometry chip taken to investigate hydrodynamic focusing properties. PBS buffer was introduced in the sheath
buffer reservoir and a solution of Calcein labeled Jurkat cells at
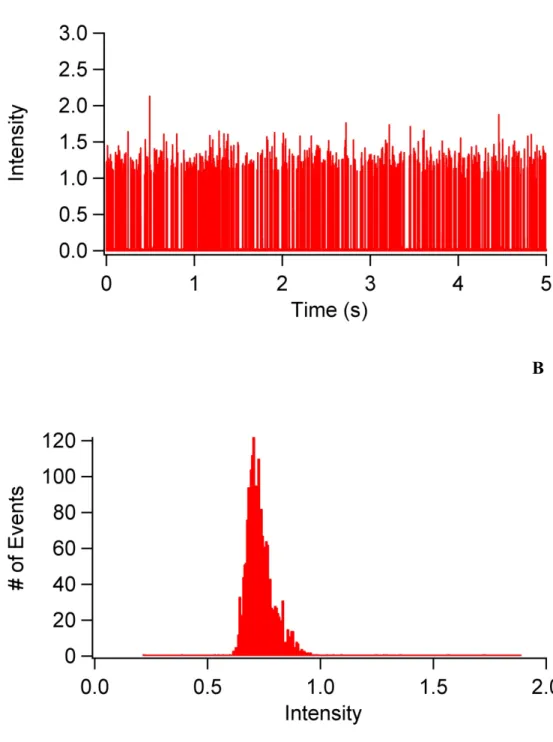
the cell sample input……….61 Figure 3.4 (A) Raw PMT data for the detection of multiple
individually resolved 6-µm AlignFlow Plus fluorescent beads using the red fluorescence channel in the microfluidic cytometry system. (B) Peak intensity distribution obtained for the detection
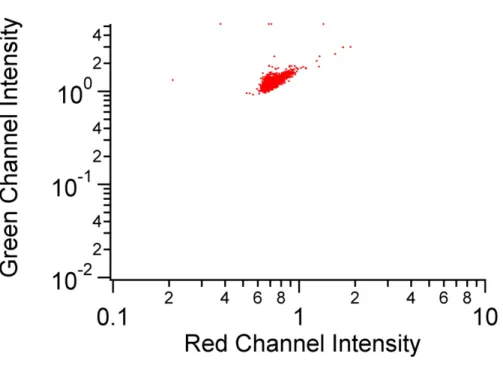
of the same beads using the green fluorescence channel………...62 Figure 3.5 Scatter plot showing the result for dual-channel detection
of 6-µm AlignFlow Plus calibration beads using the microfluidic system………….…...63 Figure 3.6 Result for the detection of Calcein labeled Jurkat cells
using the microfluidic cytometry system and vacuum driven
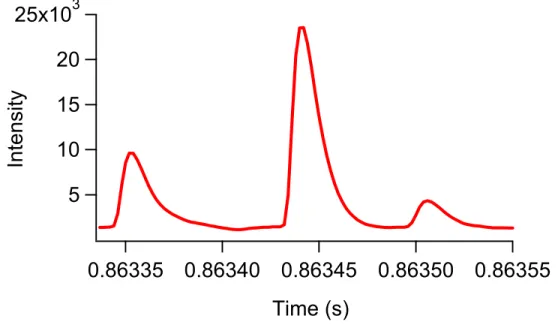
flow to determine throughput. Five cells were detected in less than 2 ms………64
Figure 3.7 Result for the detection of Calcein labeled SUP-T1 cells using positive pressure driven flow on the microfluidic cytometry system.
Three cells were detected in less than 200 µs………65 Figure 3.8 Detection of a mixture of 5.7-µm and 9.8-µm diameter
FITC doped beads using scatter based detection (blue trace) and
Figure 4.1 (A) Result from the analysis of a 1:1 mixture of CD3+ Jurkat cells and CD3+ CD4+ CEM cells where the blue trace shows the
fluorescence signals from FITC-anti-CD4 labeled cells, and the red trace shows the fluorescence signal from PE-AF610-anti-CD3
labeled cells. (B) Expanded region from the data shown in Figure 4.1a………..76 Figure 4.2 Two dimensional scatter plot extracted from the data shown
in Figure 4.1 demonstrating the separation between the two cell types
based on the intensity of the FITC Anti-CD4 fluorescence signal………77 Figure 4.3 (A) Result from the analysis of a 1000:1 mixture of CD3+
Jurkat cells and CD3+ CD4+ CEM cells where the blue trace shows the fluorescence signals from FITC-anti-CD4 labeled cells, and the red trace shows the fluorescence signal from PE-AF610-anti-CD3
labeled cells. (B) Expanded region from the data shown in Figure 4.3a……….……….78 Figure 4.4 Detection of peripheral blood mononuclear cells using
elastic light scatter and LIF for the determination of the CD4:CD8 ratio. The top blue trace is the scatter signal, while the green and red traces show the fluorescence signals from FITC-anti-CD4 and
PE-Texas red-anti-CD8 labeled cells, respectively……….……..79 Figure 5.1 (A) Glass microfluidic chip used for integrated erythrocyte
lysis and flow cytometry. (B) Image of blood and lysis solution intersection. (C) Image of lysis debris removal via side channel (Waste 1) and intact cells continuing downstream. (D) Photograph of functional microfluidic device with a PDMS slab bonded on top of the glass to make tubing connections and fluid reservoirs for blood
and sheath focusing buffer……….…91 Figure 5.2 Representative signal from lysis efficiency experiments
measuring forward scatter detection of diluted whole human
blood (A) after on-chip infusion with non-lysing PBS buffer and (B) after
on-chip infusion with Zapoglobin lysis buffer………...…92 Figure 5.3 Representative signal from experiments employing
CRL-1942 T-lymphocytes detected on-chip for lysis selectivity studies after (A) infusion with PBS (non-lysing) buffer and (B) infusion with
Zapoglobin lysis buffer………..93 Figure 5.4 (A) Subset of raw PMT data showing CD8 fluorescence
signal in black and CD4 fluorescence signal (offset by 1000) in gray. (B) Scatter plot for on-chip detection of CD4+ and CD8+
Figure 6.1 Schematic of the optical detection configuration for dosimetry experiments using the microfluidic cytometry instrument
for the detection of a single fluorescence channel………...111 Figure 6.2 Comparison of Cs-radiation (7.5-Gy, total body irradiation)
induced CD3+ T-cell depletion results obtained using the microfluidic
system and the Cyan cytometry system………...112 Figure 6.3 Monitoring the percent of CD3+ lymphocyte depletion
from the blood of 4 groups of mice receiving different doses
of x-ray total body irradiation (n=4)………113 Figure 6.4 Monitoring the percent of CD3+ lymphocyte depletion
from serial bleeds of 2 groups of mice receiving different doses
of x-ray total body radiation over the course of 12 hours (n=3)………..114 Figure 6.5 Monitoring the percent of CD11b+ cell depletion from the
blood of 4 groups of mice receiving different doses of Doxorubicin (n=4)………115 Figure 7.1 Detection of low concentration solutions of cells in buffer
to simulate the application of the microfluidic cytometry system
for counting rare circulating tumor cells………..129 Figure 7.2 Simultaneous monitoring of T-lymphocyte depletion
and changes in intracellular caspase expression after exposure to TBI………….……..130 Figure A.1 Screen capture of the front panel of the “Josh
Mach VIII” program developed for the analysis of raw data
acquired using the PCI-6251 data acquisition card……….……….136 Figure A.2 Screen capture of the front panel of the “Peak Capture”
program developed for use with the PXI-5122 high-speed data acquisition cards……..137 Figure A.3 Screen capture of the front panel of the “Peak Analysis”
program developed for analyzing subsets of data acquired using the
PXI-5122 high-speed data acquisition cards and the “Peak Capture” program………..138 Figure B.1 Circuit diagram for the peak detector and integrator………...142 Figure B.2 Photograph of the peak detector and integrator circuit………143 Figure B.3 Diagram for the digital circuit used to control timing of the
Figure B.5 Photograph of the front panel of the assembled peak
detector and integrator……….146 Figure B.6 Photograph of the interior of the assembled peak detector
and integrator with all boards mounted and a power supply installed……….147 Figure B.7 Result from the initial testing of the peak detector and
integrator circuits showing the detection of a single event in the top blue trace, and the peak detector and integrator output signals in the
LIST OF ABBREVIATIONS
ADC analog/digital converter AF488 AlexaFluor 488
CCD charge coupled device CD cluster of differentiation CFD computational fluid dynamic cm centimeter
Cs Cesium
CV coefficient of variation DNA deoxyribonucleic acid
EDTA etethylenediaminetetraacetic acid FACS fluorescence activated cell sorting FADU fluorometric analysis of DNA unwinding FISH fluorescence in-situ hybridization
FITC fluorescein isothiocyanate fsc forward scatter
Gy grey
HIV human immunodeficiency virus Hz hertz
m meter mm millimeter MHz megahertz min minute mL milliliter mm millimeter mW milliwatt
MW molecular weight NA numerical aperture nm nanometer
PBM peripheral blood mononuclear PBMC peripheral blood mononuclear cell PBS phosphate buffered saline
PDMS polydimethylsiloxane PE phycoerythrin
PEEK poly ether ether ketone PEG polyethylene glycol PMT photomultiplier tube psi pounds per square inch QD quantum dot
RNA ribonucleic acid s second
SC sample cell port ssc side scatter SW sample waste port TBI total body irradiation
TDT terminal deoxynucleotidyl transferase µm micrometers
η g p Q QC QS w F L
LIST OF SYMBOLS
channel radius d channel depth
gradient
E electric field vector focal length
viscosity
acceleration due to gravity L channel length
wavelength quality factor
pressure
volumetric flow rate cell solution flow rate sheath buffer flow rate ρ fluid density
v velocity
channel width focused beam radius
CHAPTER 1:
FOUNDATIONS FOR FLOW CYTOMETRY BASED ON MICROFLUIDIC TECHNOLOGY
1.1 Introduction
Efforts to develop and commercialize miniaturized instrumentation for medical diagnostics have steadily increased over the past decade. The aim is to produce devices that have similar performance features (sensitivity, accuracy, and reproducibility) as their full-scale laboratory counterparts but, in addition to providing rapid results, are more economical and robust. The efforts are driven in part by trends toward personalized medicine where timely results are desired at the point of care for disease state or therapeutic regime monitoring. Small, relatively inexpensive devices that may be used outside standard laboratory settings also have the potential to increase diagnostic and screening capabilities in rural and underdeveloped areas, greatly enhancing healthcare in those regions. Furthermore, if rapid, inexpensive assays were available as alternatives to expensive screening methods they would be more widely employed, leading perhaps to more favorable medical outcomes.
incorporated into standard practice throughout the world. Point-of-care devices for simple blood chemistry testing and immunoassays have also been commercialized.1,2 Similar devices for diagnosis and monitoring of more complex diseases such as autoimmune disorders and specific cancers are needed. Assays for these diseases typically require the measurement of multiple parameters to obtain useful clinical information3 and consequently are more challenging to develop as point-of-care tests. Trained pathologists commonly perform these complex assays, but there are a few examples of simple, inexpensive, multi-parameter assays for the diagnosis and monitoring of disease states that can be performed easily by nonprofessionals. Continued focus on the development of these assays will escalate the drive towards personalized medicine and greatly improve accessibility to these types of medical tests in resource-limited regions.
techniques. Depending on the detector chosen for the assay, analog to digital signal conversion may be necessary, as well as appropriate software to process acquired data.
Following the design and fabrication of the device, initial testing and characterization are necessary. Biological samples derived from animal models or willing donors must be tested repeatedly and results compared to conventional screening assays. The device should function as well as current technology but preferably with superior performance (higher sensitivity, lower cost per assay, greater speed, increased portability). Finally, if the device will be commercialized as a medical diagnostic tool, it must pass through a stringent regulatory approval process to ensure accuracy and safety.4,5
from the microfluidic system were compared to those obtained on conventional instrumentation in order to assess the accuracy of the assays performed.
The remainder of this chapter will provide a background review of the fundamental concepts in microfluidics and flow cytometry, as well as a review of cell based microfluidic applications to date. In addition, this chapter will attempt to substantiate the need for an automated, portable microfluidic cytometry system for blood cell analysis. The following chapter will discuss the design and fabrication of the microfluidic device, and the construction of the optical detection setup. Chapter 3 will describe initial characterization experiments performed using the microfluidic device to assess the critical design properties and ultimate limitations of the device. Chapter 4 will discuss the results from immunophenotypic analysis of cells from cell mixtures. Finally, chapters 5-7 will cover the investigation of multiple biological applications using the microfluidic flow cytometer.
1.2 Microfluidics Background
technology. The result of these efforts is the vast microelectronics industry in existence today.
Some of the techniques commonly employed for silicon-based circuit fabrication in the microelectronics industry have been adapted to develop advanced microfabricated chemical and biochemical sensors. The intrinsic reproducibility of these techniques makes them ideal for the fabrication of microfluidic devices intended for commercialization. Additionally, the spatial resolution afforded by these processes, which were perfected for producing small electronic chips, allows for the accurate fabrication of very small sensors. The first example of a microfabricated chemical measurement device was a hybridized gas chromatograph where the separation column and thermal detector were machined on Si wafers.16 Further developments by Manz et al. and others were critical in advancing chemical separation-based microsystems by demonstrating the increased separation performance achievable by decreasing separation column dimensions.17-21 The field has since grown significantly to include a variety of separation techniques, chemical synthesis procedures, biological assays, and cell based assays.22-27 Additionally, microfluidic pumps, valves, detectors, and sensors have been developed for these systems.23,24,28-33
sensors have all been developed and commercialized in some cases.23,24 Parallel processing has also been demonstrated to increase analysis throughput.41
Microfluidic devices have been fabricated from quartz,42 glass,43-48 and many polymeric materials.33,49-54 More complex multilayer devices have been produced using primarily soft lithography.30,31,33 A combination of photolithography, wet chemical etching and bonding techniques are typically used to fabricate devices from glass.19 Starting with a patterned photomask, photolithography is commonly employed to pattern specific designs on substrates for microfluidic devices. This procedure typically utilizes a thin layer of photoresist material spun on to the substrate surface that changes its chemical properties when exposed to radiation—typically ultraviolet light—to leave a pattern on the substrate after chemically developing and washing away exposed photoresist. For devices fabricated from glass or quartz, a buffered solution of hydrofluoric acid is typically used to chemically etch the photolithographically patterned substrates to make channels. Chemical etching of glass or quartz is an isotropic process, removing material uniformly in all directions, thereby limiting the maximum achievable aspect ratio (depth/width). Channels in etched substrates can be enclosed by thermally bonding a flat piece of glass or quartz on top of the etched material. Via holes are typically drilled through the substrate or coverplate to permit access to channels where necessary. These holes are typically drilled using ultrasonic milling or powder blasting techniques.55
cost of instrumentation.45,56-59 Additionally, the ability to inexpensively fabricate these devices makes them disposable, which is especially important when considering analyzing potentially infectious clinical samples on-chip.57
1.3 Microfluidics Theory
To describe a fluid traveling through a microfluidic channel, one can assume that there is a conservation of mass. In addition, when describing an incompressible fluid— meaning that the fluid density (ρ) is constant—there is also conservation of volume. Therefore, the continuity equation can be written as follows to describe the situation where fluid flow velocities (v) are much smaller than the velocity of pressure waves in the fluid.60
· v 0 1.1
v v · v p η v ρg ρ E 1.2
p v
Additionally, the Navier-Stokes equation can be written as follows to describe the motion of an incompressible fluid.
dominates fluid flow in a circular cross-section channel can be solved to determine the velocity vector field across the tube area. The velocity distribution relationship is as follows.
∆
4ηL 1.3
Q 8ηL
The velocity distribution can then be integrated across the tube area to give the equation describing the volumetric flow rate Q.
∆ 1.4
Where is the channel radius, ηis the solution viscosity, L is the channel length, and ∆ is the magnitude of the pressure drop. This is just a single example of a reduced form of the Navier-Stokes relationship. When performing computational fluid dynamics (CFD) simulations for prospective microfluidic device designs, it is the Navier-Stokes relationship that is solved for with specific conditions defined based on the materials, fluids, and forces involved.
1.4 Flow Cytometry Background
development of flow cytometry, cell samples were characterized manually using microscopy techniques. This practice is still common today for specific applications where the trained eye of a pathologist is needed for accurate assessment. However, the high-throughput and multiplexing capabilities of conventional flow cytometry make it the widespread choice for complex cell sample characterization. The development of the Coulter Counter also set the foundation for modern cytometry.
Wallace Coulter developed an instrument in 1956 that passed a flowing cell suspension through a small aperture while simultaneously measuring ionic conductance.61 This principle worked on the basis that the electrical conductivity of cells is lower than that of a buffer solution, resulting in increased impedance across the aperture when containing a cell. This instrument allowed for counting and sizing of mixed cell samples, including complex mixtures of cells such as whole blood. This is done by correlating cell size with measured changes in impedance. This development in conjunction with the need for more advanced, higher-throughput microscopy techniques led to the development of modern flow cytometry.
the Fluorescence Activated Cell Sorter (FACS) by Herzenberg at Stanford can be credited with the basic framework for modern flow cytometry and cell sorting technology.66,67 These instruments established the capability for cellular differentiation and separation based on cells stained with fluorescent antibodies. Another major development leading to the advanced utility of flow cytometry was the discovery of methods to produce monoclonal antibodies and other molecular recognition elements for extracellular, intracellular, and nuclear molecular targeting.68 The availability of monoclonal antibodies developed for specific cell surface proteins allowed for the facile discrimination of distinct cell subsets, greatly increasing the significance of immunofluorescence based cellular characterization by flow cytometry.
Since the 1970’s, many advancements have been made to help develop state-of-the-art flow cytometry instrumentation.69 Fluidic, optical, hardware, and software improvements have all assisted the evolution of modern flow cytometry. These improvements have allowed for higher precision measurements at faster analysis rates. Also, significantly more physiochemical information can be obtained on a per-cell basis using modern instrumentation due to the incorporation of multiple lasers, and the continued development of fluorescent dyes and tandem-dye conjugates providing fluorescent markers that span nearly the entire range of the visible spectrum. Current state-of-the-art instrumentation makes use of 2 or 3 lasers, allowing for the simultaneous detection of 12-18 different cellular parameters at throughputs surpassing 90,000 cells per second.69
cell size and granularity can be obtained using forward and side elastic light scatter based detection, which is incorporated in most modern cytometry instrumentation. These properties allow for the separation of cell subsets from complex mixtures without fluorescent tags. Many extrinsic properties can also be measured with the addition of targeted labeling reagents such as monoclonal antibodies conjugated to fluorescent dyes. Structural information such as DNA and RNA content and base ratios can be measured using specific nucleic acid stains. Additionally, immunofluorescence measurements can be used to determine the presence and abundance of both surface and intracellular receptors. Some other functional measurements commonly determined are cytoplasmic calcium levels, DNA degradation/ apoptosis, and enzyme activity.69
1.5 Flow Cytometry Instrumentation
cell stream is narrowed, and consequently the cell alignment, can be adjusted for specific applications by varying the ratio of pressures applied to the cell sample and sheath solutions. Flow velocities for cell sample solutions can exceed 10 meters per second with applied pressures ranging from 10 – 100 psi.
The purpose of hydrodynamically narrowing the cell stream is to ensure that all cells pass through a small optical detection volume in a single file. The detection volume is ideally similar to the volume of the cell so as to limit background signal from the buffer solution and maximizing optical signals from the cell. As cells flow through this region, they pass through one or more focused laser spots. These lasers are used to induce both light scattering and fluorescence from the cells. A schematic of a simple flow cytometry optical configuration is shown in Figure 1.2. An incident laser beam is passed through 2 cylindrical lenses in order to shape the beam into an elliptical profile. This elliptically focused beam is aligned so that the long axis is orthogonal to the cell stream flow, providing more uniform illumination of cells, independent of small deviations in the cell stream position as compared to a circular beam profile.70 The focused laser beam is directed through the hydrodynamically focused cells in the flow chamber.
photodiode detector. A beam stop may be placed in line with the incident beam in front of the photodiode so that the scattered light can be detected without saturating the detector. Fluorescence and 90º scattered light (known as side scatter – SSC) detectors are placed orthogonal to the incident beam and forward scatter detector. Side scatter signatures are used to reveal differences in cell surface roughness and granularity. As shown in 1.2, the fluorescence and side scatter signals are passed through a series of dichroic mirrors that direct the different signals to individual photomultiplier tubes (PMT’s). This enables the spectral separation of multiple fluorescence signals from each cell. The first PMT can be used to detect the side scatter signal, while the remaining detectors are for the detection of fluorescence from different dye molecules conjugated to specific types of antibodies. In front of each detector is a band pass filter to reduce the detection of light other than from the specific dye fluorescence corresponding to that channel.
1.6 Microfluidics for Cellular Applications
The inherent advantages of microfluidic devices have led to numerous applications incorporating cells. Channel features on the micron scale allow for facile manipulation and interrogation of cells. Examples of microfluidic cellular applications range from miniaturized examples of bulk processes, to complex, integrated analyses of cells not possible using conventional instrumentation.71,72 While numerous cellular applications have been demonstrated on microfluidic devices, this introduction will focus on previous demonstrations and advancements of microfluidic flow cytometry.
Previous reports on microfluidic flow cytometry devices has predominately focused on strategies for fluid manipulation, cell focusing, integrating optical components, or demonstration of applications.58,73 Fluid manipulation on microfluidic devices for flow cytometry applications has been most commonly demonstrated using off-chip pumping methods.44,48,52,74-81 However, there are some examples where pumping and valves have been integrated on-chip.48,54,82 For example, electrokinetic pumping has been employed for fluid manipulation and hydrodynamic focusing of cells on chip.45,83,84 Additionally, dielectrophoresis has been used for fluid manipulation for on-chip cytometry applications.85
Numerous examples of hydrodynamic focusing in a single dimension (i.e. in only one plane) on-chip have been demonstrated.45,47,49,53,58,74,77,84,91-94 This focusing strategy is commonly employed due to a simple microchip design and ease of fabrication. One example is based on a simple cross-channel intersection first described by Jacobson et. al.83 While one-dimensional focusing is most common, issues with this strategy still exist including shear effects in the dimension not being focused, and variations in the location of cells as they pass by the detection region. Two-dimensional hydrodynamic focusing strategies have also been developed for flow cytometry applications on-chip.51,52,95-99 Although this focusing approach most closely resembles the focused sample stream profile obtained in conventional capillary based cytometry systems, fabrication of these devices can be complex and multiple layers of patterned material must be properly aligned and bonded in order to successfully obtain the desired hydrodynamic focusing effect.
materials. These drawbacks could prohibit the ability to inexpensively mass-produce these devices for commercial applications.
Many biological applications have been demonstrated using microfluidic flow cytometry devices in order to demonstrate efficacy, and in some cases, reveal distinct advantages over analysis by conventional flow cytometry. Microfluidic cytometry has been used for cellular phenotyping,103 bacterial analysis,45,75,104 rare cell detection,77 monitoring cellular transfection105 and apoptosis,106 andcell cycle analysis.78 Some of these applications have also incorporated other processing steps such as automated fluorescence staining,105,106 cell culture,74 integrated cell lysis for the analysis of intracellular components,44,107 and cell sorting.74,76,77,82,108-110
1.7 Concluding Remarks
opportunity for automated “sample-in answer-out” analysis not currently possible with conventional instrumentation. Automated sample processing and analysis is critical for applications in resource-limited settings where pathologists or trained technicians are not present.
1.8 Figures
1.9 References
(1) Erickson, K. A.; Wilding, P. Clinical Chemistry 1993, 39, 283-287.
(2) Baskin, L. B.; Morgan, D. L.; Parupia, J. Y. Laboratory Medicine 1996, 27, 193-197.
(3) Salas, V. M.; Edwards, B. S.; Sklar, L. A. Adv Clin Chem 2008, 45, 47-74.
(4) Abdel-aleem, S. Design, execution, and management of medical device clinical trials; John Wiley & Sons: Hoboken, N.J., 2009.
(5) Cheng, M.; World Health Organization. Medical device regulations : global overview and guiding principles; World Health Organization: Geneva, 2003.
(6) Baecher-Allan, C.; Brown, J. A.; Freeman, G. J.; Hafler, D. A. Novartis Found Symp 2003, 252, 67-88; discussion 88-91, 106-114.
(7) Baecher-Allan, C.; Viglietta, V.; Hafler, D. A. Semin Immunol 2004, 16, 89-98.
(8) Roncador, G.; Brown, P. J.; Maestre, L.; Hue, S.; Martinez-Torrecuadrada, J. L.; Ling, K. L.; Pratap, S.; Toms, C.; Fox, B. C.; Cerundolo, V.; Powrie, F.; Banham, A. H. European Journal of Immunology 2005, 35, 1681-1691.
(9) Sakaguchi, S. Annu Rev Immunol 2004, 22, 531-562.
(10) Douek, D. C.; Picker, L. J.; Koup, R. A. Annual Review of Immunology 2003, 21, 265-304.
(11) Stein, D. S.; Korvick, J. A.; Vermund, S. H. Journal of Infectious Diseases 1992, 165, 352-363.
(13) Paredes-Aguilera, R.; Romero-Guzman, L.; Lopez-Santiago, N.; Burbano-Ceron, L.; Camacho-Del Monte, O.; Nieto-Martinez, S. American Journal of Hematology 2001, 68, 69-74.
(14) Swat, W.; Ignatowicz, L.; Kisielow, P. Journal of Immunological Methods 1991, 137, 79-87.
(15) Riordan, M.; Hoddeson, L. Crystal fire : the birth of the information age, 1st ed.; Norton: New York, 1997.
(16) Terry, S. C.; Jerman, J. H.; Angell, J. B. Ieee Transactions on Electron Devices 1979, 26, 1880-1886.
(17) Jacobson, S. C.; Hergenroder, R.; Koutny, L. B.; Ramsey, J. M. Analytical Chemistry 1994, 66, 1114-1118.
(18) Jacobson, S. C.; Hergenroder, R.; Koutny, L. B.; Ramsey, J. M. Analytical Chemistry 1994, 66, 2369-2373.
(19) Jacobson, S. C.; Hergenroder, R.; Koutny, L. B.; Warmack, R. J.; Ramsey, J. M. Analytical Chemistry 1994, 66, 1107-1113.
(20) Manz, A.; Miyahara, Y.; Miura, J.; Watanabe, Y.; Miyagi, H.; Sato, K. Sensors and Actuators B-Chemical 1990, 1, 249-255.
(21) Manz, A.; Harrison, D. J.; Verpoorte, E. M. J.; Fettinger, J. C.; Paulus, A.; Ludi, H.; Widmer, H. M. Journal of Chromatography 1992, 593, 253-258.
(22) Fiorini, G. S.; Jeffries, G. D. M.; Lim, D. S. W.; Kuyper, C. L.; Chiu, D. T. Lab on a Chip 2003, 3, 158-163.
(23) Dittrich, P. S.; Tachikawa, K.; Manz, A. Analytical Chemistry 2006, 78, 3887-3907.
(24) West, J.; Becker, M.; Tombrink, S.; Manz, A. Analytical Chemistry 2008, 80, 4403-4419.
(26) Li, S.; Freidhoff, C. B.; Young, R. M.; Ghodssi, R. Journal of Micromechanics and Microengineering 2003, 13, 732-738.
(27) Mair, D. A.; Rolandi, M.; Snauko, M.; Noroski, R.; Svec, F.; Frechet, J. M. J. Analytical Chemistry 2007, 79, 5097-5102.
(28) Mela, P.; Tas, N. R.; Berenschot, E. J. W.; van Nieuwkasteele, J.; van den Berg, A. Electrophoresis 2004, 25, 3687-3693.
(29) Nam, S. W.; Van Noort, D.; Yang, Y.; Park, S. Lab on a Chip 2007, 7, 638-640.
(30) Unger, M. A.; Chou, H. P.; Thorsen, T.; Scherer, A.; Quake, S. R. Science 2000, 288, 113-116.
(31) Groisman, A.; Enzelberger, M.; Quake, S. R. Science 2003, 300, 955-958.
(32) Thorsen, T.; Maerkl, S. J.; Quake, S. R. Science 2002, 298, 580-584.
(33) Quake, S. R.; Scherer, A. Science 2000, 290, 1536-1540.
(34) Weigl, B. H.; Bardell, R. L.; Cabrera, C. R. Advanced Drug Delivery Reviews 2003, 55, 349-377.
(35) Haeberle, S.; Zengerle, R. Lab on a Chip 2007, 7, 1094-1110.
(36) Tanaka, Y.; Sato, K.; Shimizu, T.; Yamato, M.; Okano, T.; Kitamori, T. Biosensors & Bioelectronics 2007, 23, 449-458.
(37) Ohno, K.; Tachikawa, K.; Manz, A. Electrophoresis 2008, 29, 4443-4453.
(38) Zhang, Y. H.; Ozdemir, P. Analytica Chimica Acta 2009, 638, 115-125.
(40) Manz, A.; Graber, N.; Widmer, H. M. Sensors and Actuators B-Chemical 1990, 1, 244-248.
(41) Mckenna, B. K.; Selim, A. A.; Bringhurst, F. R.; Ehrlich, D. J. Lab on a Chip 2009, 9, 305-310.
(42) Sobek, D., ; Young, A.M.; Gray, M.L.; and Senturia, S.D. Proc. IEEE 1993, 2, 219-224.
(43) Jacobson, S. C.; Ramsey, J. M. Anal Chem 1997, 69, 3212-3217.
(44) McClain, M. A.; Culbertson, C. T.; Jacobson, S. C.; Allbritton, N. L.; Sims, C. E.; Ramsey, J. M. Anal Chem 2003, 75, 5646-5655.
(45) McClain, M. A.; Culbertson, C. T.; Jacobson, S. C.; Ramsey, J. M. Anal Chem 2001, 73, 5334-5338.
(46) Poulsen, C. R.; Culbertson, C. T.; Jacobson, S. C.; Ramsey, J. M. Analytical Chemistry 2005, 77, 667.
(47) Schrum, D. P.; Culbertson, C. T. Analytical Chemistry 1999, 71, 4173.
(48) Wang, Z.; El-Ali, J.; Engelund, M.; Gotsaed, T.; Perch-Nielsen, I. R.; Mogensen, K. B.; Snakenborg, D.; Kutter, J. P.; Wolff, A. Lab Chip 2004, 4, 372-377.
(49) Chung, S.; Park, S. J.; Kim, J. K.; Chung, C.; Han, D. C.; Chang, J. K. Microsystem Technologies-Micro-and Nanosystems-Information Storage and Processing Systems 2003, 9, 525-533.
(50) Hung, C. I.; Ke, B. J.; Huang, G. R.; Hwei, B. H.; Lai, H. F.; Lee, G. B. Journal of Fluids Engineering-Transactions of the Asme 2001, 123, 672-679.
(51) Simonnet, C.; Groisman, A. Applied Physics Letters 2005, 87, -.
(53) Tung, Y. C.; Zhang, M.; Lin, C. T.; Kurabayashi, K.; Skerlos, S. J. Sensors and Actuators B-Chemical 2004, 98, 356-367.
(54) Yang, R.; Feeback, D. L.; Wang, W. J. Sensors and Actuators a-Physical 2005, 118, 259-267.
(55) Madou, M. J. Fundamentals of microfabrication : the science of miniaturization, 2nd ed.; CRC Press: Boca Raton, 2002.
(56) Andersson, H.; van den Berg, A. Sensors and Actuators B-Chemical 2003, 92, 315-325.
(57) Chung, T. D.; Kim, H. C. Electrophoresis 2007, 28, 4511-4520.
(58) Huh, D.; Gu, W.; Kamotani, Y.; Grotberg, J. B.; Takayama, S. Physiological Measurement 2005, 26, R73-R98.
(59) Ramsey, J. M. Nat Biotechnol 1999, 17, 1061-1062.
(60) Bruus, H. Theoretical microfluidics; Oxford University Press: Oxford ; New York, 2008.
(61) Coulter, W. H. Proc.Natl.Electronics Conf. 1956, 12, 1034-1042.
(62) Gucker, F. T., O'Konski, C.T., Pickard, H.B., Pitts, J.N. J Am Chem Soc 1947, 69, 2422-2431.
(63) Kamentsky, L. A., Derman, H., Melamed, M.R Science 1963, 142, 1577-1580.
(64) Kamentsky, M., M.R, Derman, H. Science 1965, 150, 630-631.
(65) Kamentsky, M., M.R. Science 1967, 156, 1364-1365.
(67) Hulett, H. R., Bonner, W. A., Sweet, R. G. and Herzenberg, L. A. Clinical Chemistry 1973, 19, 813-816.
(68) Kohler, G., Milstein, C. Nature 1975, 256, 495-497.
(69) Shapiro, H. M. Practical flow cytometry, 4th ed.; Wiley-Liss: New York, 2003.
(70) Watson, J. V. Cytometry 1981, 2, 14-19.
(71) El-Ali, J.; Sorger, P. K.; Jensen, K. F. Nature 2006, 442, 403-411.
(72) Sims, C. E.; Allbritton, N. L. Lab on a Chip 2007, 7, 423-440.
(73) Ateya, D. A.; Erickson, J. S.; Howell, P. B.; Hilliard, L. R.; Golden, J. P.; Ligler, F. S. Analytical and Bioanalytical Chemistry 2008, 391, 1485-1498.
(74) Wolff, A.; Perch-Nielsen, I. R.; Larsen, U. D.; Friis, P.; Goranovic, G.; Poulsen, C. R.; Kutter, J. P.; Telleman, P. Lab Chip 2003, 3, 22-27.
(75) Inatomi, K. I.; Izuo, S. I.; Lee, S. S. Letters in Applied Microbiology 2006, 43, 296-300.
(76) Kruger, J.; Singh, K.; O'Neill, A.; Jackson, C.; Morrison, A.; O'Brien, P. Journal of Micromechanics and Microengineering 2002, 12, 486-494.
(77) Lancaster, C.; Kokoris, A.; Nabavi, M.; Clemmens, J.; Maloney, P.; Capadanno, J.; Gerdes, J.; Battrell, C. F. Methods 2005, 37, 120-127.
(78) Bernini, R.; De Nuccio, E.; Brescia, F.; Minardo, A.; Zeni, L.; Sarro, P. M.; Palumbo, R.; Scarfi, M. R. Anal Bioanal Chem 2006, 386, 1267-1272.
(79) Stiles, T.; Fallon, R.; Vestad, T.; Oakey, J.; Marr, D. W. M.; Squier, J.; Jimenez, R. Microfluidics and Nanofluidics 2005, 1, 280-283.
(81) Yao, B.; Luo, G. A.; Feng, X.; Wang, W.; Chen, L. X.; Wang, Y. M. Lab Chip 2004, 4, 603-607.
(82) Fu, A. Y.; Chou, H. P.; Spence, C.; Arnold, F. H.; Quake, S. R. Anal Chem 2002, 74, 2451-2457.
(83) Jacobson, S. C.; Ramsey, J. M. Analytical Chemistry 1997, 69, 3212-3217.
(84) Lee, G. B.; Chang, C. C.; Huang, S. B.; Yang, R. J. Journal of Micromechanics and Microengineering 2006, 16, 1024-1032.
(85) Holmes, D.; Morgan, H.; Green, N. G. Biosensors & Bioelectronics 2006, 21, 1621-1630.
(86) Eyal, S.; Quake, S. R. Electrophoresis 2002, 23, 2653-2657.
(87) Fu, A. Y.; Spence, C.; Scherer, A.; Arnold, F. H.; Quake, S. R. Nature Biotechnology 1999, 17, 1109-1111.
(88) Lien, V.; Zhao, K.; Berdichevsky, Y.; Lo, Y. H. Ieee Journal of Selected Topics in Quantum Electronics 2005, 11, 827-834.
(89) Perry, H.; Greiner, C.; Georgakoudi, I.; Cronin-Golomb, M.; Omenetto, F. G. Rev Sci Instrum 2007, 78, 044302.
(90) Stavis, S. M.; Edel, J. B.; Samiee, K. T.; Craighead, H. G. Lab Chip 2005, 5, 337-343.
(91) Blankenstein, G.; Larsen, U. D. Biosensors & Bioelectronics 1998, 13, 427-438.
(92) Fu, L. M.; Yang, R. J.; Lin, C. H.; Pan, Y. J.; Lee, G. B. Analytica Chimica Acta 2004, 507, 163-169.
(93) Lee, G. B.; Lin, C. H.; Chang, G. L. Sensors and Actuators a-Physical 2003, 103, 165-170.
(95) Sundararajan, N.; Pio, M. S.; Lee, L. P.; Berlin, A. A. Journal of Microelectromechanical Systems 2004, 13, 559-567.
(96) Chang, C. C.; Huang, Z. X.; Yang, R. J. Journal of Micromechanics and Microengineering 2007, 17, 1479-1486.
(97) Peter B. Howell Jr, J. P. G., Lisa R. Hilliard, Jeffrey S. Erickson, David R. Mottb and Frances S. Ligler Lab on a Chip 2008, 8, 1097-1103.
(98) Miyake, R.; Ohki, H.; Yamazaki, I.; Takagi, T. Jsme International Journal Series B-Fluids and Thermal Engineering 1997, 40, 106-113.
(99) Mao, X.; Lin, S. C.; Dong, C.; Huang, T. J. Lab Chip 2009, 9, 1583-1589.
(100) Xiang, Q.; Xuan, X. C.; Xu, B.; Li, D. Q. Instrumentation Science & Technology 2005, 33, 597-607.
(101) Balslev, S.; Jorgensen, A. M.; Bilenberg, B.; Mogensen, K. B.; Snakenborg, D.; Geschke, O.; Kutter, J. P.; Kristensen, A. Lab on a Chip 2006, 6, 213-217.
(102) Novak, L.; Neuzil, P.; Pipper, J.; Zhang, Y.; Lee, S. H. Lab on a Chip 2007, 7, 27-29.
(103) Chien, C. M.; Cheng, J. L.; Chang, W. T.; Tien, M. H.; Wu, W. Y.; Chang, Y. H.; Chang, H. Y.; Chen, S. T. J Chromatogr B Analyt Technol Biomed Life Sci 2003, 795, 1-8.
(104) Sakamoto, C.; Yamaguchi, N.; Nasu, M. Appl Environ Microbiol 2005, 71, 1117-1121.
(105) Buhlmann, C.; Preckel, T.; Chan, S.; Luedke, G.; Valer, M. J Biomol Tech 2003, 14, 119-127.
(106) Chan, S. D. H.; Luedke, G.; Valer, M.; Buhlmann, C.; Preckel, T. Cytometry Part A 2003, 55A, 119-125.
(108) Dittrich, P. S.; Schwille, P. Analytical Chemistry 2003, 75, 5767-5774.
(109) Fu, A. Y.; Spence, C.; Scherer, A.; Arnold, F. H.; Quake, S. R. Nat Biotechnol 1999, 17, 1109-1111.
CHAPTER 2:
DESIGN AND CONSTRUCTION OF THE MICROFLUIDIC FLOW
CYTOMETRY SYSTEM
2.1 Introduction
A small, inexpensive flow cytometry system should be designed to simplify
manufacturing processes and operational complexity while maintaining the ability to
accurately characterize complex cellular mixtures. In order to satisfy these requirements,
the microfluidic device described in this dissertation has been designed to simplify
fabrication and reduce pumping requirements. The instrument is designed to utilize
stationary optical, electronic, and pumping components off-chip and accommodate a
disposable microfluidic device that contains the flow chamber. As such, the optical
configuration for this instrument is a modified version of that employed in conventional
flow cytometers.
The design and construction of the microfabricated flow cytometer, the optical
detection system, and the signal processing electronics are described in this chapter. The
microfluidic flow chamber was designed with the aid of computational fluid dynamic
simulations that predict hydrodynamic focusing. Optical components in the detection
counted independent of fluorescent labels. Two discrete fluorescent signals could also be
measured to differentiate cell subsets in complex mixtures via fluorescently labeled cell
recognition elements. Hardware and software for real-time signal processing were also
incorporated, allowing for rapid instrument alignment using calibration beads and
significantly reducing the amount of time necessary to analyze large experimental data
sets.
2.2 Theory
2.2.1 Hydrodynamic Focusing
The relative hydraulic resistances of cell sample to sheath fluid channels must be
properly designed for a hydrodynamic focusing chamber where fluid flow is driven by a
vacuum source. This is necessary to ensure the proper hydrodynamic focusing required
for the specific application is achieved. The chip described in this dissertation utilizes a
single input reservoir for the sheath buffer solution. This solution is split into two streams
that recombine after they intersect the cell sample solution as shown in Figure 2.4a. The
proper ratio of hydraulic resistances of the channels was calculated using Equations 2.1
and 2.2 to achieve the desired hydrodynamic focusing effect. Equation 2.1 was set equal
to 0.15, which is the desired ratio of cell to sheath channels to obtain cell stream focusing
to a width of 10 µm. Since all channel depths are equal on the device, channel lengths
and widths were tuned to achieve the proper flow rate ratio.
Flow rate ratio QC
QC is the cell solution flow rate and QS is the sheath buffer flow rate. The flow rate Q is
defined in Equation 2.2.
Q ∆Pwd
12ηL 2.2
In this equation, ∆P is the applied pressure drop, w is the channel width, d is the channel
depth, η is the solution viscosity, and L is the channel length. Applying Ohm’s law to
Equation 2.2—substituting the ratio of channel length to area for hydraulic resistance—
and cancelling out constant terms such as channel depth and solution viscosity allows the
flow rate ratio to be expressed in terms of channel lengths (L) and widths (w) as shown in
Equation 2.3.
QB
C
LCwB
LBwC 2.3
For the device described here, the flow rate ratio QB
C in Equation 2.3 was set equal to 3
based on the desired flow rate, and channel lengths and widths determined.
2.2.2 Laser Beam Shaping
The incident laser beam was shaped into an elliptical profile with the long axis
orthogonal to the cell flow direction to increase the reproducibility of the time each cell
spends in the excitation beam. Beam shaping was accomplished using a pair of crossed
The properties of the lens pair required for this setup was calculated using Equation 2.4
based on the desired final focused elliptical beam profile,
F
L 2.4
where F is the desired radius of the focused beam, is the laser wavelength, is the
focal length of the cylindrical lens, is the quality factor of the incident beam (assumed
to be 1.0), and L is the radius of the beam at the laser output. A final focused beam
profile of 15 µm by 100 µm was chosen to ensure that cells experience minimal variation
in excitation time due to small deviations in their location relative to the center of the
beam. Uniformity of measurements is ensured by aligning the long axis of the focused
beam over the entire width of the center cell stream channel. In addition, the focused
beam profile was chosen to reduce the probability of having more than one cell in the
excitation beam simultaneously.
2.3 Microchip Design
The microfluidic device was intended to achieve proper hydrodynamic focusing
of the cell solution using a simple design. Glass chips were used due to their relative
robustness, optical transparency, and compatibility with low-pressure driven flow. One
dimensional focusing is utilized to simplify chip fabrication. In addition, all channels
(i.e. the sheath buffer channels and cell solution channels) were etched to the same depth
in a single etch step to provide the desired channel dimensions. Further, all fluid flow is
two pumps that are commonly employed to supply independent control of the cell sample
and sheath flow rates using positive pressure.
When manipulating fluid using pressures, it is important to understand the fluid
flow profile and consider how it will impact the cells traveling on-chip. The effects from
pressure-induced parabolic flow do not need to be considered in the plane focused by the
sheath buffer since the sidewall drag forces predominantly act on the outer-sheath fluid
stream. In the device described using one-dimensional hydrodynamic focusing, it is
however necessary to consider how the parabolic flow profile effects the cell stream
solution in the vertical dimension not focused by the sheath flow. Different fluid
velocities within this stream caused by the parabolic flow profile can cause the cells to
travel at different speeds, increasing the variance in cell excitation and detection times.
In order to reduce this effect, the channel depth can be minimized. The cells will then
experience the flow profile near the walls where the flow is slower, and in the center of
the channel at the maximum fluid velocity. The result is that the cells will travel at a
velocity equivalent to the average fluid velocities across the parabolic flow profile. An
issue with minimizing the channel depth is that the channels can quickly clog with cells,
cell debris, or particulate contaminants, rendering the microfluidic device inoperable. For
applications described in this dissertation concerning blood cell solutions, channel depths
of 20-25 µm were chosen as a compromise between minimizing the parabolic flow
effects and reducing the possibility for channel clogging.
Calculations to determine the optimal ratio of hydraulic resistances of cell
solution flow to sheath channel flow along with computational fluid dynamic simulations
focusing. Adequate hydrodynamic focusing for the application was defined by the ability
to focus the cell solution to a width close to 10 µm. After calculating the proper ratios of
channel hydraulic resistances using Equations 2.1, 2,2, and 2.3, designs incorporating
different intersecting angles of sheath buffer channels to cell solution channels were
simulated. The results are shown in Figures 2.1-2.3. A 90º angle of intersection as
shown in Figure 2.1 has been described previously in the literature for microchip
cytometry applications.2 Figure 2.2 shows a simulation of a 35º angle of intersection,
which closely resembles the focusing strategy employed in most commercially available
capillary based cytometry systems. Figure 2.3 is the result from a 135º angle intersection
simulation. The hydrodynamic focusing properties demonstrated by these simulations
led to the selection of the channel layout in Figure 2.3 as the optimal design for the
microfluidic cytometry flow chamber. This design has maximum sheath channel widths
of 465 µm and a sample cell channel width of 70 µm.
Figure 2.4a shows an image of the final microfluidic cytometry chip design with
arrows indicating fluid flow direction. The size of the monolithic glass device is 25.4
mm x 50.8 mm x 1.8 mm. The chip uses a vacuum source applied at a single sample
waste port (SW) to control the fluid flow from both the sample cell (SC) and sheath
buffer (SB) channels. Using a single vacuum source is advantageous as it reduces
off-chip complexity compared to applying positive pressure at both SC and SB to drive flow.
Another advantage is that the focused sample cell stream dimensions at the detection
region are relatively independent of the fluid velocity—given the diffusion coefficient of
a lymphocyte—and will therefore not depend significantly on the magnitude of the
fluid flow, defined by the channel architecture. Consequently, the chip can be run at
different analysis rates through control of the single vacuum source without affecting the
focused stream profile. A third advantage is that by splitting the sheath buffer flow into
identical focusing channels (f1, f2), a symmetrically focused stream at the detection
region results since the flow rates in f1 and f2 are identical. Figure 2.4b shows a
photograph of the microfluidic device in operational form with glass reservoirs attached
for introducing sheath and cell solutions and a threaded nanoport attached for applying
vacuum to the device.
2.4 Experimental
2.4.1 Computational Fluid Dynamic Simulations
Microchannel architectures were modeled using Coventorware fluid dynamic
simulations software (Coventor, Cary, NC) to allow in silico optimization of the
hydrodynamic focusing performance. Simulations were performed for prospective flow
chamber designs by modeling the hydrodynamic focusing intersection of a dye solution
having a diffusion coefficient of 2.6 x 10⁻⁶ cm2 s-1—instead of a solution containing
suspended cells—with water when sub-ambient pressure is applied below the
intersection. Simulated fluid flow was achieved through the application of 10-3 torr of
pressure below the intersection of the cell and sheath solutions.
2.4.2 Microchip Fabrication
Glass microfluidic chips were fabricated using standard wet chemical etching
techniques as described previously.3-5 White crown glass substrates (B270) coated with
chromium and positive photoresist (Telic Co., Valencia, CA) were patterned with the
chip design by flood UV exposure using a custom photomask (Photoplot Store, Colorado
Springs, CO). After photoresist development (MF-319; Microchem, Newton, MA) and
removal of exposed chromium (Chromium Etchant; Transene, Danvers, MA), channels
were etched into the glass substrate using a dilute HF/NH4F solution (10:1 Buffered
Oxide Etch; Transene). Etching was allowed to proceed until the desired dimensions
were obtained as determined by profilometry (P-15; KLA-Tencor, San Jose, CA). The
etched substrates were then diced and access holes made by powder blasting (Comco
Inc., Burbank, CA). All glass was then thoroughly cleaned by sonication in a 5%
solution of Contrad (Fisher, Waltham, MA) for ten minutes, followed by immersion in
Nanostrip solution (Cyantek Corp., Fremont, CA) for 30 minutes. Etched glass substrates
and glass cover plates were then hydrolyzed in a 2:2:1 solution of H2O/NH4OH/H2O2 for
30 minutes at 70°C, and thermally bonded at 550°C for ten hours. Buffer and cell
solution reservoirs were made by attaching glass cloning cylinders (Fisher) over via holes
using a two-part epoxy. A poly(etheretherketone) (PEEK) nanoport fitting (Upchurch
Scientific, Oak Harbor, WA) was attached to the microchip waste port in order to apply
sub-ambient pressure for fluid manipulation. A 10/32 threaded PEEK fitting was used to
attach the nanoport to a segment of 0.04’’ ID PEEK tubing for connection to a Venturi
2.4.3 Surface Modification
To reduce cell and cell debris adhesion to the microfluidic channel walls, a thin
coating of polyethylene glycol (PEG) was covalently attached to all the channels. A
modified procedure from that described by Razunguzwa et al.6 was employed for the
PEG coating. First, 1 N NaOH was drawn through the channels for 30 minutes to
hydrolyze the glass surface. The chip was then flushed with Nanopure H2O for 10
minutes, dried by pulling air through the chip, followed by flushing with dry toluene for 5
minutes. The channels were filled with a solution of
N-(triethoxysilylpropyl)-O-polyethylene oxide urethane (MW= 500) (120 mg/mL) (Gelest Inc., Morrisville, PA) in
toluene and left to react at room temperature for 8 hours. The chip was then flushed with
toluene for 5 minutes and dried at 80 °C for 3 hours.
2.4.4 Optical Instrumentation
Laser excitation was obtained using a 488-nm solid-state laser (40 mW) (Cyan;
Newport Corp., Irvine, CA). Fluorescence and scatter signals were collected using a 40x
microscope objective (NA=0.45) (Creative Devices Inc., Neshanic Station, NJ). Optical
filters including dichroic mirrors, band-pass filters, and long-pass filters were purchased
from Semrock (Rochester, NY). The elastic scatter signal was detected using a
photodiode detector (Thorlabs Inc., Newton, NJ). Fluorescence signals were spatially
filtered using a 400-µm slit (Thorlabs Inc., Newton, NJ), and directed to photomultiplier
A schematic of the optical detection configuration is shown in Figure 2.5, and a
photograph of the detection system is shown in Figure 2.6. The 488-nm solid-state laser
(40 mW) was focused to an elliptical spot (15 µm x 100 µm) from above the chip using a
pair of crossed cylindrical lenses.1 A photograph of the crossed cylindrical lens pair is
shown in Figure 2.7a. A 40x microscope objective (NA=0.45) was positioned under the
microchip for the collection of fluorescence and elastic scatter. The elastic scatter signal
is separated from the fluorescence by passing the collected light through a 495-nm cutoff
dichroic mirror. The reflected scatter signal is then directed to a photodiode for
detection. The transmitted fluorescence light is spatially filtered using a 400-µm slit, and
then passed through a 493-nm long pass filter to remove any incident laser light.
Common fluorescent markers used in combination with 488-nm laser excitation
include FITC, AF488, PE, Calcein, and PerCP as well as tandem dye conjugates such as
PE-Texas Red, PE-AF610, PE-Cy5 and PerCP-Cy5.5. This instrument is generally
configured to detect FITC with a tandem dye such as PE-Texas Red. For this specific
application, a 593 nm cutoff dichroic mirror splits the incident fluorescence into two
channels, followed by band-pass filtering before detection with separate PMT’s. FITC
fluorescence signals are passed through a bandpass filter with a maximum transmittance
of 536-nm with a 40-nm bandwidth, while PE-Texas Red fluorescence is passed through
a 624-nm maximum transmittance filter also having a 40-nm bandwidth. Figure 2.7b
shows a photograph of the fluorescence detection region of the instrument, showing a
filter wheel mounted in front of each PMT to easily modify the spectral detection
capabilities of the instrument by changing the band-pass filters based on the specific
2.4.5 Signal Processing
Current outputs from each PMT are amplified through individual low-noise
current preamplifiers (SR570; Stanford Research Systems, Sunnyvale, CA), and digitized
using a 16-bit multifunction I/O card (PCI-6251 National Instruments, Austin, TX). A
14-bit high speed digitizer (National Instruments PXI-5122) has also been incorporated
for experiments where long acquisition times and acquisition rates over 1 MHz are
required. Data acquisition and the extraction of cell signal information from raw data
was performed using custom LabVIEW (National Instruments) programs.
Current signals output from the PMT’s and photodiode detectors were passed
through a current to voltage amplifier, and resulting voltage signals were transferred to a
data acquisition card. Custom LabVIEW software was used to save data output from
each detector, and process raw data signals in order to extract event information. Raw
fluorescence and scatter data from each channel was analyzed in LabVIEW to find
signals above a defined threshold. The optical signals in each channel were then
correlated, and peak intensities and areas are extracted to display as distribution
histograms and scatter plots. Screen captures, photographs, and descriptions of the
hardware and software programs used are displayed in Appendices.
2.5 Conclusions
Efforts to design and construct the microfluidic cytometry device and optical
detection configuration were described in this chapter. To design a flow chamber that is
the proper ratio of cell to sheath channel hydraulic resistances were achieved to obtain the
desired hydrodynamic focusing properties. Computational fluid dynamic simulations
were used in combination with these calculations to determine the optimal focusing angle
at the intersection of sheath buffer and cell solutions in the flow chamber.
The optical detection system assembled was based on a simplified version of
state-of-the-art cytometry optical designs, maintaining the capacity to simultaneously
detect forward scattered light and two fluorescence channels from individual cells.
Further, the system was constructed to facilitate rapid removal of the microfluidic device
for disposable applications. In addition, the instrument was designed to easily vary the
fluorescence detection characteristics of the system through the use of filter wheels and
2.6 Figures
A B
Figure 2.3 Result from computational fluid dynamic simulation of a prospective microfluidic flow chamber design where the sheath
Figure 2.4 (A) Photograph of the glass microfluidic device loaded with dye for better visualization of the channels. (B) Photograph of the microfluidic device in operational form with glass cylinders secured to the chip over the sheath buffer (SB) and cell solution (SC) reservoirs, and a threaded PEEK nanoport attached over the sample waste (SW) channel for vacuum connection.
3