SINGLE-CHANNEL RECORDING OF BIOLOGICAL TARGETS USING SURFACE MODIFIED NANOCHANNELS
APRIL LATOYA RHODELLA HOLLAND
A dissertation submitted to the faculty of the University of North Carolina at Chapel Hill in partial fulfillment of the requirements for the degree of Doctor of Philosophy in the Department of Chemistry.
Chapel Hill 2013
ii ©2013
iii ABSTRACT
APRIL LATOYA RHODELLA HOLLAND: Single-Channel Recording of Biological Targets using Surface Modified Nanochannels
(Under the direction of J. Michael Ramsey)
The present work describes surface modification techniques used to enhance nanofluidic sensing of biological targets. Nanofluidic sensors enable rapid, label-free sensing of biological targets often with single molecule sensitivity. The high surface-to-volume ratio of these devices encourages surface interactions, often enabling control of the signal transduction. Nanofluidic devices have been fabricated within silicon-based substrates which enable batch processing, compatibility with biological targets, and flexibility in surface modification. Solid-state platform also afford control of the critical dimensions of the nanometric devices.
iv
used to confirm the localized deposition of hydrophobic surface coatings within nanoconfined environments.
v
vi
ACKNOWLEDGEMENTS
I would like to thank my advisor, J. Michael Ramsey, for the opportunity to work, learn, and grow in his research group. I thank all the members of the Ramsey group for their help, thoughtful discussions, and assistance learning and setting up equipment over the years. In particular, I would like to thank Laurent Menard who has painstakingly read this complete work – Your meticulous editing, helpful suggestions, and generosity with your time has made me a better scientist, teacher, and writer.
vii
TABLE OF CONTENTS
LIST OF TABLES ... xi
LIST OF FIGURES ... xii
LIST OF ABBREVIATIONS AND SYMBOLS ... xvi
Chapter I. SINGLE CHANNEL RECORDING IN SOLID-STATE NANOPORES AND NANOCHANNELS ... 1
1.1 Single Channel Recording ... 1
1.2 The Electric Double Layer ... 5
1.3 Nanoconfined Environments ... 6
1.4 Channel Conductance ... 7
Ohmic Behavior ... 7
Rectifying Behavior ... 7
Analyte Induced Perturbations ... 9
1.5 Scope of Dissertation... 11
DNA Manipulation ... 11
Target Analyte Capture ... 12
1.6 Figures ... 14
1.7 References ... 20
viii
2.1 Introduction ... 29
Genomic Sequencing ... 29
Biological Nanopores ... 32
Solid-State Nanopore Sensing ... 37
2.2 Methods ... 44
Reagents ... 44
Surface Modification and Characterization ... 45
Nanopore Fabrication ... 45
Electron Energy Loss Spectroscopy (EELS)... 46
Nanopore Device Assembly ... 47
DNA Translocation ... 48
2.3 Results ... 48
Membrane Fabrication ... 48
Ellipsometry ... 49
Surface Modification ... 50
Electron Energy Loss Spectroscopy ... 51
Ionic Conductance ... 52
DNA Translocations ... 53
Discussion of Hydrophobic Nanopores ... 58
2.4 Conclusion ... 59
2.5 Figures and Tables... 61
2.6 References ... 78
ix
3.1 Introduction ... 87
Antigen-Antibody Complexes ... 88
Immunometric Analysis ... 89
Nanopore Biosensor ... 91
3.2 Methods ... 92
Reagents ... 92
Nanopore Fabrication and Assembly ... 93
Nanopore Modification ... 94
Target Analyte Capture and Release ... 95
Driven Protein Translocations through Unfunctionalized Nanopores ... 95
3.3 Results and Discussion ... 96
Fabrication in LPCVD Silicon Nitride ... 96
3-Aminopropyltrimethoxysilane – Biotin Modification ... 97
Specific Capture and Release ... 98
Alternative Methods ... 99
Discussion: Real-time Monitoring ... 101
3.4 Conclusion ... 106
3.5 Figures and Tables... 108
3.6 References ... 124
IV. REAL-TIME PROTEIN CAPTURE AND DETECTION USING SURFACE FUNCTIONALIZED NANOSLITS ... 131
x
Specific Analyte Detection ... 131
Streptavidin – Biotin Complex ... 133
Conductometric Nanoslit Sensing: A Method for Label-Free Detection ... 134
4.2 Method... 136
Reagents ... 136
Nanoslit Device Fabrication ... 136
Surface Functionalization ... 137
Nanoslit Capture and Detection of Analyte ... 138
4.3 Results ... 139
Nanoslit Sensor Fabrication ... 139
Target Analyte Detection ... 140
Conductance Detection of Target Analyte ... 141
Real-time Detection ... 142
Capture Kinetics ... 146
4.4 Conclusion ... 151
4.5 Figures and Tables... 153
4.6 References ... 179
V. APPENDIX A: MATLAB PROGRAMMING – TRANSLOCATION FINDER ... 171
xi
LIST OF TABLES
Table
2.1: Water contact angle and ellipsometry measurements for
native and surface modified silicon nitride substrates ... 72 3.1: Etch rate of low-stress, non-stoichiometric silicon nitride
used to fabricate nanopores ... 110 4.1: Analyte parameters. *Assumes maximum capture
density within a neutral pH buffer. ... 153 4.2: Nanoslit sensing parameters, conditions, and critical
xii
LIST OF FIGURES
Figure
1.1: Patch clamp recording configurations ... 14
1.2: A.) Isolated ion channels can be implanted within suspended lipid bilayer films ... 15
1.3: A.) Solid-state nanopores can be milled through insulating films such as silicon oxide or nitride ... 16
1.4: Surface charge effects on ions in nanoconfined environments ... 17
1.5: Ideal symmetrical nanopore circuit ... 18
1.6: Modes of single channel recording for analyte detection ... 19
2.1: The basic components of double stranded DNA ... 61
2.2: Illustration of the Sanger sequencing response ... 62
2.3: Artificial lipid bilayer membrane ... 63
2.4: Biological ion channels can be reconstituted within artificial lipid bilayers and used for detecting single molecules of DNA ... 64
2.5: TEM tomography images of a focused electron beam milled nanopore ... 65
2.6: Solid-state nanopore device capable of single molecule DNA sensing ... 66
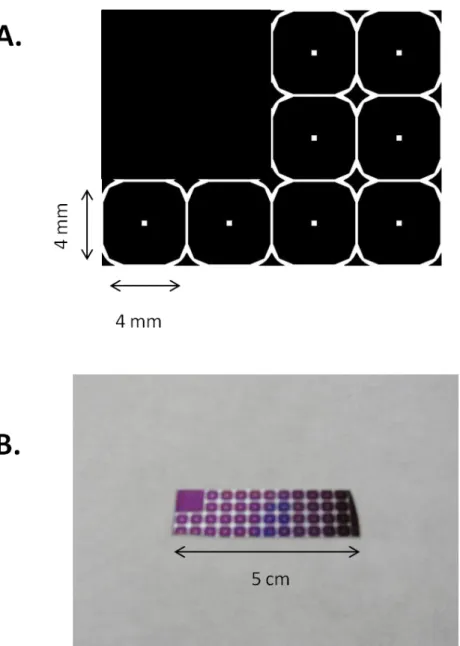
2.7: A.) Using this design 4 mm x 4 mm nanochips were photolithographically patterned onto the silicon/silicon nitride substrate ... 67
2.8: Silicon nitride membrane fabrication protocol ... 68
2.9: A.) A 10 nm pore was modified using trichloroperfluorsilane ... 69
2.10: Schematic of solid-state nanopore experiment ... 70
xiii
2.12: A.) A nanopore was milled in a 30-nm thick silicon
nitride membrane with a diameter of 2.5 nm ... 73 2.13: A silicon nitride nanopore (diameter 10 nm, length = 30
nm) was capable of detecting single molecules of -DNA with blockade events that were commensurate with the expected I response described by Equation
2.6. ... 74 2.14: Translocation data analysis of events measured using a
10 nm diameter pore ... 75 2.15: Overlay of current traces acquired from a octyl silane
functionalized nanopore ... 76 2.16: Using a equimolar DNA ladder solution (1-10 kbp),
DNA was introduced to a native a SiNx nanopore ... 77 3.1: ELISA immunoassay approaches ... 108 3.2: Nanopore holder designed by associates at Nabsys Inc ... 109 3.3: Silicon nitride membranes were batch processed using
selective etch methods explained in Chapter 2 ... 111 3.4: The two-step modification was monitored using the ionic
conductance (native dimensions 8 nm x 30 nm) ... 112 3.5: A.) Streptavidin introduced to the 3APS – Biotin
modified nanopore (native dimensions 10 nm x 30 nm)
induced total occlusion of the ionic conductance (green) ... 113 3.6: Ovalbumin introduced to the nanopore induced little
change to the ionic conductance (purple) ... 114 3.7: The ionic conductance through a 3APS modified
nanopore (native dimensions 10 nm x 30 nm) was
unstable in aqueous conditions over time ... 115 3.8: A.) Nanopores aminated using
N-(6-aminohexyl)aminomethyl-triethoxysilane (N6AS) was monitored using ionic conductance (native dimensions 25 nm x 56 nm) before and after exposure to water
heated to 40C ... 116 3.9: Captavidin was captured with the N6AS – biotin
xiv
3.10: At pH 5.5 captavidin was specifically captured by the N6AS – biotinylated nanopore, inducing a significant suppression of the ionic conductance (blue). Ovalbumin was not captured within the biotinylated nanopore and
had no significant effect on the ionic conductance (red). ... 118 3.11: A.) Single molecules of streptavidin were observed
within native silicon nitride nanopores (10 x 30 nm, 1 M
KCl, 50 mM Tris, pH 8) ... 119 3.12: A-F.) The measurement of short duration signals was
limited by the finite rise time of the filter, often
distorting the reported magnitude and duration. Pedone et al. have suggested methods to improve the
measurement of these short term events and reconcile the reported values with the nominal value of the progenitor pulse signal. This image has been reprinted from Reference 80, © 2009 American Chemical
Society. ... 120 3.13 Translocation events acquired at 30 kV/cm were plotted
using a custom MATLAB program which analyzed the events using conventional maximum amplitude (I) and t (s) methods (A-C) and the methods suggested by
Pedone et al. (D-F).80 ... 121 3.14: Translocation of streptavidin molecules passing
through a 10 nm x 30 nm pore in 1 M KCl, 50 mM Tris, pH 8 buffer were monitored over a range of electric
fields ... 122 3.15: A.) A silicon nitride membrane has been chemically
modified such that only one NTA receptor site is found
within the nanopore lumen... 123 4.1: Schematic of the sensing protocol. A.) The biotinylated
nanoslit ionic conductance is measured ... 154 4.2: A.) Illustration of EDL overlap within a 45-nm quartz
nanoslit ... 155 4.3: Fabrication schematic describing the two-step wet etch
process ... 156 4.4: A.) The nanoslits were patterned in a 1”x1” chip design
xv
4.6: Images acquired at 100x magnification of nanoslit with
dimensions (h = 45 nm, w = 6.7 m, l = 110 m) ... 160 4.7: Streptavidin capture within a biotinylated nanoslit ... 161 4.8: Regeneration of the biotin probe surface enabled repeat
capture of the streptavidin target and was detectable
using ion conductance ... 162 4.9: Real-time observation of streptavidin capture using a
BPS coated nanoslit in 0.01 PBS ... 163 4.10: Real-time response to streptavidin captured (red) from
a 284 nM solution, GStrept = 158 ± 1 pS ... 164 4.11: A.) Real-time observation of streptavidin capture using
either 70C or 85C thermal regeneration of the BPS
active cites (channel length = 46 m) ... 165 4.12: Steady-state conductance was measured after 10
minutes of streptavidin exposure and 20 minutes of buffer rinse to remove any unbound protein within a device that has been exposed to the 70C treatment prior
to any capture ... 166 4.13: A.) Real-time capture response has been plotted as a
function of streptavidin concentration. The inset shows
the data plotted on a log-log scale ... 167 4.14: A non-biotin binding protein, ovalbumin (blue),
produced negligible signal variation within the
biotinylated nanoslit ... 168 4.15: Real-time observation of streptavidin capture over a
range of electrokinetic velocities (channel length = 19
m) ... 169
4.16: A.) Real-time capture observation as function of streptavidin concentration introduced to the BPS nanoslit over a range of electrokinetic velocities
xvi
LIST OF ABBREVIATIONS AND SYMBOLS
Meaning
Section Reference
3APS 3-Aminopropyltriethoxysilane 2.1, 3.2
3APS - Biotin 3-Aminopropyltriethoxysilane - NHS Biotin 3.3
Nanopore angle 2.1
A Adenine 1.4, 2.1.1
A Cross-sectional area 2.1.3, 2.5, 3.3
Ab Antibody 3.1
ADF Annular dark field 2.5
AFM Atomic force microscopy 4.2
Ag Antigen 3.1
Ag/AgCl Silver/silver chloride 3.2, 4.2
AgAb Antigen – antibody complex 3.1
An Nanochannel cross-sectional area 1.4
Angle of incident light 2.2
BOE Buffer oxide etch 2.2, 4.2
bp Base pairs 2.3
BPS Biotin – PEG – Silane 4.2
C Cytosine 2.1
C Coulomb, unit of electric charge 4.3
Cl- Chlorine ion 2.1, 3.3, 4.5
xvii
Phase Shift 2.3
D Diffusion coefficient 2.1, 4.5
ddATP 2’,3’-dideoxyadenine triphosphates 2.1
ddCTP 2’,3’-dideoxycytosine triphosphates 2.1
ddGTP 2’,3’-dideoxyguanine triphosphates 2.1
ddTTP 2’,3’-dideoxythymine triphosphates 2.1
G/G, G Normalized change in conductance 4.3
I Event height 2.1
DNA Deoxyribonucleic acid 2.1
dn Nanochannel diameter 3.3
ds-DNA Double-stranded DNA 1.4, 2.1, 3.3
t Event duration 3.3
E Electric-field strength 3.3
e Elementary charge (1.602 x 10⁻¹⁹ Coulombs) 4.1
EDL Electrical double layer 1.1, 3.1, 4.1
EDTA Ethylenediaminetetraacetic acid 2.2
EELS Electron energy loss spectroscopy 2.2
ELISA Enzyme-linked immunosorbent assay 3.1
eV Electron volt, unit of energy (1.602 x 10⁻¹⁹ Joules) 2.2, 3.2
FEB Focused electron beam 2.1, 3.2
Ionic Strength 1.2
G Guanine 2.1
xviii
Gn Conductance through nanochannel 3.3, 4.1
GS Conductance contributed by surface 2.1, 4.1
GV Conductance dictated by volume constriction 2.1, 4.1
H+ Hydrogen ion 1.2, 3.3
H3PO4 Phosphoric acid 2.2, 3.3
hn Nanoslit height 4.1
Hz Hertz 2.2, 3.3
I Current 2.3, 3.2
k rate constant 3.1
K+ Potassium ion 2.1, 3.3
-1
Debye Length 4.1
Ka Association equilibrium constant 3.1
KCl Potassium chloride 1.4, 2.2, 3.2
Kd Dissociation equilibrium constant 4.1
koff Dissociation reaction rate constant 3.1, 4.3
KOH Potassium hydroxide 2.2, 3.3
kon Association reaction rate constant 3.1, 4.3
ld Length of DNA molecule 2.1
-DNA Lambda-phage DNA 1.4, 2.1
em Wavelength of emission 2.5, 4.2
ln Nanochannel length 1.4, 4.1
LPCVD Low pressure chemical vapor deposition 3.2
xix
M Molar, unit of concentration 2.2, 3.2, 4.2
m Meter, unit of length 2.1, 4.3
eo Electrosmotic mobility 3.3
ep Electrophoretic mobility 3.3
min Minute, unit of time 2.3
opp Counterion mobility 1.4, 4.1
N Newton, unit of force 3.3
N6AS N-(6-aminohexyl)aminomethyltriethoxysilane 3.2
N6AS - Biotin
N-(6-aminohexyl)aminomethyltriethoxysilane - NHS
Biotin 3.3
NA Avogadro’s number 2.1, 4.1
NaCl Sodium chloride 4.2
NHGRI National Human Genome Research Institute 2.1
Nitrilotriacetic acid 3.5
pA, nA Pico-, nanoampere, Unit of current 2.2, 3.3, 4.2
PBS Phosphate buffered saline 4.2
PDMS Poly(dimethylsiloxane) 2.2
PECVD Plasma enhanced chemical vapor deposition 2.2, 3.2
PEEK Polyetheretherketone 3.2
PEG Polyethylene glycol 2.3, 4.2
PET Poly(ethylene terephthalate) 1.4
pI Isoelectric point 3.1, 4.3
xx
Q Rectification coefficient 1.4
Ra Access resistance 1.4, 3.3
Rn Nanopore resistance 1.6
S Siemens, unit of conductance 4.5
Bulk solution conductivity 1.4, 2.1, 3.3
s Second, unit of time 2.3
seq Steady-state site occupation 4.3
Si Silicon 1.2, 3.3
SiNx Non-stoichiometric silicon nitride 2.1, 3.2
SiO- Silicon hydroxide ion 1.2, 3.3
SiOH Silicon hydroxide 1.2, 3.3
smax Maximum number of available binding sites 4.3
s Surface charge density 1.4, 4.1
ss-DNA Single-Stranded DNA 1.1, 2.1
STEM Scanning transmission electron microscopy 2.2
T Thymine 2.1
T Temperature 4.5
TEM Transmission electron microscope 2.1, 3.2
TNT Trinitrotoluene 1.1, 2.1, 3.1
V Volt, unit of electrical potential 2.2, 3.3
v Velocity 3.3, 4.2
Vn Voltage dropped across the nanopore 1.4
xxi
Angular frequency 2.3
w Width of analyte molecule 2.1
wn Nanoslit width 1.4, 4.1
Angle of elliptical polarized light 2.3
z
Empirical constant used to determine the magnitude of
the event from the slope at the onset of the event 3.3
p Zeta potential at the polyelectrolyte surface 2.1
CHAPTER 1
SINGLE CHANNEL RECORDING IN SOLID-STATE NANOPORES AND NANOCHANNELS
1.1 Single Channel Recording
Nanofluidic devices enable sensing capabilities not observed in microfluidic platforms. These sensing abilities arise because the critical dimensions of nanofluidic devices are commensurate with the electrical double layer (EDL), diffusion length scales of small molecules, and molecular dimensions of biological macromolecules.1-5 Additionally, hydrodynamic interactions and long-range electrostatic forces6 that could be neglected in macroscale environments are often enhanced within nanoconfined spaces.7,8 These enhancements enable nanofluidic technologies to be used for a number of applications including molecular separation, template synthesis, and biosensing and manipulation.9-15 While there are a number of nanofluidic tools, one particularly sensitive method is single channel recording.
2
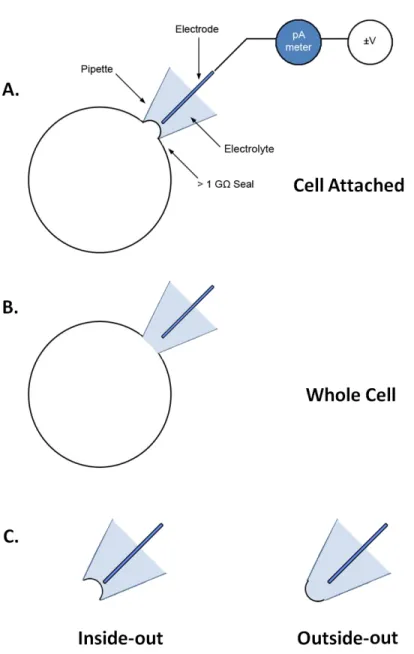
can migrate through them and induce an ionic current. This current passes through an electrolyte solution and is detected and amplified. Perturbations in the open pore, or quiescent, conductance arise in response to a change in the ion channel’s state (i.e., open or closed) or the transport of an analyte other than the sensing ions passing through the ion channel. Because signals are typically picoamperes in strength, the gigaohm or better seal is critical for isolating ion channel signals from electrical background noise due to leakage current.17 With a high-quality seal and modern electronics, it is routinely possible to detect single molecules of analyte passing through the ion channels.
Under certain conditions, the gigaohm seal between the membrane and the pipette can withstand electrical and mechanical manipulation, enabling a number of patch clamp configurations.17,18 Figure 1.1-B illustrates a cell whose membrane has been ruptured using an electrical or vacuum pulse. Using a sufficiently small cell (diameter < 10 m), ion channel conductance can be averaged across the cell membrane. The average can then be used to determine the relative importance and role of a given type of ion channel within the cell.19 Alternatively, a patch of membrane can be excised from the cell to form independent membrane experiments. These designs allow channels to be characterized independent of cellular function (Figure 1.1-C).17,19 In each of these configurations, the ability to maintain a > 1 G seal between the membrane and the pipette is necessary for sensitive picoampere measurements across the ion channel.
3
between the lipid bilayer and the solid support isolating the two reservoirs from leakage currents. The implanted protein creates a nanometric channel across the membrane capable of sensitive picoampere detection of analyte molecules that pass through the channel. The presence of an analyte within the channel is detected as a transient current response having a profile dependent on the analyte’s size and charge, as discussed in detail in Section 1.4 below.
The most commonly implanted protein is the heptameric pore complex, -hemolysin (Figure 1.2-B). Naturally expressed by Staphylococcus aureus, -hemolysin spontaneously inserts itself within the outer membrane of susceptible cells. Uninhibited transmembrane transport exposes the cell to ionic gradient changes and irreversible osmotic swelling that eventually leads to cellular death.21 However, within these lipid films this non-gating pore provides a stable quiescent conductance capable of single molecule detection of macromolecules such as DNA.
4
number of temporal and geometric resolution constraints, which make it difficult to distinguish individual nucleotide signatures without significant additional engineering.26
While its size and structure make -hemolysin particularly well suited for interrogating ss-DNA, it is not necessarily optimal for characterizing other analytes. Site-specific protein modifications have provided a means to circumvent some of these resolution issues and offer a method for sensing analytes to which the native -hemolysin structure is not amenable. Engineered -hemolysin analogues have demonstrated single molecule detection for a number analytes including trinitrotoluene (TNT),27 some organic molecules,28 and individual nucleotides.29 Alternative protein channels have also been modified to reduce gating response and detect target molecules.30,31 However, genetic modification of biological ion channels for individual applications requires rigorous development, which may be avoided through the use of solid-state nanopores.
5
suspended across silicon supports (Figure 1.3-B).1,42,43 Silicon-based substrates are frequently used for the fabrication of micro- and nanofluidics because they have high processibility, compatibility with biological analytes, and flexibility in surface modification.44,45 Furthermore, modifications of these surface groups can be used to subtly tune interactions with analytes, enabling the alteration of analyte mobility or the selective capture of target analytes.
1.2 The Electric Double Layer
Silicon substrates stored in ambient laboratory conditions undergo oxidation, thus forming a thin native oxide film at the surface.44 In solution, this surface is negatively charged at neutral pH due to the dissociation of the silanol protons (Equation 1.1).46
SiOH SiO- + H+, pKa 4.7 (1.1)
As shown in Figure 1.4-A, counterions are electrostatically attracted to the surface. The ions align in a manner analogous to a capacitor to form the electrical double layer which can be used to regulate electrokinetic phenomena such as electroosmosis and streaming currents.47,48
6
commensurate with the Debye length, creating sensing environments not observed in progenitor microfluidic systems.
1.3 Nanoconfined Environments
Under certain conditions, nanoconfined environments induce hydrodynamic and ion mobility characteristics that differ from bulk solution properties.8,50,51 Confinement-induced intermolecular forces coupled with fluid-wall interactions have been shown to decrease analyte diffusion, increase fluid viscosity,52 decrease hydrodynamic friction,51 and cause a displacement of gas-transition pressure (a phenomenon known as capillary condensation).53 Growing interest in these nanoconfined environments has spurred investigations into more refined models that can account for confinement-induced properties.4,5,7,54-59
Navier-Stokes and Poisson-Boltzmann equations have been used to model fluid dynamics and surface charge effects in microfluidic or larger systems. However, the limitations to these models become apparent as one approaches nanoconfined spaces.3,46,57 Navier-Stokes continuum models become invalid in nanoconfined spaces due to the strong inhomogeneity in the fluid density near the wall of the nanochannel.7 Contrary to bulk solution properties, nanoconfined spaces have been shown to induce fluid-wall interactions that affect solution viscosity and hydrodynamic flow and that are not explained by Navier-Stokes equations.8,60
7
contributes to ion dispersion in a manner not described by the Poisson-Boltzmann equation.47 While molecular dynamics and Monte Carlo simulations are among the most powerful tools for describing these fluidic dynamics, they can be computationally costly.7 As a result, simpler models have been proposed.58 However, experimental confirmation of the validity of these nanoconfined effects is critical for a quantitative understanding of conductometric devices.
1.4 Channel Conductance Ohmic Behavior
Conductometric sensing using nanofluidic devices depends on first characterizing the quiescent ionic conductance. The simplest conductance profile is observed when ion transport is equivalent under both forward and reverse bias. Ohm’s law (V = IR) can then be used to characterize the channel conductance. Figure 1.5 illustrates this ideal ohmic condition. In the absence of alternating current, it can be modeled as a circuit of three resisters in series, where Rn is the pore resistance and Ra is the access resistance. Access resistance accounts for the convergent and divergent ionic pathways at the entrance and exit of the channel, which can affect the actual voltage dropped across the nanochannel (Vn).69 Ohmic behavior can be expected from nanochannels with geometric and chemical symmetry, as well as, symmetry in cation and anion concentration and electrokinetic mobility. Potassium chloride is a commonly used electrolyte because the mobility of the individual ions approach this ideal case.64
Rectifying Behavior
8
I-V curves known as current rectification. Current rectification occurs when ions exhibit dissimmilar conductivity when biased by a potential of the same magnitude but opposite polarity.
Current rectification has been well documented in the characterization of nuclear track etched nanochannels.59,75,79-81 Using low dose alpha particles, a single particle is transmitted through a polymer film, often poly(ethylene terephthalate) (PET). To create a conical nanochannel, the latent track is etched from a single side while the transmembrane conductance is monitored to regulate the nanochannel dimensions. In conical nanochannels with negatively charged surfaces, conductance is higher when cations are driven from nanochannel tip to base (and anions are driven from base to tip). Several competing theories have been proposed to explain the phenomenon, including models based on ratcheting mechanism, electrostatic traps, or tip electrochemistry.78 The difference between the forward and reverse flow paths can be quantified using a current rectification coefficient, Q = |I(V-)/I(V+)|,59 and has been studied for a range of nanochannel sizes and electrolyte concentrations.75,77,78,82
9
nanopore at the tip of the channel versus the wider portions of the channel. Former knowledge of channel geometry and current rectification is critical in differentiating asymmetrical analyte induced perturbations from asymmetries inherent to the channel dimensions.
Analyte Induced Perturbations
Driven by concentration or voltage gradients, analytes enter the nanometric sensing region and induce signature perturbations in the quiescent conductance. As suggested previously, the profile of this response will depend on a number of factors including solution properties and the properties of the analyte relative to the channel. To understand this relative response, we first examine the factors that dictate channel conductance. Equation 1.2 describes the conductance of univalent ions through a nanochannel,
(1.2)
High Low
where is the bulk solution conductivity; An, ln, and wn are the nanochannel’s cross-sectional area, length, and width respectively; opp represents the counterion mobility; |s| is the magnitude of the surface charge density, and is the ionic strength of the buffer.64
From Equation 1.2, the volumetric and surface charge contributions to conductance are seen to dominate in high conductivity and low conductivity electrolytes, respectively.
10
macromolecules), a decrease in conductance will be observed as total ion flux is reduced.26 The signal magnitude will scale with size of the analyte, relative to that of the nanochannel.
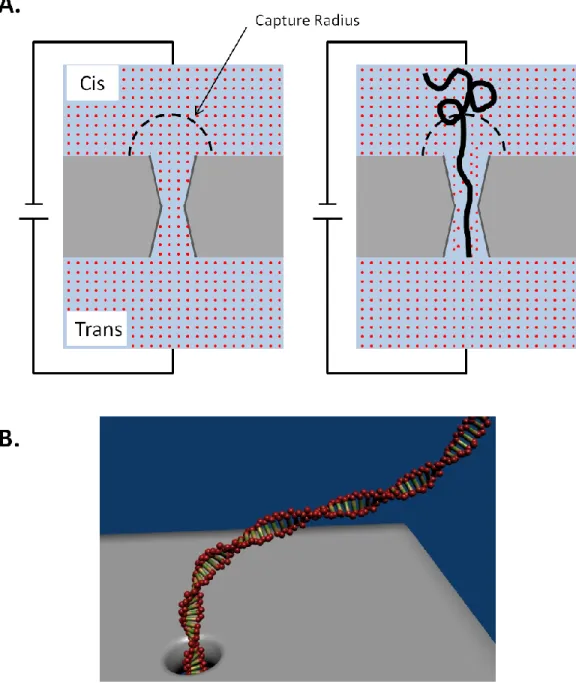
Similar to Coulter counters,84 nanochannel conductance may be monitored in real time to interrogate analytes stochastically traversing the nanochannel. Nanofluidic devices have demonstrated single molecule detection capabilities providing conformational information85 of polyelectrolytes (such as ss-DNA86 and ds-DNA87-89). Using a transmembrane potential, lambda phage ds-DNA molecules were electrophoretically driven through a nanopore (Figure 1.6-A). In a solution of 1 M KCl, volumetric constraints of the channel are the dominate contributor to channel conductance. The temporary occupation of the pore by the ds-DNA perturbs the quiescent ionic flux causing a temporary suppression of the current (Figure 1.6-A, inset).
11
High surface to volume ratios also enable analytes to be captured within nanochannel devices. In these cases, the conductance of the channel is monitored and compared to the conductance prior to capture. Figure 1.6-B demonstrates an enhancement of the conductance due to the capture of streptavidin molecules in a nanochannel with biotin functionalized walls. In low ionic strength buffer, the capture of charged streptavidin (-1.6 e at pH 7)91 increases the surface charge density, enhancing conductance. The relative difference between the pre- and post-capture I-V curves can be related to analyte concentration and reaction time.92 Due to the progressive accumulation of analyte on the surface and the high surface-to-volume ratio of these channels, this method could prove useful for analytes found in low concentration (10-9 M range) such as hormones and serum components.93
1.5 Scope of Dissertation
Conductometric sensing using solid-state platforms enables rapid, label-free detection with the potential for lower experimental cost24,94,95 and integration with other technologies.96,97 The aims of this research were to evaluate and employ surface modifications within solid-sate nanopores and nanochannels to enhance analyte response and capture. Surface modified devices were employed as both stochastic and surface capture sensors.
DNA Manipulation
12
molecule whose genetic information is intrinsically organized along the molecule’s length has potential as a sequencing platform. Solid-state nanopores provide rapid, label-free detection with long read lengths. However, the rapid nature of these translocation events ( 10-6
s/ bp),101 presents a challenge for achieving temporal resolution of the individual bases. High surface to volume ratios within these nanochannels provide opportunities for reducing analyte transit. Surface induced retention of the analyte within the channel could reduce the translocation velocity and provide more time for interrogating individual bases.
Within this work, solid-state nanofluidic surfaces were chemically modified to promote greater surface interactions and reduce the translocation velocity of ds-DNA. Because stochastic sensors evaluate transient events, surface coatings were evaluated on their ability to increase the duration of DNA events, without inhibiting capture or resulting in irreversible adsorption of the analyte within the nanofluidic device.
Target Analyte Capture
13
conductance compared to the channel conductance prior to analyte introduction.15,92 Using this steady-state comparison of the conductance (no analyte in free solution), these reports provide no kinetic information about complex formation within nanoconfined environments. Additionally, repetition of these experiments requires cumbersome recoating procedures.
14 1.6 Figures
15
16
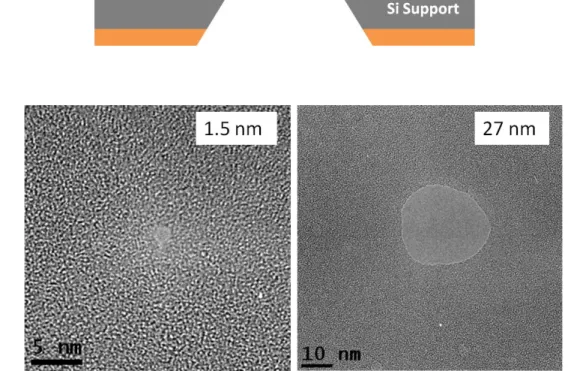
FIGURE 1.3: A.) Solid-state nanopores can be milled through insulating films such as silicon oxide or nitride. B.) Using a focused electron beam, nanopores of various sizes have been routinely milled in silicon nitride films (thickness < 50 nm).
A.
17
18
19
FIGURE 1.6: Modes of single channel recording for analyte detection. A.) Nanofluidic stochastic sensors monitor single molecules passing through a nanopore. Background electrolyte ions that travel orders of magnitude faster than the analyte (in this case ds-DNA), are hindered from passing through the nanopore and a tempoary suppression of the channel conductance is observed. Translocation events (inset) can reveal information about the relative size, charge, and surface interaction of the analyte within the nanochannel. B.) Overall channel conductance can be compared to reveal surface captured analytes. Here the I-V curves of a biotinylated channel before (blue) and after (red) incubation with streptavidin are shown. After incubation, unbound protein is then rinsed away and replaced with sensing buffer. Using low ionic strength buffer the conductance of the channel increased due to the charge of streptavidin (-1.6 e at pH 7) increasing the surface charge density (s).
A.
20 1.7 References
1. Menard, L. D.; Ramsey, J. M., Fabrication of sub-5 nm nanochannels in insulating substrates using focused ion beam milling. Nano Lett. 2010, 11, 512-517.
2. Pu, Q.; Yun, J.; Temkin, H.; Liu, S., Ion-enrichment and ion-depletion effect of nanochannel structures. Nano Lett. 2004, 4, 1099-1103.
3. Qiao, R.; Aluru, N. R., Ion concentrations and velocity profiles in nanochannel electroosmotic flows. J. Chem. Phys. 2003, 118, 4692-4701.
4. Baldessari, F., Electrokinetics in nanochannels: Part I. Electric double layer overlap and channel-to-well equilibrium. J. Colloid Interface Sci. 2008, 325, 526-538.
5. Choi, Y. S.; Kim, S. J., Electrokinetic flow-induced currents in silica nanofluidic channels. J. Colloid Interface Sci. 2009, 333, 672-678.
6. Li, X.; Shi, Y.; Yang, Y.; Du, H.; Zhou, R.; Zhao, Y., How does water-nanotube interaction influence water flow through the nanochannel? J. Chem. Phys. 2012, 136, 175101.
7. Guo, Z.; Zhao, T. S.; Shi, Y., Generalized hydrodynamic model for fluid flows: from nanoscale to macroscale. Phys. Fluids 2006, 18, 067107.
8. Gardeniers, H., Chemistry in nanochannel confinement. Anal. Bioanal. Chem. 2009, 394, 385-397.
9. Osmanbeyoglu, H. U.; Hur, T. B.; Kim, H. K., Thin alumina nanoporous
membranes for similar size biomolecule separation. J. Membr. Sci. 2009, 343, 1-6.
10. Prabhu, A. S.; Jubery, T. Z. N.; Freedman, K. J.; Mulero, R.; Dutta, P.; Kim, M. J., Chemically modified solid state nanopores for high throughput nanoparticle separation. J. Phys.: Condens. Matter 2010, 22, 454107.
11. Luo, M. B.; Wang, C., Separating different polymers using an interacting nanopore: A Monte Carlo study. Phys. Chem. Chem. Phys. 2013, 15, 3212-7. 12. Adiga, S. P.; Jin, C.; Curtiss, L. A.; Monteiro-Riviere, N. A.; Narayan, R. J.,
21
13. Apel, P. Y.; Blonskaya, I. V.; Orelovitch, O. L.; Sartowska, B. A.; Spohr, R., Asymmetric ion track nanopores for sensor technology. Reconstruction of pore profile from conductometric measurements. Nanotechnology 2012, 23, 225503. 14. Howorka, S.; Siwy, Z., Nanopore analytics: sensing of single molecules. Chem.
Soc. Rev. 2009, 38, 2360-2384.
15. Karnik, R.; Castelino, K.; Fan, R.; Yang, P.; Majumdar, A., Effects of biological reactions and modifications on conductance of nanofluidic channels. Nano Lett. 2005, 5, 1638-1642.
16. Nobel Prize in Physiology or Medicine 1991.
http://www.nobelprize.org/nobel_prizes/medicine/laureates/1991/press.html (August 21, 2012),
17. Hamill, O. P.; Marty, A.; Neher, E.; Sakmann, B.; Sigworth, F. J., Improved patch-clamp techniques for high-resolution current recording from cells and cell-free membrane patches. Pflugers Arch 1981, 391, 85-100.
18. Hamill, O. P.; Sakmann, B., A cell-free method for recording single channel currents from biological membranes. J. Physiol.-London 1981, 312, P41-P42. 19. Penner, R., A practical guide to patch clamping. In Single-Channel Recording,
2nd ed.; Sakmann, B.; Neher, E., Eds. Springer US: 2009; pp 3-30. 20. Williams, A. J., An introduction to the methods available for ion channel
reconstitution. In Ion Channel Reconstitution, Miller, C., Ed. Plenum Press: New York, 1986; pp 79-99.
21. Aksimentiev, A. Bacterial toxin alpha-Hemolysin.
http://www.ks.uiuc.edu/Research/hemolysin/ (January 16, 2008), 22. Church, G.; Deamer, D. W.; Branton, D.; Baldarelli, R.; Kasianowicz, J.
Characterization of individual polymer molecules based on monomer-interface interactions United States of America Patent No. 5,795,782, 1998.
23. Kasianowicz, J. J.; Brandin, E.; Branton, D.; Deamer, D. W., Characterization of individual polynucleotide molecules using a membrane channel. Proc. Natl. Acad. Sci. U. S. A. 1996, 93, 13770-13773.
22
25. Meller, A.; Branton, D., Single molecule measurements of DNA transport through a nanopore. Electrophoresis 2002, 23, 2583-2591.
26. Wanunu, M., Nanopores: a journey towards DNA sequencing. Physics of Life Reviews 2012, 9, 125-158.
27. Guan, X.; Gu, L.-Q.; Cheley, S.; Braha, O.; Bayley, H., Stochastic sensing of TNT with a genetically engineered pore. ChemBioChem 2005, 6, 1875-1881. 28. Gu, L.-Q.; Braha, O.; Conlan, S.; Cheley, S.; Bayley, H., Stochastic sensing of
organic analytes by a pore-forming protein containing a molecular adapter. Nature (London, U. K.) 1999, 398, 686-690.
29. Clarke, J.; Wu, H.-C.; Jayasinghe, L.; Patel, A.; Reid, S.; Bayley, H., Continuous base identification for single-molecule nanopore DNA sequencing. Nat.
Nanotechnol. 2009, 4, 265-270.
30. Derrington, I. M.; Butler, T. Z.; Collins, M. D.; Manrao, E.; Pavlenok, M.; Niederweis, M.; Gundlach, J. H., Nanopore DNA sequencing with MspA. Proc. Natl. Acad. Sci. U. S. A. 2010, 107, 16060-16065.
31. Wendell, D.; Jing, P.; Geng, J.; Subramaniam, V.; Lee, T. J.; Montemagno, C.; Guo, P. X., Translocation of double-stranded DNA through membrane-adapted phi29 motor protein nanopores. Nat. Nanotechnol. 2009, 4, 765-772.
32. Kim, J.; Pedrotti, K. D.; Dunbar, W. B., On-chip patch-clamp sensor for solid-state nanopore applications. Electron. Lett. 2011, 47, 844-846.
33. Nukaga, O.; Yammamoto, S.; Tabata, K.; Kubota, T.; Samukawa, S.; Sugiyama, M., Lateral nano-channel fabricated in fused silica by femtosecond laser
irradiation and wet etching. In 14th International Conference on Miniaturized Systems for Chemical and Life Sciences, Groningen Netherlands, 2010; pp 1199-1201.
34. Schmidt, J., Stochastic sensors. J. Mater. Chem. 2005, 15, 831-840.
35. Howorka, S.; Siwy, Z., Nanopores: generation, engineering, and single-molecule applications. In Handbook of Single-Molecule Biophysics, Hinterdorfer, P.; Oijen, A., Eds. Springer US: 2009; pp 293-339.
23
37. Wu, J.; Gerstandt, K.; Zhang, H.; Liu, J.; Hinds, B. J., Electrophoretically induced aqueous flow through single-walled carbon nanotube membranes. Nat.
Nanotechnol. 2012, 7, 133-139.
38. Majumder, M.; Ajayan, P. M. In Carbon nanotube membranes: a new frontier in membrane science, 2010; Elsevier Ltd.: 2010; pp 291-310.
39. Apel, P. Y.; Korchev, Y. E.; Siwy, Z.; Spohr, R.; Yoshida, M., Diode-like single-ion track membrane prepared by electro-stopping. Nucl. Instrum. Methods Phys. Res., Sect. B 2001, 184, 337-346.
40. Cao, L.; Wang, Y., Fabrication and investigation of single track-etched nanopore and its applications. Radiat. Meas. 2009, 44, 1093-1099.
41. Li, J.; Stein, D.; McMullan, C.; Branton, D.; Aziz, M. J.; Golovchenko, J. A., Ion-beam sculpting at nanometre length scales. Nature 2001, 412, 166-169.
42. Lo, C. J.; Aref, T.; Bezryadin, A., Fabrication of symmetric sub-5 nm nanopores using focused ion and electron beams. Nanotechnology 2006, 17, 3264.
43. Storm, A. J.; Chen, J. H.; Ling, X. S.; Zandbergen, H. W.; Dekker, C., Fabrication of solid-state nanopores with single-nanometre precision. Nat. Mater. 2003, 2, 537-540.
44. Madou, M. J., Fundamentals of microfabrication : the science of miniaturization. CRC Press: Boca Raton, 2002.
45. Muthusubramaniam, L.; Lowe, R.; Fissell, W. H.; Li, L.; Marchant, R. E.; Desai, T. A.; Roy, S., Hemocompatibility of silicon-based substrates for biomedical implant applications. Ann. Biomed. Eng 2011, 39, 1296-305.
46. Tandon, V.; Bhagavatula, S. K.; Nelson, W. C.; Kirby, B. J., Zeta potential and electroosmotic mobility in microfluidic devices fabricated from hydrophobic polymers: 1. The origins of charge. Electrophoresis 2008, 29, 1092-1101. 47. Israelachvili, J. N., Electrostatic forces between surfaces in liquids. In
Intermolecular and surface forces, 2 ed.; Academic Press London: London, 1992; pp 213-259.
48. Bard, A. J., Electrochemical methods : fundamentals and applications. In Faulkner, L. R., Ed. Wiley: New York, 2001; pp 551-554.
24
50. Stein, D.; Kruithof, M.; Dekker, C., Surface-charge-governed ion transport in nanofluidic channels. Phys. Rev. Lett. 2004, 93, 035901.
51. Joly, L.; Ybert, C.; Trizac, E.; Bocquet, L., Liquid friction on charged surfaces: from hydrodynamic slippage to electrokinetics. J. Chem. Phys. 2006, 125, 204716-14.
52. Kaji, N.; Ogawa, R.; Oki, A.; Horiike, Y.; Tokeshi, M.; Baba, Y., Study of water properties in nanospace. Anal. Bioanal. Chem. 2006, 386, 759-764.
53. Gelb, L. D.; Gubbins, K. E.; Radhakrishnan, R.; Sliwinska-Bartkowiak, M., Phase separation in confined systems. Reports on Progress in Physics 1999, 62, 1573. 54. Levine, S.; Marriott, J. R.; Robinson, K., Theory of electrokinetic flow in a
narrow parallel-plate channel. J. Chem. Soc., Faraday Trans. 2 1975, 71, 1-11. 55. Baldessari, F., Electrokinetics in nanochannels: Part II. Mobility dependence on
ion density and ionic current measurements. J. Colloid Interface Sci. 2008, 325, 539-546.
56. Wang, M.; Kang, Q.; Ben-Naim, E., Modeling of electrokinetic transport in silica nanofluidic channels. Anal. Chim. Acta 2010, 664, 158-164.
57. Movahed, S.; Li, D., Electrokinetic transport through nanochannels. Electrophoresis 2011, 32, 1259-1267.
58. Guo, Z.; Zhao, T. S.; Shi, Y., Simple kinetic model for fluid flows in the nanometer scale. Physical review. E, Statistical, nonlinear, and soft matter physics 2005, 71, 035301.
59. Guo, W.; Xue, J. M.; Zhang, W. M.; Zou, X. Q.; Wang, Y. G., Electrolytic conduction properties of single conical nanopores. Radiat. Meas. 2008, 43, Supplement 1, S623-S626.
60. Li, S.-J.; Wang, C.; Wu, Z.-Q.; Xu, J.-J.; Xia, X.-H.; Chen, H.-Y., Real-time monitoring of mass-transport-related enzymatic reaction kinetics in a
nanochannel-array reactor. Chemistry – A European Journal 2010, 16, 10186-10194.
61. Daiguji, H.; Yang, P.; Majumdar, A., Ion transport in nanofluidic channels. Nano Lett. 2003, 4, 137-142.
25
63. Ho, C.; Qiao, R.; Heng, J. B.; Chatterjee, A.; Timp, R. J.; Aluru, N. R.; Timp, G., Electrolytic transport through a synthetic nanometer-diameter pore. Proc. Natl. Acad. Sci. U. S. A. 2005, 102, 10445-10450.
64. Schoch, R. B.; Renaud, P., Ion transport through nanoslits dominated by the effective surface charge. Appl. Phys. Lett. 2005, 86, 253111.
65. Schoch, R. B.; Lintel, H. v.; Renaud, P., Effect of the surface charge on ion transport through nanoslits. Phys. Fluids 2005, 17, 100604.
66. Zhou, K.; Kovarik, M. L.; Jacobson, S. C., Surface-charge induced ion depletion and sample stacking near single nanopores in microfluidic devices. J. Am. Chem. Soc. 2008, 130, 8614-8616.
67. Perry, J. M.; Zhou, K.; Harms, Z. D.; Jacobson, S. C., Ion transport in nanofluidic funnels. ACS Nano 2010, 4, 3897-3902.
68. Guldbrand, L.; Jonsson, B.; Wennerstrom, H.; Linse, P., Electrical double layer forces. A Monte Carlo study. J. Chem. Phys. 1984, 80, 2221-2228.
69. Hall, J. E., Access resistance of a small circular pore. The Journal of General Physiology 1975, 66, 531-532.
70. Mara, A.; Siwy, Z.; Trautmann, C.; Wan, J.; Kamme, F., An asymmetric polymer nanopore for single molecule detection. Nano Lett. 2004, 4, 497-501.
71. Heins, E. A.; Siwy, Z. S.; Baker, L. A.; Martin, C. R., Detecting single porphyrin molecules in a conically shaped synthetic nanopore. Nano Lett. 2005, 5, 1824-1829.
72. Ali, M.; Yameen, B.; Neumann, R.; Ensinger, W.; Knoll, W.; Azzaroni, O., Biosensing and supramolecular bioconjugation in single conical polymer
nanochannels. Facile incorporation of biorecognition elements into nanoconfined geometries. J. Am. Chem. Soc. 2008, 130, 16351-16357.
73. Ali, M.; Schiedt, B.; Neumann, R.; Ensinger, W., Biosensing with functionalized Single asymmetric polymer nanochannels. Macromol. Biosci. 2010, 10, 28-32. 74. Willmott, G. R.; Parry, B. E. T., Resistive pulse asymmetry for nanospheres
passing through tunable submicron pores. J. Appl. Phys. 2011, 109, 094307. 75. Apel, P. Y.; et al., Effect of nanopore geometry on ion current rectification.
26
76. Cruz-Chu, E. R.; Aksimentiev, A.; Schulten, K., Ionic current rectification through silica nanopores. J. Phys. Chem. C 2009, 113, 1850-1862.
77. Kubeil, C.; Bund, A., The role of nanopore geometry for the rectification of ionic currents. J. Phys. Chem. C 2011, 115, 7866-7873.
78. Siwy, Z. S., Ion-current rectification in nanopores and nanotubes with broken symmetry. Adv. Funct. Mater. 2006, 16, 735-746.
79. Wang, X.; Xue, J.; Wang, L.; Guo, W.; Zhang, W.; Wang, Y.; Liu, Q.; Ji, H.; Ouyang, Q., How the geometric configuration and the surface charge distribution influence the ionic current rectification in nanopores. J. Phys. D: Appl. Phys. 2007, 40, 7077.
80. Kovarik, M. L.; Zhou, K.; Jacobson, S. C., Effect of conical nanopore diameter on ion current rectification. J. Phys. Chem. B 2009, 113, 15960-15966.
81. Apel, P. Y.; Blonskaya, I. V.; Levkovich, N. V.; Orelovich, O. L., Asymmetric track membranes: relationship between nanopore geometry and ionic
conductivity. Pet. Chem. 2011, 51, 555-567.
82. Jung, J.-Y.; Joshi, P.; Petrossian, L.; Thornton, T. J.; Posner, J. D.,
Electromigration current rectification in a cylindrical nanopore due to asymmetric concentration polarization. Anal. Chem. 2009, 81, 3128-3133.
83. Hou, X.; Yang, F.; Li, L.; Song, Y.; Jiang, L.; Zhu, D., A biomimetic asymmetric responsive single nanochannel. J. Am. Chem. Soc. 2010, 132, 11736-11742. 84. DeBlois, R. W.; Bean, C. P., Counting and sizing of submicron particles by the
resistive pulse technique. Rev. Sci. Instrum. 1970, 41, 909-916.
85. Fologea, D.; Brandin, E.; Uplinger, J.; Branton, D.; Li, J., DNA conformation and base number simultaneously determined in a nanopore. Electrophoresis 2007, 28, 3186-3192.
86. Fologea, D.; Gershow, M.; Ledden, B.; McNabb, D. S.; Golovchenko, J. A.; Li, J., Detecting single stranded DNA with a solid state nanopore. Nano Lett. 2005, 5, 1905-1909.
87. Dekker, C., Solid-state nanopores. Nat. Nanotechnol. 2007, 2, 209-215. 88. Dimitrov, V.; Mirsaidov, U.; Wang, D.; Sorsch, T.; Mansfield, W.; Miner, J.;
27
89. Gershow, M.; Golovchenko, J. A., Recapturing and trapping single molecules with a solid-state nanopore. Nat Nano 2007, 2, 775-779.
90. Fan, R.; Karnik, R.; Yue, M.; Li, D.; Majumdar, A.; Yang, P., DNA translocation in inorganic nanotubes. Nano Lett. 2005, 5, 1633-1637.
91. Sivasankar, S.; Subramaniam, S.; Leckband, D., Direct molecular level measurements of the electrostatic properties of a protein surface. Proc. Natl. Acad. Sci. U. S. A. 1998, 95, 12961-12966.
92. Schoch, R. B.; Cheow, L. F.; Han, J., Electrical detection of fast reaction kinetics in nanochannels with an induced flow. Nano Lett. 2007, 7, 3895-3900.
93. Weetall, H. H., Biosensor technology What? Where? When? and Why? Biosens. Bioelectron. 1996, 11, i-iv.
94. Nakane, J.; Akeson, M.; Marziali, A., Evaluation of nanopores as candidates for electronic analyte detection. Electrophoresis 2002, 23, 2592-2601.
95. Durand, N. F. Y.; Renaud, P., Label-free determination of protein-surface
interaction kinetics by ionic conductance inside a nanochannel. Lab Chip 2009, 9, 319-324.
96. Mir, M.; Homs, A.; Samitier, J., Integrated electrochemical DNA biosensors for lab-on-a-chip devices. Electrophoresis 2009, 30, 3386-3397.
97. Healy, K.; Schiedt, B.; Morrison, A. P., Solid-state nanopore technologies for nanopore-based DNA analysis. Nanomedicine 2007, 2, 875-897.
98. Saleh, O. A.; Sohn, L. L., An artificial nanopore for molecular sensing. Nano Lett. 2002, 3, 37-38.
99. Chang, H.; Kosari, F.; Andreadakis, G.; Alam, M. A.; Vasmatzis, G.; Bashir, R., DNA-mediated fluctuations in ionic current through silicon oxide nanopore channels. Nano Lett. 2004, 4, 1551-1556.
100. Purnell, R. F.; Mehta, K. K.; Schmidt, J. J., Nucleotide identification and orientation discrimination of DNA homopolymers immobilized in a protein nanopore. Nano Lett. 2008, 8, 3029-3034.
101. Fologea, D.; Uplinger, J.; Thomas, B.; McNabb, D. S.; Li, J., Slowing DNA Translocation in a solid-state nanopore. Nano Lett. 2005, 5, 1734-1737.
28
detection of pneumococcal capsular polysaccharide antigens. J. Immunol. Methods 1987, 104, 265-270.
103. Kitamura, K.; Matsuda, K.; Ide, M.; Tokunaga, T.; Honda, M., A fluorescence sandwich ELISA for detecting soluble and cell-associated human interleukin-2. J. Immunol. Methods 1989, 121, 281-288.
CHAPTER 2
SURVEY OF THE EFFECT OF HYDROPHOBIC SURFACE COATINGS ON DNA TRANSLOCATION 2.1 Introduction
In high ionic strength solutions, nanopore devices are capable of interrogating conformational changes in macromolecules with single molecule sensitivity. Using conductometric sensing these devices are capable of rapid, label-free detection that is amenable to electrical and computational analysis.1-5 Much of this research has been focused on the manipulation6-8 and interrogation of nucleic acids for the development of sequencing technologies.4,9-13 The high sensitivity and rapid, electrical detection have potential to significantly reduce the time and cost of genomic sequencing.
Genomic Sequencing
30
specificity, ensuring that knowledge of the single-stranded DNA (ss-DNA) sequence is indicative of the complementary strand. Despite the different chemical structures of the nucleotides, base pair formations (A-T and G-C) are commensurate in size and therefore can be arranged in any order along the length of the DNA molecule,15 providing unrestricted sequence possibilities. Within biological organisms, DNA templates are transcribed to form RNA, which are subsequently translated to synthesize proteins – the central dogma of molecular biology.16 Identification of the progenitor DNA sequence can therefore be used to understand and/or manipulate gene expression within complex biological systems.
Elucidation of the human genome could unveil critical factors of health and disease.17 Comprised of over 6 billion base pairs, fully sequencing the diploid human genome remains a challenging task for current sequencing platforms. A high degree of accuracy is needed to identify areas of pathogenic disease. For current platforms, that are typically limited to read lengths of 50-400 bases, both accuracy and coverage are achieved by massively parallel sampling. These factors contribute to sequencing methods that remain too costly (instrument, reagents, computational analysis) and slow for routine clinical applications.
31
with one of the four 2’,3’-dideoxynuceloside triphosphates (i.e. ddATP, ddTTP, ddGTP, ddCTP) and the remaining nucleoside triphosphates at a 20-fold greater concentration. DNA polymerase is added to each of the reactions to replicate the template DNA molecules until one of the 2’,3’-dideoxynuceloside triphosphates is incorporated. Lacking a hydroxyl group at the 3’ end 2’,3’-dideoxynucelosides inhibit further synthesis and terminate the fragments with the respective reaction nucleoside at the 3’ end.22
The four batches of synthesized DNA are subsequently separated on a denaturing acrylamide gel. As illustrated in Figure 2.2-B, the size of the fragment could then be used to determine the location of the nucleoside and thereby reconstruct the sequence.
Spurred by the massive requirements of the Human Genome Project, the Sanger method was enhanced and automated to increase throughput and accuracy. Previous manual read methods required one of the nucleosides to be labeled using a radioisotope which could be detected in slab gel electrophoresis. Slab gels were later replaced with automated capillary electrophoresis and optical sensing.23 Using these capillary platforms, the system could then be multiplexed to increase analysis throughput.24,25 Employing four separate encoding dyes (dyes with different emission wavelengths) the four 2’,3’-dideoxynuceloside triphosphates could be labeled and enable optical detection within a single reaction. Sequences could then be computationally automated and read as shown in Figure 2.2-B.
32
range of techniques including cyclic array sequencing, sequencing by hybridization, and sequencing by synthesis.27,28 Such advancements have prompted commercialization of these technologies by companies such as 454 Life Sciences, Life Technologies, Illumina, Pacific Biosciences, and Oxford Nanopore.19,27,29
While recent advancements and commercial competition have enabled genomic sequencing cost to decrease by 1000-fold of the past five years,18,26 these second generation technologies still remain too costly for mainstream utility. Many of these technologies struggle with long read lengths (>500 bases), require costly reagents (i.e. fluorescent labels, enzymes), and complex bioinformatics analysis tools.27 Each of these factors adds to a current genome cost of > $10,000 per person.27,30 Nanofluidic devices, however, are capable of producing long reads (> 104 bases) and provide direct monitoring of the analyte, often without costly reagents or fluorescent tags.4,6 Using single channel recording methods Oxford Nanopore is developing a biological nanopore-based platform for single molecule DNA sequencing. If successful this nanopore device would provide a label-free detection protocol, with many nanopores arrayed in parallel for high throughput sequencing.31
Biological Nanopores
33
openings coupled with the gigaohm or better seal are capable of the sensitive signals necessary to achieve single molecule conductometric detection.
Wild-Type -Hemolysin
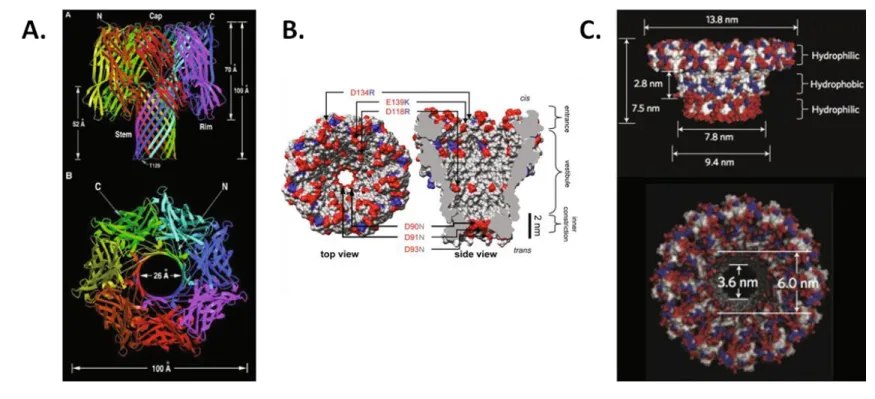
Alpha-hemolysin is the most commonly used transmembrane protein for single molecule sensing applications. Naturally expressed by Staphylococcus aureus, -hemolysin spontaneously inserts itself within the lipid bilayer creating a transmembrane nanopore with precise dimensions. Wild-type -hemolysin produces a mushroom shaped nanopore with a narrowing stem extending about 5.2 nm. The pore cap contains a 2.6 nm diameter vestibule which leads to a 1.5 nm constriction in the pore stem (Figure 2.4-A). As a non-gating protein, -hemolysin produces a stable transmembrane conductance capable of polynucleotide detection.32 First demonstrated in the 1990s by Kasianowicz et al., -hemolysin protein nanopores can be used to electrically sense single molecules of ss-DNA.31,32 The narrow constriction of the -hemolysin nanopore was also shown to selectively translocate ss-DNA and RNA while inhibiting transmembrane transport of molecules larger than the 1.5 nm diameter such as ds-DNA (width = 2 nm).
34
differences of the different bases) of these devices is limited to half of the hydrodynamic radius of the background electrolyte ions. Potassium chloride (RH ~ 0.14 nm) should therefore provide sufficient resolution of the four nucleotide bases. This claim is supported by the fact that the discrimination of homopolymers (e.g. polyA, polyT, polyC) and epigenetically modified DNA has been observed in wild-type -hemolysin nanopores.4,34-36 In many of these studies polyguanine has been omitted due to self hybridization of the molecules.37 The finite length of these nanopores, however, limit detection of genetically relevant DNA sequences because the conductometric response is a cumulative signal of the nucleotides occupying the nanopore at a given time. The convolution of these conductance signatures coupled with the rapid nature of these translocations has led to a number of challenges to developing an accurate nanopore sequencing platform.10
35
DNA molecules (ld < ln). Nucleotides that occupy the nanopore at any given time
produce a mean conductance response, which convolutes the conductometric signatures of isolated bases. Axial and transverse dynamics of the molecule may also cause an averaging affect that convolutes the conductometric response.
The rate at which DNA traverses the nanopore also presents temporal resolution challenges. Single molecules of DNA occupy the nanopore sensing region for less than 1 s/base.40 Given the picoampere signals of these nanopores, various classes of noise can limit the maximum bandwidth of the measurement. Devices must be shielded using Faraday cages and vibration isolation tables which dampen electrical and mechanical noise, respectively.41 Significant efforts have been directed towards further improving the fidelity of ion channel conductance measurements and reducing contributions of 1/f and capacitive noise.41-44 Pore conductance measurements are typically filtered using a 10 kHz low-pass filter. Optimized low-noise systems can have low-noise systems but are still limited to ~ 40 kHz.
Genetically Engineered Biological Nanopores
36
positions of the -hemolysin nanopore.35 These findings have since led to the genetic enhancement of key sensing regions of the -hemolysin nanopore which enabled single nucleotide recognition.35,50
Oxford Nanopore has been developing a custom -hemolysin nanopore with potential for single molecule DNA sequencing. Using this tailored nanopore, they are venturing to develop two DNA sequencing protocols referred to as exonuclease and strand sequencing. In exonuclease sequencing, nucleotides are sequentially cleaved from the molecule and migrated through the lumen of the -hemolysin sensing device.48 However, this method has a number of challenges in terms of controlling the proximity of the exonuclease to the nanopore, the rate of the enzymatic cleaving reaction, and the trajectory of the nucleoside monophosphates. Using the strand sequencing method, proprietary enzymes would be used to slowly ratchet ss-DNA through a genetically modified -hemolysin nanopore.51 The -hemolysin nanopore inhibits the translocation of molecules with cross sections larger than the narrowest constriction (1.5 nm). Using the narrow constriction of the -hemolysin nanopore and the finite rate of the enzymatic reaction, ss-DNA annealed to a short primer can bind to the protein complex, and be introduced to the nanopore opening at a rate more conducive to sequencing applications.
37
sensitivity with shorter homopolymer ss-DNA than -hemolysin nanopores.53,54
Manrao et al have coupled the phi29 polymerase with the MspA protein to reduce the speed of DNA translocations. Preliminary sequencing ability has been demonstrated using this strand sequencing method.55 Last year, Oxford Nanopore boasted single molecule sequencing of -DNA56
(48.5 kbp).57 Using these genetically modified nanopores strand sequencing has achieved long read DNA sequencing.58 While a significant achievement, finding alternative non-gating biological ion channels to further improve these technologies is not a trivial matter,10 and site specific modifications provide only modest variability in the nanopore profile.
Solid-State Nanopore Sensing
Innovations in solid-state nanofabrication have provided a means for producing a broad range of nanopore geometries with straightforward functionalization control. In such solid-state platforms nanopores can be produced with sub-nanometer precision, controlled profiles, and high environmental stability.59-68 One fabrication method utilizes a focused electron beam (FEB) to sputter nanometric pores within thin insulating films.60 This protocol has been used to fabricate nanopores with sub-nanometer precision within silicon and insulator substrates. The use of silicon based substrates is prevalent in micro-/nanofluidic fabrication because these surfaces are compatible with biological analytes, can be prepared in batch processes, and are amenable to surface modification.69,70
38
robust films. Using FEB milling nanopores could be milled with variable size and subsequently imaged using a TEM. FEB milled nanopores typically had a biconical profile as evidenced by TEM tomography (Figure 2.5).63 The angle of the conical walls was determined by the focus of the electron beam and the size of the nanopore (Figure 2.5-E). By prolonging the dwell time of the FEB, the narrowest constriction of the pore can continue to be sputtered away to produce larger pores (Figure 2.5-D) with cylindrical walls at the center. The FEB can also be defocused and used to alter the surface tension and viscosity of the film to induce nanopore shrinkage,60,72 and the angle is smoothed as illustrated in Figure 2.5-D (red).63
Channel Conductance
The symmetry of the biconical pores is supported by the ohmic behavior of conductometric signals. While channel conductance can be used to characterize both surface charge (G) and volumetric constriction (GV) contributions, the present work only evaluates volumetric constraints within the nanopore induced by the presence of the analyte because high ionic strength buffers are used (GV >> GS, see Chapter 1). Nanopore containing membranes are used to partition two reservoirs of electrolyte buffer with a gigaohm or better seal. The dimensions of these devices are such that ionic conductance of the reservoirs is orders of magnitude greater than the nanopore conductance, and all of the potential is dropped across the nanometric sensing region. Assuming a circular pore aperture, Equation 2.1 can be used to describe univalent channel conductance in high ionic strength buffers,
39
where + and - are the cation and anion mobility, respectively; e is elementary charge;
NA is Avogadro’s number; [Ion] is the ion concentration; dn is the diameter of the
nanopore; and ln is the thickness of the insulating membrane (which ultimately
determines the nanopore length). Convergent and divergent ionic paths at the entrance and exit of the nanopore contribute to the conductance in series with the nanopore conductance as a function of the nanopore diameter accounting for the term.73 This access conductance scales with the pore diameter and the bulk solution conductivity, = . Assuming a cylindrical nanopore, Equation 2.2 can be used to
describe the total conductance of univalent ions in nanopore devices.
(2.2)
Using low aspect ratio pores (where pore diameter is comparable to nanopore length) the contribution of the access conductance at the entrance and exit of the nanopore is of the same order of magnitude as the channel conductance.73
DNA Translocations
Voltage-driven capture of DNA molecules occurs as a two step process in which the molecules are delivered to an high electric field region near the nanopore by diffusion. Once within proximity of this electrified region, electrophoretic mobility overcomes diffusion and the negatively charged DNA molecule is driven through the opening of the nanopore. While a large majority (> 99.99%) of the voltage is dropped across the nanopore, a weaker field extends a short distance from the nanopore opening, which decreases as a function of distance, r, from the nanopore as described by Equation 2.3,
40
where V is the transmembrane voltage used to drive the background electrolyte ions and DNA through the nanopore.74 The electric field extends in a hemispherical profile from the nanopore. As the DNA diffuses closer to the nanopore, the force the DNA feel from the electric field increases and eventually overcomes the diffusive motion of the DNA molecule in free solution. Grosberg et al. has shown that the voltage necessary for the electrophoretic mobility to overcome the diffusional forces can be determined by dividing the diffusion coefficient of the molecule by the electrophoretic mobility (Equation 2.4),
, (2.4)
where r* is the critical distance away from the nanopore where this voltage is achieved.74 Equations 2.3 and 2.4 then provide the capture radius (Equation 2.5),
(2.5)
where is the electrophoretic mobility of DNA (invariant of DNA length in free solution) and D is the diffusion coefficient of DNA (as a function of DNA length).75
As the DNA enters the nanometric sensing region (Figure 2.6-B), the quiescent ionic flux is perturbed producing a conductometric response indicative of DNA properties. In high ionic strength buffer (GV >> GS), DNA partially occludes the nanopore and induces a suppression of the ionic flux for the duration of the translocation event. The magnitude of this suppression will scale with the size of the DNA molecule relative to the size of the nanopore.
41
with the cross-sectional area of the analyte. In high ionic strength buffers, the volume displacement exhibits a suppression in ionic flux (I) described by Equation 2.6,
A
l V EA
I
(2.6)
where E is the applied electric field and A is the cross sectional area of DNA.59 In contrast to biological ion channels, solid-state nanopores are often non-selective and appear chemically inert to DNA molecules. These relatively inert surfaces produce little surface interaction between the DNA molecule and nanopore interior, resulting in faster translocation events. However, these solid-state nanopores are capable of straightforward surface modification, which could be used to control the speed of translocation events.
Methods for Controlling Translocation Dynamics