A variable active site residue influences the kinetics of response
regulator phosphorylation and dephosphorylation
Robert M. Immormino†, Ruth E. Silversmith, and Robert B. Bourret*
Department of Microbiology and Immunology, University of North Carolina, Chapel Hill, North Carolina 27599-7290, United States
Abstract
Two-component regulatory systems, minimally composed of a sensor kinase and a response regulator protein, are common mediators of signal transduction in microorganisms. All response regulators contain a receiver domain with conserved active site residues that catalyze the signal activating and deactivating phosphorylation and dephosphorylation reactions. We explored the impact of variable active site position T+1 (one residue C-terminal to the conserved Thr/Ser) on reaction kinetics and signaling fidelity, using wild type and mutant Escherichia coli CheY, CheB, and NarL to respectively represent the three major sequence classes observed across response regulators: Ala/Gly, Ser/Thr, or Val/Ile/Met at T+1. Biochemical and structural data together suggested that different amino acids at T+1 impacted reaction kinetics by altering access to the active site while not perturbing overall protein structure. A given amino acid at position T+1 had similar effects on autodephosphorylation in each protein background tested, likely by modulating access of the attacking water molecule to the active site. Similarly, rate constants for CheY autophosphorylation with three different small molecule phosphodonors were consistent with the steric constraints on access to the phosphorylation site arising from combination of specific phosphodonors with particular amino acids at T+1. Because other variable active site residues also influence response regulator phosphorylation biochemistry, we began to explore how context (here, the amino acid at T+2) affected the influence of position T+1 on CheY autocatalytic reactions. Finally, position T+1 affected the fidelity and kinetics of phosphotransfer between sensor kinases and response regulators, but was not a primary determinant of their interaction.
Graphical Abstract
*Corresponding Author: [email protected]. Telephone: 919-966-2679.
†Present Address
Center for Environmental Medicine, Asthma, and Lung Biology, University of North Carollina, Chapel Hill, North Carolina 27599-7248 United States
Author Contributions
The manuscript was written through contributions of all authors. All authors have given approval to the final version of the manuscript.
The content is solely the responsibility of the authors and does not necessarily represent the official views of the National Institute of General Medical Sciences or the National Institutes of Health.
ASSOCIATED CONTENT
The following files are available free of charge.
HHS Public Access
Author manuscript
Biochemistry
. Author manuscript; available in PMC 2017 October 04.Published in final edited form as:
Biochemistry. 2016 October 4; 55(39): 5595–5609. doi:10.1021/acs.biochem.6b00645.
A
uthor Man
uscr
ipt
A
uthor Man
uscr
ipt
A
uthor Man
uscr
ipt
A
uthor Man
uscr
Keywords
CheB; CheY; NarL; two-component regulatory systems
Two-component regulatory systems are almost universal in bacteria, widespread in Archaea, and also present in plants and eukaryotic microorganisms.1, 2 In their simplest form, two-component systems consist of two proteins: a sensor kinase to receive input (often in the form of an extracellular stimulus), and a response regulator to execute the response to that stimulus. An organism may have a dozen or more two-component systems operating simultaneously. Signal fidelity and an appropriate cellular response require that the kinetics and specificity of signal transduction be highly regulated. Typically, the lifetime of a transduced signal reflects the timescale of the regulated biological process3 and cross-talk between two-component systems within the same cell is minimized.4
Stimuli detected by two-component systems are encoded, transmitted, and terminated through a series of phosphorylation and dephosphorylation reactions ending at the response regulator, which acts as a phosphorylation-mediated switch. Although response regulators typically interact with kinases and/or phosphatases in vivo, response regulators contain the catalytic machinery necessary and sufficient for phosphorylation5 and hydrolytic
dephosphorylation.6, 7 Furthermore, currently available evidence is consistent with the notion that kinases and phosphatases stimulate intrinsic response regulator reactions rather than utilize different reaction mechanisms.8–12 For these reasons, the focus of this study is on how differences between response regulators affect signaling kinetics and fidelity.
The response regulator active site (Figure 1A) is located in the receiver domain and consists of conserved residues that catalyze phosphorylation and dephosphorylation (Figure 1B), as well as variable residues that are presumably responsible for differences between response regulators. Here we explore the effects of different amino acids at variable position T+1 [one amino acid to the carboxy-terminal side of the conserved Thr/Ser (T)], which is spatially close to the conserved Asp (D) site of phosphorylation. We chose the Escherichia coli CheY, CheB, and NarL response regulators as representative of the three dominant sequence classes at position T+1: Ala/Gly, Ser/Thr, and Val/Ile/Met respectively. The kinetics of autophosphorylation and autodephosphorylation, and the fidelity of phosphotransfer from sensor kinases, were assessed for wild type and mutant response regulators carrying various substitutions at position T+1. To help clarify the molecular mechanisms underlying the observed effects on reaction kinetics and phosphodonor specificity, we also determined the X-ray crystal structures of four CheY mutants containing substitutions at position T+1 and constructed molecular models of attacking water or phosphodonors in the active site.
A
uthor Man
uscr
ipt
A
uthor Man
uscr
ipt
A
uthor Man
uscr
ipt
A
uthor Man
uscr
Collectively, our biochemical and structural analyses indicate that position T+1 affects access to the response regulator active site and so influences autophosphorylation, autodephosphorylation, phosphotransfer from sensor kinases, and signaling fidelity to varying degrees. The distribution of amino acids found at position T+1 in different response regulator subfamilies can be interpreted in the context of our findings.
EXPERIMENTAL PROCEDURES
Analysis of Response Regulator Amino Acid Sequences
To analyze amino acid composition at position T+1, all response regulator sequences were downloaded from MiST213 in September 2011. The receiver domains were aligned and any insertions not present in E. coli CheY were removed. Aligned sequences were filtered to ensure they contained six highly conserved amino acids corresponding to Asp12, Asp13, Asp57, Gly65, Thr87, and Lys109 from E. coli CheY. To reduce bias in the resulting set of 46,643 sequences, the list was trimmed to include only one species per genus and sequences with ≥90% identity to another sequence were removed. The amino acids at position T+1 were counted in the final list of 14,374 receiver domains.
Amino acid composition at T+1 was also assessed in a few response regulator subfamilies. Within the Pfam database,14 response regulator sequences are organized by the homology of their output domains. In many cases this homology extends to the receiver domain because both domains are co-inherited, but in some cases domain shuffling, gene duplication or divergent evolution of a single domain has resulted in divergent receiver domains being classified in the same Pfam family.15 The FixJ/NarL subfamily, which is defined by the presence of the GerE-like helix-turn-helix DNA binding domain (Pfam: PF00196) in addition to a receiver domain,16 is an example of such a divergent group. Therefore, to focus on NarL-like sequences we first downloaded the 7,484 protein sequences in the PF00196 family that contained an N-terminal receiver domain followed by the GerE-like DNA binding domain. We then identified the subset of sequences with NarL-like receiver domains by aligning the receiver domain sequences and subjecting them to phylogenic analysis using Multalin.17 We defined NarL-like sequences as those that remained clustered with E. coli NarL after the first branch that split E. coli NarL from the phylogenetically distant Rhizobium meliloti FixJ.15 4,084 NarL-like sequences were found. After filtering for the presence of six conserved amino acids, 3,477 sequences remained. For analysis of T+1 residues in the CheY and CheB subfamilies, we first downloaded 317 CheY and 230 CheB sequences identified by Refseq name from the MiST2 amino acid sequence database.13 Of these, 290 CheY and 211 CheB sequences passed the filtering for conserved amino acids.
Bacterial Strains, Plasmids, and Mutant Construction
Expression of CheY variants was performed using the E. coli ΔcheY strain K0641recA18 bearing wild type or mutant versions of the pRS3 plasmid.19 The CheY mutants CheYA88S, CheYA88M, and CheYA88V were from previous studies20, 21 whereas the remaining plasmids encoding mutants were generated from pRS3 by QuikChange mutagenesis (Agilent Technologies).
A
uthor Man
uscr
ipt
A
uthor Man
uscr
ipt
A
uthor Man
uscr
ipt
A
uthor Man
uscr
Gateway plasmids containing E. coli cheB (pENTR-b1883) or narL (pENTR-b1221) were kindly provided by Dr. Michael Laub (Massachusetts Institute of Technology).22 For protein expression, the cheB and narL genes were amplified from the pENTR plasmids using standard PCR methods and sub-cloned into pET28a (Novagen) using NheI/BamHI or NdeI/ XhoI sites respectively. Both products encode response regulators with an N-terminal fusion of 20 amino acids that includes a His6 tag and a thrombin cleavage site. The narX sequence corresponding to residues 227 through the C-terminus of NarX (NarX227)23 was cloned from E. coli DH5α genomic DNA, and sub-cloned into the pMal-C2KV/H6 plasmid24 using Xba1 and BamH1 sites. The resulting plasmid encoded a His6-MBP-NarX227 fusion protein. Primers for cloning and mutagenesis are listed in Table S1.
Protein Expression and Purification
CheY variants were expressed and purified using a protocol similar to that previously described.25 Briefly, K0641recA containing pRS3 or variants were grown to an OD600 of 1.0 and induced with 100 mg/L β-indole acrylic acid at 37 °C overnight. Cell lysates in TMG buffer (25 mM Tris, pH 7.5, 5 mM MgCl2, 10% (v/v) glycerol) were purified by dye-affinity chromatography (Affigel-Blue, Bio-Rad) followed by size-exclusion chromatography (Superdex 75, GE). Concentrations were determined spectrophotometrically using an extinction coefficient of 0.727 (mg/mL)−1 cm−1 for wild type CheY and all CheY variants.26
For NarL expression, E. coli BL21(DE3) cells containing pET28a-NarL or variants were grown to OD600 of 1.0 and induced with 1 mM IPTG for 3 hrs at 37 °C. Cell lysates were purified by affinity chromatography using Ni-NTA beads (Qiagen). The resulting N-terminal hexa-histidine tagged proteins were then subjected to ion exchange chromatography (Q-Sepharose, GE, pH 7.5), followed by size-exclusion chromatography (Superdex 75, GE) into NarL storage buffer (20 mM Tris, pH 7.5, 0.5 mM MgCl2, 10% (v/v) glycerol).
Concentrations of NarL and variants were determined spectrophotometrically using an extinction coefficient of 0.292 (mg/mL)−1 cm−1 calculated with protParam.27
Hexa-histidine tagged CheB and variants were expressed and purified in a manner similar to NarL. BL21(DE3) cells containing pET28a-CheB or variants were grown to OD600 of 0.8 and induced with 1 mM IPTG overnight at room temperature. Importantly, 2 mM β -mercaptoethanol was included in both lysis buffer (50 mM Tris, pH 8.0, 300 mM NaCl, 10 mM imidazole, 2 mM β-mercaptoethanol) and elution buffer (lysis buffer with 300 mM imidazole) during Ni-NTA affinity purification to improve protein stability. Promptly after affinity purification, CheB proteins were chromatographed over a Superdex 75 size-exclusion column into CheB storage buffer (10 mM Tris, pH 8.0, 50 mM NaCl, 10% (v/v) glycerol, 20 mM β-mercaptoethanol). CheB protein concentrations were determined using an extinction coefficient of 3.97 (mg/mL)−1 cm−1 estimated by protParam.27 Working stocks of CheB were frozen at −80 °C in CheB storage buffer. For longer term storage, CheB was precipitated in 50% saturated ammonium sulfate and stored at 4 °C.28
His6-MBP-NarX227 was expressed in BL21(DE3) cells containing pMal-C2KV/H6-NarX227 grown to OD600 of 1.0 and induced with 1 mM IPTG for 3 hrs at 37 °C. Cell lysates were purified by affinity chromatography using Ni-NTA beads (Qiagen), followed by size-exclusion chromatography (Superdex 75, GE) into NarX storage buffer (20 mM HEPES, pH
A
uthor Man
uscr
ipt
A
uthor Man
uscr
ipt
A
uthor Man
uscr
ipt
A
uthor Man
uscr
7.0, 200 mM KCl, 1 mM DTT, 5% v/v glycerol). Concentrations of His6-MBP-NarX227 were determined using a calculated extinction coefficient27 of 1.09 (mg/mL)−1 cm−1.
Small Molecule Phosphodonors
The calcium salt of monophosphoimidazole (MPI)29 and the potassium salt of
phosphoramidate (PAM)30 were synthesized as described. The calcium counter ion of the MPI salt, which might affect the observed phosphorylation or dephosphorylation rates,31 was exchanged using the sodium form of Chelex 100 resin. The lithium potassium salt of acetyl phosphate (AcP) was purchased from Sigma.
Autodephosphorylation Assays
The fluorescence and radioactive methods described below both selectively monitor loss of phosphoryl groups from phosphorylated proteins in a first order reaction that is independent of protein concentration. Neither the proportion of the protein population phosphorylated at the start of the experiment nor the fraction of the population that is functional affect measurement of autodephosphorylation rate constants by these methods.
E. coli CheY contains a unique Trp residue at position D+1 in the active site (Figure 1A) that can be used to optically measure reaction kinetics.5 Intrinsic tryptophan fluorescence measurements on CheY and variants were made on a Perkin-Elmer LS-50B
spectrofluorimeter (minimum data interval and response time = 20 ms) using an Applied Photophysics (Surrey, U.K.) RX2000 rapid mixer accessory (dead time = 8 ms) and Perkin-Elmer FL WINLAB V3 software as previously described.32 Excitation and emission wavelengths were set to 295 nm and 346 nm respectively. Samples were maintained at a constant temperature of 25 °C with a circulating water bath.
CheY autodephosphorylation experiments used the pH-jump method.33, 34 CheY and variants were initially autophosphorylated using ~5-times the K1/2 of PAM.33 Equal volumes of CheY-P (10 μM in 10 mM HEPES, pH 7.0, 20 mM MgCl2, and PAM) and pH jump Buffer (200 mM sodium carbonate, pH 10.2) were mixed to effectively stop
autophosphorylation33 and allow direct observation of the subsequent
autodephosphorylation reaction as a restoration of tryptophan fluorescence. The change in fluorescence as a function of time was fit to a first order exponential to determine the rate constant for autodephosphorylation, kdephos. Measurements were made in triplicate.
To measure the autodephosphorylation rate constants of wild type and mutant CheB
proteins, we phosphorylated CheB with [32P]CheA-P and followed the decay of the resulting [32P]CheB. Because the phosphoryl group on CheB-P has a half-life on the order of several seconds35 and CheA has no known phosphatase activity toward response regulators,6 no attempt was made to purify CheB-P away from CheA. Radiolabeled CheA-P was prepared as described previously.33 Prior to the start of the reaction, [32P]CheA was diluted in CheB buffer (35 mM Tris pH 7.0, 35 mM KCl, 3.5 mM MgCl2), and a sample was removed for a zero time point. To initiate the reaction, CheB was added to give final concentrations of 7 μM CheB and 0.35 μM [32P]CheA. Following set incubation times at room temperature, samples were removed into 2x SDS running buffer, resolved on 18% SDS-PAGE gels (Jule), vacuum dried for 90 min at 65 °C, and analyzed using a Storm 860 phosphorimager (GE).
A
uthor Man
uscr
ipt
A
uthor Man
uscr
ipt
A
uthor Man
uscr
ipt
A
uthor Man
uscr
The fraction of [32P]CheB-P remaining as a function of time was fit to a first order exponential decay to calculate kdephos. The results of triplicate experiments were averaged.
The sensor kinase NarX stimulates dephosphorylation of NarL-P,36 so NarX was removed from the reaction before NarL autodephosphorylation rate constants were determined. His6 -MBP-NarX227 was first autophosphorylated as described previously23, 37 and then
immobilized on a 100 μL amylose microspin column. Then 6 μM wild type or position T+1 variant NarL was added to initiate the phosphotransfer. Approximately 10 seconds after addition, NarL was centrifuged through the column. The resulting [32P]NarL-P was passed over a second amylose column to remove contaminating His6-MBP-NarX227. During the phosphotransfer, 1 mM unlabelled ATP and an ATP regeneration system (0.01 units/mL pyruvate kinase and 1 mM phosphoenol pyruvate) were added to keep any residual MBP-NarX227 phosphorylated and thus minimize phosphatase activity toward NarL-P. Following set incubations times at room temperature, samples of NarL were removed into 2x SDS running buffer, resolved on 4–20% SDS-PAGE gels (Jule), vacuum dried for 90 min at 70° C, and quantified using a Storm 860 phosphorimager (GE). The results of triplicate experiments were analyzed as described for CheB.
CheY Autophosphorylation
The approach to equilibrium for autophosphorylation experiments was continuously monitored by following the decrease of CheY intrinsic tryptophan fluorescence. Because increasing ionic strength inhibits CheY autophosphorylation,9, 34 reactions were carried out in 100 mM HEPES, pH 7.0, 10 mM MgCl2, and a concentration of KCl balanced with the concentration of the phosphodonor sufficient to maintain a constant ionic strength of 100 mM for the phosphodonor and KCl together. To initiate the reactions, CheY (5 μM final concentration) was mixed with an equal volume of phosphodonor at four final
concentrations ranging from 5–30 mM PAM (n=3), 5–30 mM AcP (n=2), or 5–30 mM MPI (n=2). For CheY mutants bearing Ser at position T+2, phosphodonor concentrations were 5– 20 mM PAM (n=2) for CheYE89S and CheYA88T/E89S and 25–100 mM PAM (n=2) for CheYA88V/E89S. Analysis of the data and calculation of rate constants are described in the legend to Figure 4.
Partner and Non-Partner Phosphotransfer Assays
For phosphotransfer reactions from sensor kinases to response regulators, sensor kinases were first autophosphorylated for 30 min at room temperature. His6-MBP-NarX227 was incubated in 100 mM HEPES pH 7.0, 50 mM KCl, 5 mM MgCl2, 5 mM MnCl2, 10 mM DTT, 10% (v/v) glycerol), and 30 nM [γ-32P]ATP.23, 37 CheA was incubated in 50 mM Tris pH, 7.5, 50 mM KCl, 5 mM DTT, 10% (v/v) glycerol, and 100 nM [γ-32P]ATP in 300 μM unlabelled ATP.25 Wild type or position T+1 variant response regulators were then added directly to the kinase autophosphorylation reactions to give final concentrations of ~1.3 μM sensor kinase and 6 μM response regulator. At set time points, samples were removed into 2x SDS running buffer, resolved on either 18% or 4–20% SDS-PAGE gels, dried, and visualized with a phosphorimager.
A
uthor Man
uscr
ipt
A
uthor Man
uscr
ipt
A
uthor Man
uscr
ipt
A
uthor Man
uscr
Because phosphotransfer from sensor kinases to partner response regulators is very fast [e.g. a kcat of ~800 s−1 for CheA to CheY34], this manual assay can only detect large effects. Phosphotransfer could be 1,000-times slower than wild type and still be complete by the first timepoint at 10 seconds. Although the phosphotransfer rate cannot be quantified with a manual assay, the qualitative distinctions that can be made are informative. Comparison of phosphotransfer completed within 10 seconds versus 1 hour is a recognized indicator of partner versus non-partner phosphotransfer.22
Crystallization, Data Collection, Structure Determination and Refinement
Crystals of CheY mutant proteins were grown by hanging drop vapor diffusion at room temperature. Prior to crystallization, 20 mM MnCl2, 1 mM BeCl2 and 10 mM NaF were added to CheY (4.8–10.1 mg/mL) in TMG buffer (described above) to form the
CheY•BeF3−•M2+ complex. Initial crystallization hits were found in a screen of ammonium sulfate (1.6–2.6 M) based on previously published crystallization conditions.38
Crystallization buffers and drop ratios were optimized and diffraction quality crystals were found in conditions ranging from 1.6–2.4 M ammonium sulfate, 0–10% (v/v) glycerol, 100 mM Tris, pH 7.5–8.5 with drop ratios of 1:1, 3:1 or 3:2 protein:reservoir. CheY mutants with near wild type kdephos (CheYA88S and CheYA88T) crystallized in the orthorhombic
spacegroup P212121 as seen previously for wild type CheY, whereas CheYA88V (slower kdephos) grew as primitive triclinic crystals. CheYA88M, which displayed an intermediate kdephos, grew in both crystal forms.
Crystals were cryoprotected with glycerol as previously described,38 or by serial transfers through buffers with increasing amounts of glycerol, and flash cooled in liquid nitrogen. X-ray diffraction images were collected at the SERCAT beamlines (22-BM or 22-ID) at APS. Diffraction data were reduced and scaled using HKL2000.39 Initial phases for the CheY mutants were obtained by molecular replacement using PDBid 1fqw40 as a search model. Initial models were improved by iterative rounds of model building in Coot41 and structure refinement with PHENIX.42 Prior to deposition the models were validated using
MolProbity.43 Table 3 contains a summary of diffraction data and refinement statistics.
Both Mn2+ and Mg2+ were present during crystallization. Mg2+ was modeled as the active site metal ion in CheYA88V due to relatively weak electron density, whereas Mn2+ was used in the other three structures based on a reasonable match to experimental electron density. The identity of the metal ion does not appear to affect any conclusions of this study. The metal coordination and active site geometry of Thermotoga maritima CheY are
indistinguishable whether bound to Mn2+ or Mg2+,44 and both ions support autophosphorylation and autodephosphorylation of E. coli/Salmonella CheY.5, 31, 45
RESULTS
Amino Acid Frequency at Position T+1 Varies Between Response Regulator Subfamilies
In addition to a receiver domain, most response regulators contain an output domain(s). Response regulators are conveniently classified on the basis of their output domains16 and receiver and output domains within the same response regulator generally have
co-A
uthor Man
uscr
ipt
A
uthor Man
uscr
ipt
A
uthor Man
uscr
ipt
A
uthor Man
uscr
evolved.15, 46 Our database of receiver domains from all classes indicated that position T+1 is usually occupied by the smallest amino acids (Ala or Gly), which account for 52% and 21% of response regulator sequences respectively. However, some response regulator subfamilies exhibited dramatically different distributions of amino acids at position T+1 (Table 1). For example, CheB response regulators, which are notable for rapid
autodephosphorylation,35, 47 were likely to have a Ser or Thr at position T+1 (89%,
compared to 17% for all response regulators). In contrast, NarL-like response regulators had a preponderance of Val, Ile, or Met residues at the T+1 position (44%, compared to 5% for all response regulators), and exhibit much slower autodephosphorylation.48, 49
Position T+1 Similarly Affects Autodephosphorylation Rate Constants of CheB, CheY, and NarL Response Regulators
To assess how particular amino acids at position T+1 affect response regulator function, we began by determining the autodephosphorylation rate constants for wild type and position T +1 variants of E. coli CheB, CheY, and NarL (Table 2). The fluorescence of a unique Trp residue at CheY position D+1 increases in intensity when the phosphoryl group is lost from the adjacent residue.5, 34 Therefore, Trp fluorescence was used to monitor CheY
autodephosphorylation kinetics (Figure 2A). CheB and NarL do not contain active site Trp residues. Instead, a pulse of radioactive phosphoryl groups was first rapidly transferred from the partner sensor kinase and then autodephosphorylation was measured by loss of 32P from CheB and NarL (Figure 2BC). Our measurements of rate constants for the wild type proteins were similar to previously published values.33, 35, 48 The effects on autodephosphorylation of a particular amino acid at position T+1 were qualitatively similar in all three response regulators tested (Figure 2D). The reaction was fastest with Ser, intermediate with Ala, and slowest with Val. Furthermore, for CheY, where additional mutants were measured, the effects of chemically similar substitutions (Ser vs. Thr and Ile vs. Val) were
indistinguishable. Finally, the autodephosphorylation rate constant for CheY carrying a Met substitution at T+1 was intermediate between the rate constants for CheY with Ala or Ile/ Val.
CheY Crystal Structures Suggest That Residue T+1 Influences Autodephosphorylation Kinetics by Modulating Access to the Active Site
To explore the molecular mechanisms by which residue T+1 influences the rate of
autodephosphorylation, high-resolution crystal structures of CheY mutants carrying Val, Ser, Thr, or Met at position T+1 were determined in the presence of divalent metal ion and BeF3−, a stable phosphoryl group analog whose effects on response regulator structure40, 50 and function51 have been validated. X-ray diffraction and refinement statistics are
summarized in Table 3. The only significant differences between the structures of the CheY mutants and wild type were the additional atoms for the larger amino acids substituted at position T+1. This indicates that replacement of the Ala at T+1 with Val, Ser, Thr, or Met was well tolerated.
During response regulator autodephosphorylation, a water molecule must attack the
phosphorus atom in line with the bond to be broken (Figure 1B).52 This geometric constraint facilitated the modeling of an attacking water molecule into the crystal structures of wild
A
uthor Man
uscr
ipt
A
uthor Man
uscr
ipt
A
uthor Man
uscr
ipt
A
uthor Man
uscr
type and mutant CheY proteins complexed with BeF3− (Figure 3). These models allowed for analysis of interactions between the residue at T+1 and the modeled attacking water, and revealed that CheY mutants with slower autodephosphorylation kinetics had more occluded active sites.
Wild type CheY (PDBid 1fqw) with a docked attacking water displayed limited interaction between the water and the Ala at position T+1 (Figure 3A). In contrast, in the CheYA88V model, the Cγ2 methyl of the β-branched Val at position T+1 partially overlapped with a modeled attacking water molecule (Figure 3B). Partial occlusion of the attacking water would be expected to impede the dephosphorylation reaction and is consistent with the observed decrease in rate constant compared to wild type CheY (Table 2).
In the CheYA88S and CheYA88T structures, the Ser and Thr sidechains at position T+1 both adopted a rotameric conformation similar to that of Val88 in CheYA88V. However, the chemical difference between methyl (Val) and hydroxyl (Ser/Thr) means that the modeled steric overlaps are not disfavored. Instead the overlaps indicate potential hydrogen-bonding interactions between Ser/Thr at position T+1 and a water molecule poised for the
dephosphorylation reaction (Figure 3C), consistent with a modest increase in the rate constants of autodephosphorylation for the A88S and A88T mutants compared to wild type CheY (Table 2).
In the CheYA88M structure, the Met at position T+1 adopted two different rotameric conformations. In one protomer, the active site was “closed”, with the Met residue rotated over the site of phosphorylation (Figure 3D) such that it would partially occlude an attacking water molecule. In the second crystallographic protomer (Figure 3E), the active site was “open” with the Met at T+1 rotated away from the active site in a rotamer that would make minimal van der Waals (VDW) contacts with an attacking water molecule. Thus, even though Met is large, the flexibility of the sidechain allows for two distinct atomic arrangements of the active site. The “open” arrangement is permissive for entry of an attacking water molecule, whereas the “closed” arrangement occludes access to the Asp phosphorylation site. The modest reduction in autodephosphorylation rate for the Met mutant compared to wild type (Table 2) is consistent with a model in which a fraction of the CheYA88M molecules at any time are in a conformation permissive for phospho-chemistry.
Interestingly, in all of the CheY T+1 mutant structures except the “open” conformation of CheYA88M, two other variable active site residues (D+2 and T+2) interacted with one another (Figure 3), and the Asn at D+2 was poised to potentially interact with an attacking water (Figure 1B). However, the conformation of D+2 did not correlate with
autodephosphorylation kinetics and the functional significance of this observation remains to be established.
In summary, the autodephosphorylation rate constants of CheY mutants bearing
substitutions at position T+1 (Table 2) correlate with the accessibility of water molecules to the path for an inline attack on the P-O bond, as revealed in the crystal structures (Figure 3). This supports the suggestion by Volz that the high frequency of small amino acids at T+1 reflects the need for access to the phosphorylation site.53
A
uthor Man
uscr
ipt
A
uthor Man
uscr
ipt
A
uthor Man
uscr
ipt
A
uthor Man
uscr
Residue T+1 Affects Phosphodonor Specificity and Forms Part of the CheY Binding Pocket for Small Molecule Phosphodonors
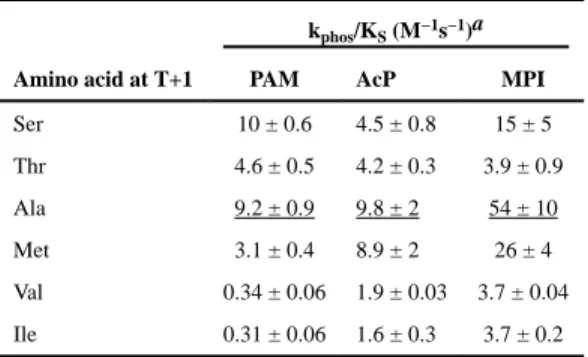
Autophosphorylation of CheY has been thoroughly characterized,9, 26, 34 whereas
autophosphorylation of CheB and NarL have not. Therefore, we focused on CheY to assess the influence of position T+1 on autophosphorylation. Three small molecule phosphodonors were tested. Monophosphoimidazole (MPI) is a close mimic of the phosphohistidine side chains found in sensor kinases and histidine-containing phosphotransfer (Hpt) proteins, the predominant phosphodonors for response regulators in vivo. Phosphoramidate (PAM) is the smallest possible phosphodonor that can supply the P-N bond cleaved during
phosphorylation with phosphohistidine and thus represents the most fundamental properties of the reaction. Acetyl phosphate (AcP) is a metabolite that can serve as a phosphodonor for many but not all response regulators in vivo.54 AcP differs from MPI and PAM in that a P-O bond is cleaved during phosphorylation with AcP. Raw data for autophosphorylation of CheY variants with PAM is shown in Figure 4, and rate constants for all phosphodonors are summarized in Table 4. Each phosphodonor gave a distinct pattern of autophosphorylation kinetics, suggesting differential interactions between phosphodonors and position T+1 sidechains.
To examine possible causes for differing autophosphorylation efficiencies of PAM, AcP, and MPI, each of the three phosphodonors were modeled into each of the CheY mutant
structures. The most illustrative models placed the phosphodonors into the CheYA88T structure and are presented in Figure 5. Although structures containing BeF3− reflect the end rather than the beginning of the autophosphorylation reaction, phosphomimic structures were chosen in preference to unphosphorylated structures because the BeF3− structures are in the active conformation that is optimal for catalysis.32, 45, 55 Furthermore, as noted in the Discussion, the kinetic data suggest that adoption of the active conformation precedes phosphodonor binding. Initial docking of each phosphodonor was accomplished by aligning the oxygen atoms of the phosphoryl group with the fluorine atoms of the bound BeF3−, after which the BeF3− was removed from the structure. The rotatable dihedral angles of the phosphodonors were then adjusted manually to give the best fit.
The Effects of Position T+1 on the Kinetics of CheY Autophosphorylation with PAM Parallel Effects on Autodephosphorylation
In each of the CheYA88T models, the Thr side chain at position T+1 interacts with the phosphodonor around the distal end of the scissile bond. For the PAM model (Figure 5A), the amino group of PAM lies in essentially the same position that the attacking water molecule would adopt in the autodephosphorylation reaction and forms a hydrogen bond with the T+1 Thr. The similar locations of the modeled water and the amine of PAM in each of the CheY mutant structures are consistent with the observation that the position T+1 substitutions have generally similar effects on autodephosphorylation (Table 2) and autophosphorylation with PAM (Table 4). In particular, substitution of either Val or Ile at position T+1 resulted in ~30-fold decreased rate constants for autophosphorylation with PAM or autodephosphorylation with water relative to wild type CheY, whereas introduction of Met diminished PAM autophosphorylation and water-mediated autodephosphorylation about threefold. A different steric explanation for the failure of Ser or Thr at position T+1 to
A
uthor Man
uscr
ipt
A
uthor Man
uscr
ipt
A
uthor Man
uscr
ipt
A
uthor Man
uscr
enhance autodephosphorylation with PAM in spite of modeled hydrogen bond formation is described in the Discussion. In summary, for reaction with both PAM and water, the dominant effect of the amino acid at position T+1 may be access of the small molecule to a specific location in the response regulator active site.
Position T+1 Has Little Effect on CheY Autophosphorylation with AcP
Although AcP is a larger molecule than PAM, the distal end of the ester linkage fills a smaller volume than the corresponding amine from PAM. Therefore, VDW contacts between the docked AcP and the Thr at position T+1 were limited (Figure 5B). Modeling of AcP into the other CheY position T+1 mutants similarly revealed relatively few interactions between the phosphodonor and CheY compared to PAM or MPI. The limited interactions in the modeled structures are consistent with the relatively narrow (six-fold) range in AcP autophosphorylation rate constants measured across the position T+1 mutants (Table 4).
β-branched Amino Acids at Position T+1 Impede CheY Autophosphorylation with MPI MPI contains a rigid imidazole ring and despite retaining rotational freedom around the scissile bond could not be docked to CheYA88T in a conformation that would not clash with the Thr at position T+1 (Figure 5C). Similarly, Ile or Val at T+1 also clash with a modeled MPI, suggesting some rearrangement of the active site would be necessary for the MPI phosphodonor to reach the Asp57 site of phosphorylation in mutants containing these β -branched residues. In contrast, the Ala residue at position T+1 in wild type CheY does not clash with a docked MPI, and non-clashing rotamers of Ser and Met exist. Thus, a consistent correlation emerged between the analysis of MPI docking and the rate constants for
autophosphorylation with MPI (Table 4). The amino acids at T+1 that facilitate access of MPI to the active site support autophosphorylation, whereas the β-branched amino acids that interfere with access impede autophosphorylation.
Combined Effects of Positions T+1 and T+2
The results reported in Tables 2 and 4 demonstrate that the amino acid at position T+1 affected both autodephosphorylation and autophosphorylation. It is well established that the amino acids at positions D+2 and T+2 also affect the same reactions,3, 38, 56 so it is possible that the particular amino acids at D+2, T+1, and T+2 mutually affect their net influence. A thorough examination of the combined effects of these three variable active site positions is outside the scope of this study, but exploratory experiments were of interest. The Asn/Ser pair of amino acids found at D+2/T+2 in NarL was chosen for investigation because it is both relatively abundant in wild type response regulators (seventh out of 400 possible combinations) and associated with an unusual distribution of amino acids at position T+1. Compared to all receiver domains, those containing Asn at D+2 and Ser at T+2 are enriched at position T+1 for the usually infrequent amino acids Thr (43% when D+2/T+2 is Asn/Ser vs. 7% in all), Ser (22% vs. 10%), and Val (9% vs. 2%); as well as depleted for the usually common amino acids Ala (8% vs. 53%) and Gly (7% vs. 22%). The effects of Thr or Val at T+1 on CheY autocatalytic reactions were qualitatively similar in the context of Asn at D+2 and Ser at T+2 (Table 5) to those observed in the Asn/Glu D+2/T+2 context of wild type CheY (Tables 2 and 4). Compared to Ala at T+1, Thr enhanced autodephosphorylation and diminished autophosphorylation with PAM, whereas Val diminished rate constants for both
A
uthor Man
uscr
ipt
A
uthor Man
uscr
ipt
A
uthor Man
uscr
ipt
A
uthor Man
uscr
reactions. However, the impact of Val at T+1 was quantitatively different in the context of different T+2 residues. The implications of these differences are considered in the Discussion.
Position T+1 Influences Phosphotransfer Between Partner and Non-partner Sensor Kinases and Response Regulators
To ensure signaling fidelity, the interactions between response regulators and their protein partners are highly specific.4, 57 Residues directly at the interface between a response regulator and its partner protein would be predicted to be the most likely to elicit changes in specificity or reaction kinetics. The T+1 position of the response regulator is at the protein-protein interface in reported structures of complexes between response regulators and sensor kinases,58–60 Hpts,61–63 or phosphatases.64–66 To test if response regulator position T+1 influences phosphorylation from sensor kinases, partner and non-partner phosphotransfer reactions were performed using either CheA (the partner kinase for CheB and CheY) or a well-characterized soluble construct (MBP-NarX227)23 of NarX (the partner kinase for NarL) in all possible combinations with the set of 12 wild type and mutant CheB, CheY, or NarL response regulators used in this study. Results are summarized in Table 6.
Efficient partner phosphotransfer was observed in 10 of 12 cases (CheB, Figure 2B; CheY, Figure 6C; NarL, Figure 6A). Only transfer from CheA to CheBS84V (Figure 2B) and from MBP-NarX227 to NarLV88S (not shown) was inefficient. In both cases, diminished
phosphotransfer was observed to the response regulator mutant bearing at position T+1 the amino acid within the test set that was most different from the wild type residue (Ser vs. Val).
The amino acid at position T+1 had a more noticeable impact on phosphotransfer between non-partner proteins (Table 6). In the five cases where non-partner phosphotransfer cross-talk was observed, the amino acid at position T+1 in the non-partner was similar to the T+1 residue in the wild type partner response regulator. In a single time point experiment (Figure 6A), MBP-NarX227 served as a phosphodonor for wild type CheY (Ala at T+1) and mutants bearing the hydrophobic amino acids Ile, Met, or Val, but did not appear to donate
phosphoryl groups to CheY mutants containing the hydrophilic amino acids Ser or Thr. In the reciprocal combination, weak phosphotransfer from CheA to NarLV88S was observed (Figure 6D), but CheA did not act as a phosphodonor for wild type NarL (Figure 6CD) or NarLV88A (Figure 6C).
To verify that the apparent absence of phosphorylated CheYA88S or CheYA88T was due to lack of phosphotransfer from MBP-NarX227 rather than rapid autodephosphorylation, a time course experiment was performed (Figure 6B). Phosphorylation of CheYA88S and
CheYA88T was not observed at any time point. Furthermore, phosphorylated MBP-NarX227 did not decrease over the entire time course, in contrast to the four CheY variants for which phosphotransfer was observed. We therefore conclude that MBP-NarX227 did not
phosphotransfer to CheYA88S or CheY88T. CheB autodephosphorylates even more rapidly than CheY. However, analogous single time point and time course experiments showed that MBP-NarX227 did not phosphotransfer to wild type CheB, CheBS84A, or CheBS84V (neither decrease of phosphorylated MBP-NarX227 nor phosphorylated CheB were
A
uthor Man
uscr
ipt
A
uthor Man
uscr
ipt
A
uthor Man
uscr
ipt
A
uthor Man
uscr
observed), but did transfer to wild type NarL in a positive control reaction (data not shown). Finally, because NarL autodephosphorylates more slowly than CheY, the failure to observe NarL-P or a decrease in CheA-P under conditions that generated CheY-P from CheA-P (Figure 6C) is strong evidence that CheA does not phosphotransfer to wild type NarL or NarLV88A.
DISCUSSION
Position T+1 Effects on Response Regulator Autodephosphorylation can be Grouped
Combining the data reported here (Tables 2 & 5, Figure 3) with available structures and previously published biochemical results suggests that consideration of the potential steric interactions involving position T+1 can be used to sort the amino acids into four groups with distinct effects on the response regulator autodephosphorylation reaction as described from fastest to slowest below:
i. Residues that can hydrogen bond with the attacking water molecule, i.e. the small polar residues Ser (Figure 3C) and Thr, correlate with enhanced autodephosphorylation. Ser and/or Thr substitutions at position T+1 in CheY, NarL, and DosR67 supported faster autodephosphorylation than wild type. Conversely, removing the Ser from wild type CheB diminished the autodephosphorylation rate constant. Looking more broadly, the response regulators with the fastest known autodephosphorylation rate constants (CheB or CheY proteins)3, 47 are substantially enriched for Ser and Thr at position T+1 (Table 1). Furthermore, the greater Ser/Thr enrichment in CheB (89%) compared to CheY (32%) is consistent with autodephosphorylation being the primary known route of phosphoryl group loss in vivo for CheB. In contrast, the dephosphorylation rates of many CheY proteins are further stimulated by CheZ or CheC/CheX/FliY phosphatases.
Structures have been reported of six activated wild type response
regulators containing a Ser (PDBids 4if4, 4nic) or Thr (1k68, 3h1e, 4e7p, 4ldz/4le0) at position T+1. In four cases, the Ser/Thr residue is
appropriately positioned to interact with a nucleophilic water molecule. In one case (4e7p), the Thr adopts different conformations in the two protomers of the asymmetric unit - one is positioned to participate in the reaction and the other is not. In the last case (4ldz/4le0), the Thr is out of position. Thus, wild type Ser and Thr residues at position T+1 can and frequently do adopt a conformation that could enhance
autodephosphorylation.
ii. Residues that minimally interact with the attacking water, including Ala (Figure 3A) and presumably Gly, neither accelerate nor impede
autodephosphorylation. Ala and Gly residues account for the majority of response regulator sequences. There are 12 X-ray crystal structures of activated wild type response regulators or receiver domains with an Ala at position T+1 (1fqw, 1nxt/2a9r, 1qmp, 1zes, 1zh4, 2a9o, 2pl1, 2v0n, 3gl9,
A
uthor Man
uscr
ipt
A
uthor Man
uscr
ipt
A
uthor Man
uscr
ipt
A
uthor Man
uscr
3nnn, 3w9s, 4hns) and seven with a Gly (1d5w, 1l5y, 1xhf, 1zy2, 2vui, 3crn, 3rqi). Ala or Gly at position T+1 would not occlude the path of a water molecule making an in-line attack on the phosphorus (beryllium) atom in any of the examined structures.
iii. Residues that can adopt multiple conformations modestly impede autodephosphorylation. The Met in CheY (Figure 3DE), which exhibited side-chain conformations that either partially occluded or minimally interfered with a modeled attacking water molecule, resulted in a modestly diminished autodephosphorylation rate constant. Similarly, replacement of the Gly at position T+1 with a Glu in Sinorhizobium meliloti FixJ reduces the autodephosphorylation rate constant by about one-third.68 “Open” and “closed” conformations analogous to those seen with Met in CheY were observed for the Leu at position T+1 in the structure (3nns) of Thermatoga maritima DrrB.55
iv. Residues that partially occlude the attacking water molecule, such as the
β-branched amino acids Val (Figure 3B) and Ile, resulted in distinct decreases in autodephosphorylation rate constants in CheY and CheB (Tables 2 & 5). Conversely, removing the Val from wild type NarL enhanced the autodephosphorylation rate constant, in agreement with Huynh et al.69
Response Regulator Structural Activation May Precede Phosphodonor Binding
Response regulators undergo a structural rearrangement that facilitates phosphochemistry and switches the signaling state. While it is commonly held that catalysis of
autophosphorylation is preceded by structural activation, the temporal sequence of phosphodonor binding and structural activation is still unclear. If phosphodonor binding is coincident with or requires pre-rearrangement of the β4α4 loop into the active
conformation,32, 45, 55 then position T+1 forms one surface of a small phosphodonor binding pocket. On the other hand, if phosphodonor binding occurs before structural activation, then position T+1 would not necessarily be part of the binding pocket. Intriguingly, the
CheYA88S and CheYA88T mutants may help distinguish between these two autophosphorylation models.
In the model where CheY is in the active conformation optimal for phosphorylation prior to phosphodonor binding, a Thr and to a lesser extent a Ser at position T+1 would partially occlude docking of PAM (Figure S1), which would approach with the large phosphoryl group first. In contrast, if the active conformation were adopted after phosphodonor binding, then the modeled hydrogen bond between Ser/Thr at position T+1 and the amine of PAM (Figure 5A) would be expected to enhance the rate of autophosphorylation similar to the rate enhancement seen during autodephosphorylation with CheB, CheY, or NarL proteins carrying Ser/Thr at T+1 (Table 2, Figure 3B). The observation that Ser and especially the larger Thr do not accelerate CheY autophosphorylation with PAM (Tables 4 & 5) is consistent with structural activation preceding or being coincident with phosphodonor docking, and autophosphorylation catalysis requiring prior structural activation.32, 45, 55
A
uthor Man
uscr
ipt
A
uthor Man
uscr
ipt
A
uthor Man
uscr
ipt
A
uthor Man
uscr
Influence of Position T+1 in the Context of Different Active Sites
The response regulator active site contains variable positions in addition to T+1, most notably D+2 and T+2 (Figure 1). Nevertheless, the effects of various amino acids at T+1 on autodephosphorylation (Table 2) are qualitatively similar in the context of three response regulators that contain different pairs of amino acids at D+2/T+2. The effects of different amino acids at T+1 on CheY autodephosphorylation and autophosphorylation with PAM are also qualitatively similar in the context of two different T+2 residues (Tables 2, 4, & 5). The latter data allow a quantitative analysis of the effects of individual and combined
substitutions at positions T+1 and T+2. In particular, the activation energy of a reaction is given by ΔG‡ = −RT ln(k), so the difference in activation energies between two proteins (e.g. mutant and wild type) is given by ΔΔG‡ = −RT ln(k1) − [−RT ln(k2)] = −RT ln(k1/k2). Comparing the logarithms of the ratios of rate constants for single and double mutants to wild type (quantities that are proportional to ΔΔG‡) provides insight into whether
substitutions at multiple positions exert their influence independently or collectively.70 For both CheY autodephosphorylation and autophosphorylation with PAM, the effects of combining a Thr substitution at position T+1 with a Ser substitution at position T+2 was similar to (within less than a factor of two) the sum of the individual substitutions (Figure 7, left). In these cases, the additivity of effects suggests each substitution exerted its influence on the reaction independently of the other. For example, replacing Ala at T+1 with Thr appears to diminish autophosphorylation with PAM through steric hindrance as described in the previous section. Replacing Glu at T+2 with Ser would eliminate a methylene group and thus reduce hydrophobic surface area, which in turn should diminish autophosphorylation with PAM.56
In contrast, the effects of combining a Val substitution at T+1 with a Ser substitution at T+2 were less than half the sums of effects of individual substitutions, and indeed less than the effects of the T+1 substitution alone (Figure 7, right). These antagonistic relationships indicate that the two substitutions counteracted the influence of one another on the reactions. A simple steric interpretation of the observed antagonism is that changing the Ala at T+1 to Val substantially decreases access to the phosphorylation site, whereas replacing Glu at T+2 with the smaller Ser might slightly increase access.
Synergistic interactions are inferred when a double mutant exhibits a greater effect than the sum of effects of single substitutions. Synergistic effects on CheY autodephosphorylation have been observed between some pairs of amino acids at positions D+2 and T+2.3 A much larger data set will be required to ascertain whether or not position T+1 can act
synergistically with either position D+2 or T+2, as well as whether the additive and antagonistic interactions between T+1 and T+2 described above are typical.
Receiver Domain Position T+1 is at the Interface with Partner Proteins
Although position T+1 is at the protein-protein interface in complexes of response regulators in complex with their partner sensor kinases,58–60 Hpt proteins,61–63 or phosphatases,64–66 there is little previous evidence of a role for T+1 in the interaction. Position T+1 was identified as a potential specificity determinant in one analysis of evolutionary covariation of residues between partner sensor kinases and response regulators,71 but did not reach the
A
uthor Man
uscr
ipt
A
uthor Man
uscr
ipt
A
uthor Man
uscr
ipt
A
uthor Man
uscr
covariation threshold in an earlier study using a different algorithm.72 Furthermore, altering residues other than T+1 is sufficient to rewire phosphotransfer specificity such that the modified response regulator gains the ability to interact with a non-partner sensor kinase and loses the ability to interact with a partner sensor kinase.58, 71, 73
Our systematic analysis revealed that substitutions at position T+1 affected interaction of response regulators with partner proteins, either diminishing phosphotransfer from a partner sensor kinase or facilitating cross-talk with a non-partner kinase (Table 6). For example, the addition of a single atom at position T+1 (the Ser hydroxyl oxygen of CheYA88S versus the Ala hydrogen of wild type CheY) was sufficient to change the interaction such that CheY no longer could accept a phosphoryl group from MBP-NarX227 (Figure 6AB). Furthermore, there is precedence for modulation of signal fidelity by position T+1 for FixL/FixJ68 and NarX/NarL69 as described in the next section.
Sensor kinases can be grouped into multiple phylogenetic classes,74 with the major group represented by the Pfam designation HisKA. CheA and NarX represent relatively minor classes of sensor kinases (containing Hpt and HisKA_3 phosphorylation domains respectively). Furthermore, CheA kinases have a distinct architecture in which the phosphorylation site is provided by a Hpt domain far from the ATP-binding and catalysis domain.75 Some CheAs also contain a P2 domain to which the CheB and CheY response regulators bind. Therefore, the extent to which the effect of position T+1 on phosphotransfer observed with CheA and NarX can be generalized to other types of sensor kinases is not clear.
Phosphotransfer from sensor kinases to response regulators is a multifaceted reaction, and we do not know which step(s) is affected by position T+1. The face of CheY that binds to CheA P2 is distinct from the CheY active site,76 so it seems unlikely that the substitutions at T+1 affect binding to P2. This expectation is supported by the observation that the
qualitative trends for effect of amino acid at position T+1 on phosphotransfer (Table 6) are similar for CheB, CheY, and NarL, regardless of whether the kinase is CheA (has P2 domain) or NarX (no P2 domain). The location of position T+1 in close proximity to the receiver domain phosphorylation site suggests instead that amino acids at T+1 could affect steric access of the kinase phospho-His sidechain to the response regulator active site, binding of the response regulator to the sensor kinase, or orientation of the two proteins with respect to one another.
Phenotypes of T+1 Mutants
Although the results described here suggest it may be possible to successfully predict the qualitative impact of amino acid substitutions at position T+1 on response regulator autophosphorylation and autodephosphorylation kinetics, prediction of in vivo phenotypes of cells containing such mutants is problematic. T+1 substitutions clearly affect multiple response regulator functions, and it is not obvious a priori which effect might be dominant. However, we are aware of three cases in which genetic screens for constitutive gain of function mutants identified substitutions at T+1. Consideration of these mutants and the mechanisms underlying their activity is illuminating.
A
uthor Man
uscr
ipt
A
uthor Man
uscr
ipt
A
uthor Man
uscr
ipt
A
uthor Man
uscr
Egan and Stewart isolated NarLV88A as a constitutive mutant active in the absence of the NarX partner sensor kinase.77 They hypothesized that the enhanced in vivo activity of NarLV88A could be the result of either increased phosphorylation or decreased
dephosphorylation. Our results (Table 2) and those of the Stewart laboratory69 concerning the relative impact of Ala and Val on response regulator autodephosphorylation are inconsistent with diminished autodephosphorylation as an explanation for the phenotype. Our results with CheY (Tables 4 & 5) predict that NarLV88A should have enhanced autophosphorylation activity compared to wild type NarL. However, the phenotype of cells expressing NarLV88A does not depend on the small molecule phosphodonors acetyl phosphate or carbamoyl phosphate, and instead is due to reduced sensitivity to the phosphatase activity of NarX.69
The S. meliloti response regulator mutant FixJG83E exhibits diminished phosphotransfer from the FixL sensor kinase, reduced autodephosphorylation activity (as would be predicted from our results, with a long, flexible Glu in the same functional category as Met), and lessened sensitivity to FixL phosphatase activity in comparison to wild type FixJ.68
Presumably, the constitutive activity of cells expressing FixJG83E arises from a net increase in phosphorylation in which slower dephosphorylation outweighs slower phosphorylation.
Finally, replacing the Ala at T+1 in Bacillus subtilis Spo0A with Val results in constitutive activity in vivo.78 In vivo activity of Spo0AA87V depends on the presence of the Spo0F and Spo0B proteins, which are upstream of Spo0A in a phosphorelay. Therefore, a plausible interpretation of these observations in light of our results is that the Val substitution results in decreased dephosphorylation and hence a net increase in phosphorylation of Spo0AA87V compared to wild type Spo0A. However, experiments would be required to determine whether the Val substitution reduces other potential routes of phosphoryl group loss from Spo0A (reverse phosphotransfer from Spo0A to Spo0B and/or phosphatase-mediated dephosphorylation of Spo0A) in addition to the predicted decrease in autodephosphorylation of Spo0A.
Position T+1 Controls Access to the Response Regulator Phosphorylation Site Modulating Phosphochemistry and Two-Component Signaling
Two-component systems are a striking example of biological variation on a theme. Despite highly conserved structures, catalytic mechanism, and active site geometry, small variations allow multiple two-component systems to operate in the same cell at a variety of time scales and without deleterious cross-talk. Our results explored one functional determinant of two-component system variation and confirm the proposal53 that the residue at position T+1 affects access to the response regulator active site. Improved access (T+1 = Ala or presumably Gly) enhanced both autophosphorylation and autodephosphorylation, whereas impeded access (T+1 = Val or Ile) diminished both autophosphorylation and
autodephosphorylation reactions. We also established two additional classes of residues at T +1. Met (and presumably other flexible amino acids) can get out of the way and hence only modestly affected access and kinetic rates. Ser or Thr at position T+1 can hydrogen bond with an attacking water molecule and likely enhanced autodephosphorylation. Although similar hydrogen bond interactions can be modeled between Ser/Thr at T+1 and
A
uthor Man
uscr
ipt
A
uthor Man
uscr
ipt
A
uthor Man
uscr
ipt
A
uthor Man
uscr
phosphodonors, the failure of Ser/Thr to enhance autophosphorylation suggests that phosphodonor binding occurs after conformational activation, and these residues impede phosphodonor approach. Further experiments will be necessary to determine the extent to which the influence of position T+1 is affected by neighboring variable active site residues. However, the biased distribution of amino acids found at position T+1 in different response regulator subfamilies correlates with autodephosphorylation rate constants and suggests T+1 is functionally important. We showed that T+1 affects the fidelity and kinetics of
phosphotransfer from sensor kinases. Each demonstrated role for the residue at T+1: access to the active site, modulation of autophosphorylation and autodephosphorylation kinetics, partner protein interactions, and fidelity of sensor kinase phosphorylation and
dephosphorylation, are part of the answer to how a myriad of two-component systems can operate simultaneously and successfully in the same organism.
Supplementary Material
Refer to Web version on PubMed Central for supplementary material.
Acknowledgments
Funding Source
National Institutes of Health grant R01 GM050860 to R.B.B supported this work.
We thank Chris Noriega, Hsia-Yin Lin and Valley Stewart for sharing unpublished data and advice on the NarX and NarL assays; Michael Laub for providing pENTR plasmids encoding CheB and NarL; Markus Obrist for advice with the radioactive assays and providing the pMal-C2KV/H6 plasmid; Ed Collins, Amy Wollish, and Peter Miller for initial experimental work on CheY position T+1 mutants; Rachel Creager-Allen for subcloning cheB into pET28a; Stephani Page for constructing the CheYE89S mutant; and Cameron Worden for constructing the CheYA88V/E89S and CheYA88T/E89S mutants and performing initial experiments.
ABBREVIATIONS
AcP acetyl phosphate
MPI monophosphoimidazole
Hpt histidine-containing phosphotransfer protein
PAM phosphoramidate
T+1 variable amino acid one residue C-terminal to conserved Thr/Ser in receiver domain active site
VDW van der Waals
References
1. Wuichet K, Cantwell BJ, Zhulin IB. Evolution and phyletic distribution of two-component signal transduction systems. Curr Opin Microbiol. 2010; 13:219–225. [PubMed: 20133179]
2. Capra EJ, Laub MT. Evolution of two-component signal transduction systems. Annu Rev Microbiol. 2012; 66:325–347. [PubMed: 22746333]
3. Thomas SA, Brewster JA, Bourret RB. Two variable active site residues modulate response regulator phosphoryl group stability. Mol Microbiol. 2008; 69:453–465. [PubMed: 18557815]
A
uthor Man
uscr
ipt
A
uthor Man
uscr
ipt
A
uthor Man
uscr
ipt
A
uthor Man
uscr
4. Podgornaia AI, Laub MT. Determinants of specificity in two-component signal transduction. Curr Opin Microbiol. 2013; 16:156–162. [PubMed: 23352354]
5. Lukat GS, McCleary WR, Stock AM, Stock JB. Phosphorylation of bacterial response regulator proteins by low molecular weight phospho-donors. Proc Natl Acad Sci U S A. 1992; 89:718–722. [PubMed: 1731345]
6. Hess JF, Bourret RB, Oosawa K, Matsumura P, Simon MI. Protein phosphorylation and bacterial chemotaxis. Cold Spring Harb Symp Quant Biol. 1988; 53(Pt 1):41–48. [PubMed: 3076085] 7. Keener J, Kustu S. Protein kinase and phosphoprotein phosphatase activities of nitrogen regulatory
proteins NTRB and NTRC of enteric bacteria: roles of the conserved amino-terminal domain of NTRC. Proc Natl Acad Sci U S A. 1988; 85:4976–4980. [PubMed: 2839825]
8. Casino P, Rubio V, Marina A. The mechanism of signal transduction by two-component systems. Curr Opin Struct Biol. 2010; 20:763–771. [PubMed: 20951027]
9. Da Re SS, Deville-Bonne D, Tolstykh T, Veron M, Stock JB. Kinetics of CheY phosphorylation by small molecule phosphodonors. FEBS Lett. 1999; 457:323–326. [PubMed: 10471801]
10. Huynh TN, Stewart V. Negative control in two-component signal transduction by transmitter phosphatase activity. Mol Microbiol. 2011; 82:275–286. [PubMed: 21895797]
11. Pioszak AA, Ninfa AJ. Mutations altering the N-terminal receiver domain of NRI (NtrC) that prevent dephosphorylation by the NRII-PII complex in Escherichia coli. J Bacteriol. 2004; 186:5730–5740. [PubMed: 15317778]
12. Silversmith RE. Auxiliary phosphatases in two-component signal transduction. Curr Opin Microbiol. 2010; 13:177–183. [PubMed: 20133180]
13. Ulrich LE, Zhulin IB. The MiST2 database: a comprehensive genomics resource on microbial signal transduction. Nucleic Acids Res. 2010; 38:D401–407. [PubMed: 19900966]
14. Finn RD, Mistry J, Tate J, Coggill P, Heger A, Pollington JE, Gavin OL, Gunasekaran P, Ceric G, Forslund K, Holm L, Sonnhammer EL, Eddy SR, Bateman A. The Pfam protein families database. Nucleic Acids Res. 2010; 38:D211–222. [PubMed: 19920124]
15. Pao GM, Saier MH Jr. Response regulators of bacterial signal transduction systems: selective domain shuffling during evolution. J Mol Evol. 1995; 40:136–154. [PubMed: 7699720]
16. Galperin MY. Diversity of structure and function of response regulator output domains. Curr Opin Microbiol. 2010; 13:150–159. [PubMed: 20226724]
17. Corpet F. Multiple sequence alignment with hierarchical clustering. Nucleic Acids Res. 1988; 16:10881–10890. [PubMed: 2849754]
18. Bourret RB, Hess JF, Simon MI. Conserved aspartate residues and phosphorylation in signal transduction by the chemotaxis protein CheY. Proc Natl Acad Sci U S A. 1990; 87:41–45. [PubMed: 2404281]
19. Silversmith RE. High mobility of carboxyl-terminal region of bacterial chemotaxis phosphatase CheZ is diminished upon binding divalent cation or CheY-P substrate. Biochemistry. 2005; 44:7768–7776. [PubMed: 15909991]
20. Bourret RB, Drake SK, Chervitz SA, Simon MI, Falke JJ. Activation of the phosphosignaling protein CheY. II. Analysis of activated mutants by 19F NMR and protein engineering. J Biol Chem. 1993; 268:13089–13096. [PubMed: 8514750]
21. Smith JG, Latiolais JA, Guanga GP, Pennington JD, Silversmith RE, Bourret RB. A search for amino acid substitutions that universally activate response regulators. Mol Microbiol. 2004; 51:887–901. [PubMed: 14731287]
22. Skerker JM, Prasol MS, Perchuk BS, Biondi EG, Laub MT. Two-component signal transduction pathways regulating growth and cell cycle progression in a bacterium: a system-level analysis. PLoS Biol. 2005; 3:e334. [PubMed: 16176121]
23. Noriega CE, Lin HY, Chen LL, Williams SB, Stewart V. Asymmetric cross-regulation between the nitrate-responsive NarX-NarL and NarQ-NarP two-component regulatory systems from
Escherichia coli K-12. Mol Microbiol. 2010; 75:394–412. [PubMed: 19968795]
24. Stefanova ME, Tomberg J, Olesky M, Holtje JV, Gutheil WG, Nicholas RA. Neisseria gonorrhoeae
penicillin-binding protein 3 exhibits exceptionally high carboxypeptidase and beta-lactam binding activities. Biochemistry. 2003; 42:14614–14625. [PubMed: 14661974]
A
uthor Man
uscr
ipt
A
uthor Man
uscr
ipt
A
uthor Man
uscr
ipt
A
uthor Man
uscr
25. Hess JF, Bourret RB, Simon MI. Phosphorylation assays for proteins of the two-component regulatory system controlling chemotaxis in Escherichia coli. Methods Enzymol. 1991; 200:188– 204. [PubMed: 1956317]
26. Silversmith RE, Appleby JL, Bourret RB. Catalytic mechanism of phosphorylation and dephosphorylation of CheY: kinetic characterization of imidazole phosphates as phosphodonors and the role of acid catalysis. Biochemistry. 1997; 36:14965–14974. [PubMed: 9398221] 27. Gasteiger, E.; Hoogland, C.; Gattiker, A.; Duvaud, S.; Wilkins, MR.; Appel, RD.; Bairoch, A.
Protein identification and analysis tools on the ExPASy server. Humana Press; 2005.
28. Djordjevic S, Goudreau PN, Xu Q, Stock AM, West AH. Structural basis for methylesterase CheB regulation by a phosphorylation-activated domain. Proc Natl Acad Sci U S A. 1998; 95:1381– 1386. [PubMed: 9465023]
29. Rathlev T, Rosenberg T. Non-enzymic formation and rupture of phosphorus to nitrogen linkages in phosphoramido derivatives. Arch Biochem Biophys. 1956; 65:319–339. [PubMed: 13373428] 30. Sheridan RC Jr, McCullough JF, Wakefield ZT. Phosphoramidic acid and its salts. Inorg Synth.
1972; 13:23–26.
31. Lukat GS, Stock AM, Stock JB. Divalent metal ion binding to the CheY protein and its significance to phosphotransfer in bacterial chemotaxis. Biochemistry. 1990; 29:5436–5442. [PubMed: 2201404]
32. Schuster M, Silversmith RE, Bourret RB. Conformational coupling in the chemotaxis response regulator CheY. Proc Natl Acad Sci U S A. 2001; 98:6003–6008. [PubMed: 11353835]
33. Bourret RB, Thomas SA, Page SC, Creager-Allen RL, Moore AM, Silversmith RE. Measurement of response regulator autodephosphorylation rates spanning six orders of magnitude. Methods Enzymol. 2010; 471:89–114. [PubMed: 20946844]
34. Mayover TL, Halkides CJ, Stewart RC. Kinetic characterization of CheY phosphorylation reactions: comparison of P-CheA and small-molecule phosphodonors. Biochemistry. 1999; 38:2259–2271. [PubMed: 10029518]
35. Stewart RC. Activating and inhibitory mutations in the regulatory domain of CheB, the
methylesterase in bacterial chemotaxis. J Biol Chem. 1993; 268:1921–1930. [PubMed: 8420965] 36. Schroder I, Wolin CD, Cavicchioli R, Gunsalus RP. Phosphorylation and dephosphorylation of the
NarQ, NarX, and NarL proteins of the nitrate-dependent two-component regulatory system of
Escherichia coli. J Bacteriol. 1994; 176:4985–4992. [PubMed: 8051011] 37. Noriega CE, Schmidt R, Gray MJ, Chen LL, Stewart V. Autophosphorylation and
dephosphorylation by soluble forms of the nitrate-responsive sensors NarX and NarQ from
Escherichia coli K-12. J Bacteriol. 2008; 190:3869–3876. [PubMed: 18375557]
38. Pazy Y, Wollish AC, Thomas SA, Miller PJ, Collins EJ, Bourret RB, Silversmith RE. Matching biochemical reaction kinetics to the timescales of life: structural determinants that influence the autodephosphorylation rate of response regulator proteins. J Mol Biol. 2009; 392:1205–1220. [PubMed: 19646451]
39. Otwinowski Z, Minor W. Processing of X-ray diffraction data collected in oscillation mode. Methods Enzymol. 1997; 276:307–326.
40. Lee SY, Cho HS, Pelton JG, Yan D, Berry EA, Wemmer DE. Crystal structure of activated CheY. Comparison with other activated receiver domains. J Biol Chem. 2001; 276:16425–16431. [PubMed: 11279165]
41. Emsley P, Cowtan K. Coot: model-building tools for molecular graphics. Acta Crystallogr D Biol Crystallogr. 2004; 60:2126–2132. [PubMed: 15572765]
42. Adams PD, Afonine PV, Bunkoczi G, Chen VB, Davis IW, Echols N, Headd JJ, Hung LW, Kapral GJ, Grosse-Kunstleve RW, McCoy AJ, Moriarty NW, Oeffner R, Read RJ, Richardson DC, Richardson JS, Terwilliger TC, Zwart PH. PHENIX: a comprehensive Python-based system for macromolecular structure solution. Acta Crystallogr D Biol Crystallogr. 2010; 66:213–221. [PubMed: 20124702]
43. Chen VB, Arendall WB 3rd, Headd JJ, Keedy DA, Immormino RM, Kapral GJ, Murray LW, Richardson JS, Richardson DC. MolProbity: all-atom structure validation for macromolecular crystallography. Acta Crystallogr D Biol Crystallogr. 2010; 66:12–21. [PubMed: 20057044]