LONG WAVELENGTH FLUORESCENT REPORTERS FOR PROTEIN KINASES AND DESIGN OF LIGHT-ACTIVATABLE BIOAGENTS
Luong Tien Nguyen
A dissertation submitted to the faculty at the University of North Carolina at Chapel Hill in partial fulfillment of the requirements for the degree of Doctor of Philosophy in the
UNC Eshelman School of Pharmacy
(Division of Chemical Biology and Medicinal Chemistry)
Chapel Hill 2014
ABSTRACT
LUONG TIEN NGUYEN: Long Wavelength Fluorescent Reporters for Protein Kinases and Design of Light-Activatable Bioagents
(Under the direction of David S. Lawrence)
The first part of this dissertation describes the development of wavelength-tunable fluorescent reporters for monitoring protein kinase activity. The probing wavelength is preprogrammed by using a variety fluorophores which are commercially available. Specifically, we develop fluorescent sensors sensing in the far-red and near-IR region and use them to monitor endogenous cAMP-dependent protein kinase activity in erythrocyte lysates and in erythrocytes. Stabilization of the peptide sensor in erythrocyte lysate is also reported. The study provides powerful tools to investigate the roles of protein kinase A activity in erythrocyte biochemistry, for example, in Plasmodium Falciparum infection and propagation.
Additionally, the use of erythrocytes as carriers and protectors of photoactivatable peptide therapeutics is also discussed. The study is aim to develop a way to controllably deliver active therapeutics to a specific region of the body to increase their potency and reduce their toxicity.
This work is dedicated to my daughter, Trang Phuong Nguyen, and my wife, Bong Nguyen, for all the time being here with me. We have such a memorable time here at
ACKNOWLEDGEMENTS
I would like express the deepest appreciation to my advisor, Dr. David Lawrence, for his guidance, patience, and insightful discussions about research during my time here in the group. I want to thank my committee members, Dr. Christopher E. Sims, Dr. Leslie Parise, Dr. Michael B. Jarstfer, and Dr. Qisheng Zhang for supporting me during the training and for advice regarding future career. I am also very grateful to Dr. Nancy Allbritton for her insightful comments and support during the past few years.
I especially would like to thank Dr. Melanie Priestman for the help with microscopy, for all supporting arguments, and helping me with the dissertation writing. I want to thanks Nathan Oien for the PKA project. I greatly appreciate Dr. Qunzhao Wang for his help regarding peptide chemistry and instrumentation. I also would like to thank Collin O’Banion for his assistance (together with Dr. Qunzhao Wang) in continuing the unfinished project and for helping me with the dissertation writing. I am so fortunate to have many colleagues who help me tremendously when I am in the laboratory. I would like to thanks Weston Smith for helping me with the writing and for all the discussion we have. I greatly appreciate Dr. Hsien-ming Lee, Dr. Vyas Sharma, Dr Finith Jernigan, Dr. Jennifer Shell, Dr. Thomas Shell, Dr. Robert Hughes, Nathan Oien, and Zach Rodgers for helping me during the progression of my research projects.
There are numerous people I would like to thank for helping me during my five-year here at Chapel Hill, but after days of focusing on writing this dissertation, lots of the neurons involving in name memory have lost contact with each other or died.
I also thank Vietnam Education Foundation (VEF) for encouraging and giving me the opportunity to come here to pursue the graduate program and experience American culture. I would like to thank NIH for funding my research.
PREFACE
Chapter 2 represents work done by myself and work done in collaboration with Nathan Oien. All experiments with erythrocytes in Chapter 2 were done in collaboration with Nathan Oien. The work has been published before writing this dissertation with the following citation:
Oien, N. P.; Nguyen, L. T.; Jernigan, F. E.; Priestman, M. A.; Lawrence, D. S., Long-wavelength fluorescent reporters for monitoring protein kinase activity. Angew Chem Int Ed Engl 2014, 53 (15), 3975-8.
Chapter 3 describes unpublished research that was designed and performed by myself.
Chapter 4 describes work performed by myself under the direction of Dr. David Lawrence and Dr. Nancy Allbritton and in collaboration with Nathan Oien. The work has been published previous to writing this dissertation with the following citation:
Nguyen, L. T.; Oien, N. P.; Allbritton, N. L.; Lawrence, D. S., Lipid Pools As Photolabile “Protecting Groups”: Design of Light-Activatable Bioagents. Angew Chem Int Ed Engl 2013, 52 (38), 9936-9939.
Chapter 5 describes unpublished work that has been done in collaboration with Dr. Melanie Priestman, Dr. Qunzhao Wang, and Collin O’Banion.
TABLE OF CONTENTS
LIST OF TABLES ... xiv
LIST OF FIGURES ... xv
LIST OF SCHEMES ... xxi
CHAPTER 1: BACKGROUND AND SIGNIFICANCE ... 1
Fluorescence Techniques and the Optical Windows of Tissue... 1
Fluorescence Techniques ... 1
Optical Windows of Tissue ... 3
Protein Kinase and Protein Kinase Activity Probes ... 4
Protein Kinases ... 4
Spatiotemporal Control and the Creation of Light-Activatable Bioagents ... 12
CHAPTER 2: LONG-WAVELENGTH FLUORESCENT REPORTERS FOR PROTEIN KINASES ... 20
Results and Discussion ... 21
Design and Synthesis ... 21
Fluorescent Fold Change and Fluorescent Recovery ... 30
Peptide Quencher Binding Investigation ... 31
Initial Phosphorylation Rate and Kinase Inhibitor IC50 Determination ... 33
Effect of High Salt Concentration on the Fluorescence Response ... 34
Light-Activation and Monitoring PKA Activity in Erythrocytes ... 42
Conclusion ... 43
Materials and Method ... 45
Syntheses ... 46
Purification and LC-MS Characterization ... 49
Fluorescence Measurements ... 50
Screening of the Dye Library ... 50
Comparison of Kinase Reporter Assay Using Various Salt Concentrations ... 50
Job Plots ... 51
Dynamic Light Scattering ... 51
Initial Phosphorylation Rates of Reporter/Quencher Pairs ... 51
Initial Phosphorylation Rate Determined by Capillary Electrophoresis ... 52
PKA Activity in Erythrocyte Lysate ... 52
Fluorescence Signal Loss Study due to Erythrocyte Lysate ... 52
Photoactivation of DMNB-bearing Sensor ... 53
Kinase Reporter Loading into Erythrocytes ... 53
Confocal Microscopy ... 54
CHAPTER 3: PEPTIDE STABILIZATION AND IN-CELL-LYSATE KINASE ASSAY BASED ON PHOSPHORYLATION-INDUCE PEPTIDE DEGRADATION ... 55
Results and Discussion ... 56
Protection Peptide 5Tam-Aoc-GRTGRRFYS-amide from Trypsinolysis by Evans Blue ... 56
Trypsinolysis of 5Tam-Aoc-GRTGRRFSY-amide and its phosphorylated peptide in the presence of Evans blue ... 58 Screening for Quenchers Which Protect the Peptide but not
Stability of 5Tam-peptide in Erythrocyte Lysate in the
Presence and Absence of Quenchers as Assessed by LC-MS ... 60
Phosphorylation-Induced Degradation of the Peptide in the Presence of Quencher as Assessed by LC-MS ... 64
Conclusion ... 67
Materials and Method ... 68
Peptide Synthesis and Purification ... 68
LC-MS Analysis ... 68
Protection Peptide 5Tam-Aoc-GRTGRRFYS-amide from Trypsinolysis by Evans Blue ... 68
Trypsinolysis of 5Tam-Aoc-GRTGRRFSY-amide and Its Phosphorylated Counterpart in the Presence of Evans Blue ... 68
Degradation Screening with Erythrocyte Lysate (Primary Screening) ... 69
Screening the phosphorylation in erythrocyte lysate (Secondary Screening) ... 70
Confirmation of Peptide Stabilization by Quencher in Erythrocyte Lysate by LC-MS ... 70
Confirmation the Phosphorylation-Induced Degradation of the Peptide in the Presence of Quencher by LC-MS ... 71
CHAPTER 4: MEMBRANE SEQUESTRATION AND THE DESIGN OF LIGHT-ACTIVATABLE BIOAGENTS ... 72
Hypothesis ... 73
Results and Discussion ... 73
Design of Photolabile Lipid Anchor ... 73
Study of a Lipidated Fluorophore ... 74
Lipidated Peptides and Cellular Uptake Studies with HeLa Cells
... 96
Peptide Deliver Using Doubly Labeled Transmembrane Helical Peptides... 98
Conclusion ... 101
Materials and Method ... 103
Purifications ... 103
Fluorescence Assays ... 103
Capillary Electrophoresis... 103
Octanol - Water Partition Studies ... 104
Studies with Mitochondria ... 105
Studies of C12-bn-PKA with Liposomes ... 107
Studies with Erythrocyte Ghosts ... 108
Determination of Peptide Concentration in Supernatants ... 109
Studies with Erythrocyte Lysates ... 109
Confocal Microscopy ... 110
Loading of C18-bn-K(5Tam) and C18-bn-K(Tam)--K(Fam) into erythrocytes ... 110
Loading of C18-bn-K(Tam)--K(Fam) into erythrocytes with protease inhibitors ... 111
Syntheses ... 111
CHAPTER 5: ERYTHROCYTES AS CARRIERS FOR LIGHT-ACTIVATABLE THERAPEUTICS ... 127
Results and Discussion ... 128
Studies of CP-nb-Stear ... 128
Study with Phospholipid-Conjugated Peptide ... 131
Materials and Method ... 140
Loading Lipidated Peptides on Hemoglobin-Free Erythrocytes ... 140
Stability of 5Tam-Aoc-GRTGRRFSY-amide in the Presence of Human Plasma and Erythrocytes ... 141
Degradation of 5Tam-Aoc-GRTGRRFSY-amide by Trypsin and Chymotrypsin ... 141
Proteolytic Stability of CP-nb-Dipal in the Presence of Membrane ... 141
Study of α-MSH and 5Fam-labelled α-MSH with PRCP ... 142
Study of MSH-nb-Dipal with Chymotrypsin in the Presence of Erythrocytes ... 143
Study of MSH-nb-Dipal with Trypsin in the Presence of Erythrocytes ... 143
Study of MSH-nb-Dipal with Plasmin in the Presence of Erythrocytes ... 144
Confocal Microscopy Study of Hemoglobin-Free Erythrocytes Loaded with CP-nb-Dipal and HeLa Cells with and without Photolysis ... 144
Syntheses ... 145
SUMMARY ... 152
LIST OF TABLES
Table 2.1: Peptide ESI+ mass data. ... 24 Table 2.2: Dye library. ... 25 Table 2.3: The PKA-catalyzed fluorescence increase of the
fluorophore-substituted peptides in buffer. ... 26 Table 2.4: Initial phosphorylation rate of various peptide/dye quencher
pairs. ... 35 Table 2.5: Effect of salt on the fluorescence response upon
phosphorylation. ... 36 Table 2.6: Effect of salt on the fluorescence response upon
LIST OF FIGURES
Figure 1.1: Plot of fluorophore brightness (ε x φ) vs the wavelength of maximum absorption (λmax) for the major classes of
fluorophores. ... 2 Figure 1.2: Absorbance of various tissue and blood components from
200 nm to 10 µm. ... 4 Figure 1.3: General design of FRET-based protein kinase sensors. ... 6 Figure 1.4: Structure of a PKC fluorescent sensor based on chelation
induced fluorescence change. ... 8 Figure 1.5: General design of Sox kinase sensors developed by Imperiali
and coworkers. ... 8 Figure 1.6: PKC fluorescent sensor developed by Lawrence and
coworkers. ... 9 Figure 1.7: An alternative design of kinase fluorescent sensor based on
an environmentally sensitive fluorophore. ... 9 Figure 1.8: Tyrosine kinase fluorescent sensor based on a
phosphorylation induced fluorescence dequenching
mechanism developed by Lawrence and coworkers. ... 10 Figure 1.9: General design of “Deep Quench” kinase sensor developed
by Lawrence and colleagues. ... 11 Figure 1.10: Structures of light-activatable ATP, glutamate,
acetylcholine analog, and serotonin. ... 14 Figure 1.11: Structures of photoactivatable estradiol and
photoactivatable β-ecdysone. ... 14 Figure 1.12: Light-mediated calcium release designed by Tsien et al. ... 15 Figure 1.13: Light-mediated calcium release designed by Ellis-Davies
and Kaplan. ... 15 Figure 1.14: Structure of light-activatable phosphopeptide designed by
Figure 1.17: General design, synthesis, and photoactivation of RNA
reported by Ando and coworkers. ... 19
Figure 2.1: Relative wavelength absorbances of erythrocyte lysate and fluorophore-Aoc-GRTGRRFSY-amide peptides. ... 20
Figure 2.2: General strategy for the protein kinase catalyzed dequenching of fluorescent kinase substrates. ... 22
Figure 2.3: Structures and excitation - emission wavelengths of fluorophores. ... 23
Figure 2.4: PKA-catalyzed fluorescence dequenching ... 27
Figure 2.5: PKA-catalyzed fluorescence dequenching (continued). ... 28
Figure 2.6: PKA catalyzed fluorescence dequenching (continued). ... 29
Figure 2.7: Dependence of fluorescence fold change and fluorescence recovery on the concentration of quencher ... 30
Figure 2.8: Job plot of complex formation of 5Tam-KRRRLASLAA-amide with acid blue 80, 5Tamra-Aoc-GRTGRRFSY-amide with Acid Blue 80, and 5Tam-Aoc-GRTGRRFSY with Evans Blue. ... 32
Figure 2.9: Dynamic light scattering analysis did not reveal detectable aggregate formation. ... 33
Figure 2.10: IC50 curve of H9 and H89 toward PKA. ... 35
Figure 2.11: Relative fluorescence of 5Fam-, 5Tam-, and Atto633 - labeled petides (1μM) in the presence of PBS 1X, 10% erythrocyte lysate, and 100% erythrocyte lysate. ... 37
Figure 2.12: Reaction progress curve of the PKA-catalyzed phosphorylation of fluorophore-Aoc-GRTGRRFSY-amide (1 µM) with Evans Blue (2 µM) in 100% erythrocyte lysates. ... 38
Figure 2.13: Quenching of Atto633-Aoc-GRTGRRFSY (1 μM) fluorescence by Acid Blue 80 and Evans Blue in the presence of 10% erythrocyte lysate. ... 38
Figure 2.14: Erythrocyte PKA activity in erythrocyte lysates. ... 39
Figure 2.15: Photolysis of Atto633-Aoc-GRTGRRFS(DMNB)Y-amide ... 41
Figure 2.17: Confocal images of
Atto633-Aoc-GRTGRRFS(DMNB)Y-amide loaded erythrocyteswith and without photolysis. ... 43
Figure 3.1: General strategy for the stabilization and phosphorylation induced peptide degradation leading to dequenching of
fluorescent kinase substrates. ... 57 Figure 3.2: Protection of 5Tam-Aoc-GRTGRRFSY-amide 2.5 µM and 30
µM from trypsinolysis by Evans Blue. ... 58 Figure 3.3: Degradation of 5Tam-Aoc-GRTGRRFSY-amide and its
phosphorylated counterpart by trypsin in the presence of
Evans Blue. ... 59 Figure 3.4: Degradation difference of phosphorylated and
unphosphorylated peptides in erythrocyte lysate in the
presence of quenchers... 61 Figure 3.5: Fluorescence increase induced by
phosphorylation-degradation in erythrocyte lysate in the presence of
quenchers. ... 62 Figure 3.6: Degradation of 5Tam-Aoc-GRTGRRFSY-amide in erythrocyte
lysate in the absence and presence of Acid Green 27. ... 63 Figure 3.7: Protection of 5Tam-Aoc-GRTGRRFSY-amide against
proteolysis in erythrocyte lysate by quenchers. ... 64 Figure 3.8: Phosphorylation-induced degradation of
5Tam-Aoc-GRTGRRFSY-amide in the presence of quencher in
erythrocyte lysate. ... 65 Figure 3.9: Phosphorylation-induced degradation of
5Tam-Aoc-GRTGRRFSY-amide in the presence of quencher in
erythrocyte lysate. ... 66 Figure 4.1: General strategy for lipid pool-anchored light-activatable
bioagents. ... 73 Figure 4.2: Structure of the photolabile lipid linker C18-bn-COOH. ... 74 Figure 4.3: Structure of the photolabile lipidated fluorophore
C18-bn-K(5Tam) and its photolyzed product Suc-C18-bn-K(5Tam). ... 74
Figure 4.6: Mitochondria stained with C18-bn-K(5Tam) prior to and
after loading of C18-bn-K(5Tam). ... 76 Figure 4.7: Confocal microscopy of erythrocyte ghosts loaded
C18-bn-K(5Tam) with and without photolysis. ... 77
Figure 4.8: Structure of the photolabile lipidated protease sensor C18-bn-K(Tam)--K(Fam), the corresponding light-activated membrane-released derivative Suc-K(Tam)--K(Fam), and a
control non-lipidated sensor Ac-K(Tam)--K(Fam). ... 78 Figure 4.9: Fluorescence response from trypsin digestion of
Ac-K(Tam)--K(Fam). ... 79
Figure 4.10: LC-MS of C18-bn-K(Tam)--K(Fam) before and after
photolysis. ... 80 Figure 4.11: Trypsin cleavage of C18-bn-K(Tam)--K(Fam) distributed in
octanol and water with and without photolysis as assessed
by fluorescence. ... 81 Figure 4.12: Mitochondria prior to and after loaded with
C18-bn-K(Tam)--K(Fam). ... 81
Figure 4.13: Trypsin cleavage of C18-bn-K(Tam)--K(Fam) loaded on mitochondria with and without photolysis as assessed by
fluorescence. ... 81 Figure 4.14: a) Trypsin cleavage of C18-bn-K(Tam)--K(Fam) loaded onto
mitochondria in the absence and presence of illumination
as assessed by fluorescence. ... 82 Figure 4.15: Erythrocyte ghosts prior to and after loaded with
C18-bn-K(Tam)--K(Fam). ... 83
Figure 4.16: Distribution of C18-bn-K(Tam)--K(Fam) in aqueous phase
in the presence of erythrocyte ghosts. ... 83 Figure 4.17: Trypsin cleavage of C18-bn-K(Tam)--K(Fam) loaded on
erythrocyte ghosts with and without photolysis as assessed
by fluorescence. ... 84 Figure 4.18: C18-bn-K(Tam)--K(Fam) with erythrocyte ghosts and
trypsin in the presence and absence of photolysis. ... 84 Figure 4.19: LC-MS analysis of Ac-K(Tam)--K(Fam) before and after
Figure 4.21: Studies of erythrocytes loaded with C18-bn-K(Tam)--K(Fam) with and without photolysis as assessed by confocal
microscopy. ... 88 Figure 4.22: The structure of lipidated trypsin sensor
5Tam-K(Chol)-nb-R-AMC and its photolyzed product. ... 89
Figure 4.23: LC-MS trace of 5Tam-K(Chol)-nb-R-AMC before and after
photolysis. ... 90 Figure 4.24: Study of 5Tam-K(Chol)-nb-R-AMC with trypsin and
erythrocyte ghosts. ... 91 Figure 4.25: The structure of lipidated PKA sensor C12-bn-PKA and its
photolyzed product, Suc-PKA. ... 92 Figure 4.26: Study of lipidated PKA sensor with mitochondria and PKA. ... 93 Figure 4.27: Structures of 5Tam-EEK(Chol)-nb-R-AMC,
5Tam-EEK(Stear)-nb-R-AMC, and 5Tam-K(Stear)-nb-R-AMC. ... 94
Figure 4.28: Binding of 5Tam-K(Chol)-nb-R-AMC, 5Tam-EEK(Chol)-nb-R-AMC, 5Tam-K(Stear)-nb-R-AMC, and
5Tam-EEK(Stear)-nb-R-AMC to erythrocyte ghosts. ... 95
Figure 4.29: Phosphorylation of C12-bn-PKA by PKA in the presence and absence of liposomes as assessed by capillary
electrophoresis. ... 95 Figure 4.30: Structure of lipidated fluorescent peptide
C18-bn-K(5Tam)RRRLAALAA-amide. ... 96
Figure 4.31: Confocal images of HeLa cells treated with C18-bn-K(5Tam)RRRLAALAA-amide at 4 oC with and without
photolysis. ... 97 Figure 4.32: Confocal images of HeLa cells treated with
C18-bn-K(5Tam)RRRLAALAA-amide and chloroquine at 37 oC with
P-Figure 5.1: General strategy of delivery peptide drug using erythrocytes
as carriers. ... 128 Figure 5.2: Structures of cell-permeable peptide
5Tam-Aoc-GRTGRRFSY-amide and its photolabile lipidated
counterpart. ... 129 Figure 5.3: LC-MS analysis of CP-nb-Stear before and after photolysis. ... 130 Figure 5.4: Degradation of 5Tam-Aoc-GRTGRRFSY-amide (red) and
CP-nb-Stear in human plasma (5%) in the presence of
erythrocytes as assessed by LC-MS. ... 131 Figure 5.5: Transfer of erythrocyte-bound CP-nb-Stear to HeLa cells
upon incubation in the absence of UV light. ... 131 Figure 5.6: General strategy of synthesis phospholipid-conjugate
peptide. ... 132 Figure 5.7: Photolysis of CP-nb-Dipal as assessed by LC-MS. ... 133 Figure 5.8: Study of hemoglobin-free erythrocytes loaded with
CP-nb-Dipal and HeLa cells with and without photolysis. ... 134
Figure 5.9: Degradation of 5Tam-Aoc-GRTGRRFSY-amide and CP-nb-Dipal by chymotrypsin and trypsin in the presence of
hemoglobin-free erythrocytes. ... 135 Figure 5.10: Photolysis of MSH-nb-Dipal as assessed by LC-MS. ... 137 Figure 5.11: Stability of 5Fam-labelled and native α-MSH toward PRCP
degradation as analyzed by LC-MS. ... 138 Figure 5.12: Degradation of MSH-nb-Dipal by trypsin, chymotrypsin,
LIST OF SCHEMES
Scheme 2.1: Synthesis of Fmoc-L-Ser(DMNB)-OH. ... 46
Scheme 4.1: Synthesis of lipidated photolabile linker C18-bn-COOH. ... 111
Scheme 4.2: Synthesis of C18-bn-K(5Tam). ... 113
Scheme 4.3: Synthesis of protease fluorescent substrates Ac-K(Tam)--K(Fam) and C18-bn-K(Tam)--Ac-K(Tam)--K(Fam). ... 115
Scheme 4.4: Synthesis of Fmoc-K(Chol)-OH. ... 116
Scheme 4.5: Synthesis of NH2-R(pbf)-AMC. ... 117
Scheme 4.6: Synthesis of 5Tam-K(Chol)-nb-R-AMC. ... 118
Scheme 4.7: Synthesis of 5Tam-K(Stear)-nb-R-AMC. ... 121
Scheme 4.8: Synthesis of C12-bn-PKA. ... 122
Scheme 4.9: Synthesis of Mal-anp-K(5Tam)RRRLAALAA-amide. ... 124
Scheme 4.10: Synthesis of P-H1-P and P-H2-P. ... 126
Scheme 5.1: Synthesis of CP-nb-Stear. ... 145
Scheme 5.2: Synthesis of Dipal-Mal. ... 146
Scheme 5.3: Synthesis of CP-nb-Dipal. ... 147
Scheme 5.4: Synthesis of MSH-nb-Dipal. ... 149
LIST OF ABBREVIATIONS
5Fam 5-carboxyfluorescein
5Tam 5-carboxytetramethylrhodamine
5Fam-α-MSH-amide See structure in page 151
5Fam-α-MSH-nb-Cys-amide See structure in page 150
MSH-nb-Dipal See structure in page 138
5Tam-Aoc-GRTGRRFSY-amide See structure in page 130
CP-nb-Cys See structure in page 148
CP-nb-Stear See structure in page 130
CP-nb-Dipal See structure in page 134
5Tam-EEK(Chol)-nb-R-AMC See structure in page 95 5Tam-EEK(Stear)-nb-R-AMC See structure in page 95 5Tam-K(Chol)-nb-R-AMC See structure in page 119 5Tam-K(Stear)-nb-R-AMC See structure in page 95, 122
Abl An tyrosine kinase in human encoded
by ABL gene
Akt a.k.a. PKB Protein kinase B
anp
3-(fmoc-amino)-3-(2-nitrophenyl)propanoic acid
Aoc 8-amino octanoyl linker
ATP Adenosine triphosphate
Atto633-Aoc-GRTGRRFS(DMNB)Y-amide See structure in page 42
C12-bn-COOH See structure in page 123
C12-bn-PKA See structure in page 123
C18-bn-COOH See structure in page 112
C18-bn-K(5Tam) See structure in page 114
C18-bn-K(5Tam)--K(5Fam) See structure in page 116 C8-K(5Tam)-α-MSH-nb-Cys-amide See structure in page 151 C8-K(5Tam)-α-MSH-nb-Dipal See structure in page 151
cAMP Cyclic adenosine monophosphate
cAMP Cyclic adenosine monophosphate
CE Capillary electrophoresis
CE-LIF Capillary electrophoresis with laser
induced fluorescence detection
Cys-Hex1-Cys See structure in page 126
Cys-Hex2-Cys See structure in page 126
Dap 2,3-diaminopropionic acid
DIC N,N′-diisopropylcarbodiimide
Dipal-Mal See structure in page 147
DIPEA N,N-diisopropylethylamine
DMNB 4,5-dimethoxy-2-nitrobenzyl
DNA Deoxyribonucleic acid
EGFR Epidermal growth factor receptor
ERK Extracellular signal-regulated kinase
FBS Fetal bovine serum
Fmoc Fluorenylmethyloxycarbonyl
Fmoc-anp-OH See structure in page 125
Fmoc-L-Ser(DMNB)-OH See structure in page 47
Fmoc-nb-COOH See structure in page 112
FRET Fluorescence Resonance Energy
Transfer
GFP Green fluorescent protein
HCTU
O-(6-chlorobenzotriazol-1-yl)-N,N,N′,N′-tetramethyluronium hexafluorophosphate
HOBt 1-hydroxybenzotriazole
HPLC High performance chromatography
ivDde
1-(4,4-dimethyl-2,6-dioxocyclohex-1-ylidene)-3-methylbutyl
JNK C-Jun N-terminal kinase
Lck A tyrosine kinase, a member of Src
LC-MS Liquid chromatography with mass
detection
Mal-anp-K(5Tam)RRRLAALAA-amide See structure in page 127 min minute(s)
Mtt 4-methyltrityl
p38α P38 mitogen-activated protein kinase
alpha
PBS Phosphate buffered saline
P-H1-P See structure in page 127
P-H2-P See structure in page 127
Pim A group of serine/threonine kinases
PKA cAMP-dependent protein kinase
PKC Protein kinase C
RSK Ribosomal S6 kinase
S6K p70 ribosomal S6 kinase
SDS Sodium dodecyl sulfate
sec second(s)
SH1 Src homology 1
SH2 Src homology 2
Src A tyrosine kinase
CHAPTER 1: BACKGROUND AND SIGNIFICANCE
Fluorescence Techniques and the Optical Windows of Tissue
Fluorescence Techniques
Since first reported by Sir John Herschel in 1845 and named by Sir George Stockes in 1852, fluorescence has now become a powerful tool in biomedical research.1, 2 The techniques provide excellent sensitivity as well as a continuous and nondestructive detection with a high degree of spatial and temporal resolution when applied in living systems.
Fi gure 1.1: P lot of f lu o ro phore br ight nes s ( ε x φ ) v s t h e wa velen gt h of max imu m ab so rp ti on ( λma x ) for the m ajo r c lasse
s of fluoro
phores. The co lo r of the struc ture indicates it s wa velengt h of m aximum emis sion ( λem ). For clarity, only t h e fluorophoric mo ie ty of s o me m o lec u les is s h own. R e pr in ted w ith p e rm issi o n fro m Lav is, L. D .; R aines, R . T. , B right id ea s fo r chem ical bi o lo gy . ACS Che m B iol 2008, 3 (3) , 142-55 .
© 2008 Amer
ican Chem
ical
S
o
Based on those fluorescent molecules, scientists have developed numerous applications including in, but not limited to, cell and organelle staining, molecular dynamic and function sensing, gene expression reporting, enzymatic activity measurements, disease markers, tumor surgery, etc.3, 11-17
Optical Windows of Tissue
Protein Kinase and Protein Kinase Activity Probes
Protein Kinases
Protein kinases are enzymes that catalyze the transfer of the γ-phosphoryl group from ATP to specific sites in proteins in a process called phosphorylation. In eukaryotes, these sites are usually the free hydroxyl groups of serine, threonine, and tyrosine residues in proteins. It has been estimated that about 500 genes in human genome encode for protein kinases and up to 30% of all cellular proteins contain a phosphate group. Protein kinases are involved in every basic cellular process, including metabolism, growth, division, differentiation, motility, cellular transport. Numerous studies suggest the roles of protein kinases in many human diseases such as cancer, inflammatory diseases, neurological disorders, etc.23-26. Protein kinases are currently a major drug target.
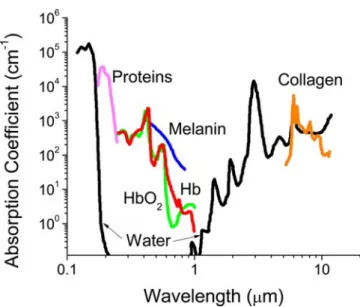
Figure 1.2: Absorbance of various tissue and blood components from 200 nm to 10 µm.
Given the important role of protein kinases in human diseases, it is crucial to be able to monitor the activity of a kinase of interest. To date, a number of protein kinase sensors have been developed. The majority of them are fluorescent sensors and can be categorized into two major classes: genetically encoded protein based sensors and small molecule peptide-based sensors.27
Protein-Based Kinase Probes
The majority of the protein-based kinase probes function through phosphorylation induced conformational change leading to Fluorescence Resonance Energy Transfer (FRET). Basically, the probes contain a donor fluorescent domain, an acceptor fluorescent domain, and a domain of which conformation is phosphorylation sensitive. The donor/acceptor pair are selected so that the emission spectrum of the donor domain sufficiently overlaps with the excitation spectrum of the acceptor. When phosphorylation occurs, the relative orientation between the two are altered, which leads to the change in the excitation-emission profile of the pair (Figure 1.3).28 This type of sensors have been developed for variety of kinases, such as PKA, Akt, RSK, S6K, ERK, JNK, EGFR/Abl, to name a few .27, 29
bleed-through and limited options of FRET fluorescent protein pairs also lead to difficulties when designing and using FRET-based kinase sensors.
Figure 1.3: General design of FRET-based protein kinase sensors. Once phosphorylated by a kinase of interest, the phosphopeptide binding domain forms an intramolecular complex with the phosphopeptide, giving rise to a distance change between the two flanking fluorescent proteins that alters the FRET.
Reprinted with permission from Ting, A. Y.; Kain, K. H.; Klemke, R. L.; Tsien, R. Y., Genetically encoded fluorescent reporters of protein tyrosine kinase activities in living cells. Proc Natl Acad Sci U S A 2001, 98 (26), 15003-8. Copyright (2001) National Academy of Sciences, U.S.A.
Peptide-Based Kinase Probes
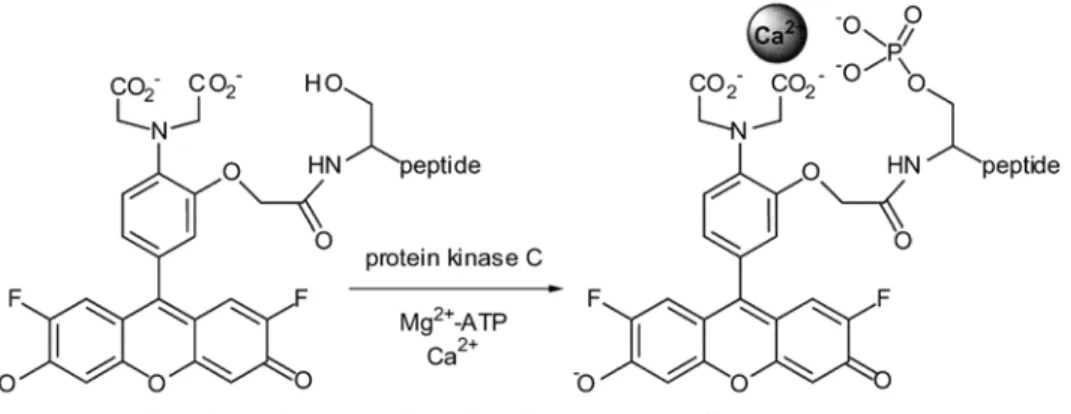
Lawrence and colleagues were the first created a peptide sensor for protein kinases based on chelation induced fluorescence increase. Specifically, the probe contains a peptide substrate for PKC to which is appended a fluorophore bearing two carboxylate groups. Phosphorylation of the peptide substrate generates a M2+ binding site which consists of the newly introduced phosphate group and the two carboxylate moieties from the fluorophore. The fluorescence signal is gained from phosphorylation followed by divalent cation coordination (Figure 1.4).30
An analogous approach was exploited by Imperiali and co-workers to develop kinase sensors based on the chelation of 8-hydroxy-5-(N,N-dimethylsulfonamido)-2-methylquinoline (Sox) moiety and phosphate group to Mg2+ (Figure 1.5).31 The probes comprise a Sox moiety appended to an optimized peptide substrate for the target kinase. Upon phosphorylation and in the presence of Mg2+, the Sox and phosphate groups coordinate the divalent magnesium ions leading to fluorescence enhancement. Employing this strategy, Imperiali and colleagues have developed sensors targeting a number of kinases such as Akt, Abl, ERK1/2, PKA, PKC, p38α, Pim, etc.32, 33
Figure 1.4: Structure of a PKC fluorescent sensor based on chelation induced fluorescence change.
Reprinted with permission from Chen, C. A.; Yeh, R. H.; Lawrence, D. S., Design and synthesis of a fluorescent reporter of protein kinase activity. J Am Chem Soc 2002, 124 (15), 3840-1. Copyright (2002) American Chemical Society.
Figure 1.5: General design of Sox kinase sensors developed by Imperiali and coworkers.
Reprinted with permission from Stains, C. I.; Lukovic, E.; Imperiali, B., A p38α -Selective Chemosensor for use in Unfractionated Cell Lysates. ACS Chem Biol 2010, 6 (1), 101-105. Copyright (2010) American Chemical Society.
N O N O2N
NH HO
O
FRRRRK-amide
Kinase
ATP N
O N O2N
NH
OPO3
2-O
FRRRRK-amide
Figure 1.6: PKC fluorescent sensor developed by Lawrence and coworkers. Phosphorylation of the serine residue which is in proximity of an environmentally sensitive fluorophore results in a fluorescence signal.
Figure adapted from Yeh, R. H.; Yan, X.; Cammer, M.; Bresnick, A. R.; Lawrence, D. S., Real time visualization of protein kinase activity in living cells. J Biol Chem 2002, 277 (13), 11527-32. Copyright the American Society for Biochemistry and Molecular Biology.
The strategy of using environmentally sensitive fluorophores was further developed by Lawrence and co-workers using a phosphopeptide binding domain. The Src peptide substrate tagged with an environmentally sensitive fluorophore, following phosphorylation, binds to the phosphopeptide binding protein (Lck SH2 domain). The change in the environment due to binding event leads to fluorescence signal (Figure 1.7).35
Figure 1.7: An alternative design of kinase fluorescent sensor based on an environmentally sensitive fluorophore. Phosphorylation followed by protein binding leads to a fluorescence response.
peptide sensor in which a pyrene is attached to the peptide near the phosphorylated tyrosine residue. While the fluorescence of the flurophore is quenched by the tyrosine residue, phosphorylation of the residue disrupts the interaction leading to a fluorescence increase (Figure 1.8).36, 37 The strategy has been applied to develop tyrosine kinases sensor working at long wavelengths for multicolor monitoring experiments.38
Figure 1.8: Tyrosine kinase fluorescent sensor based on a phosphorylation induced fluorescence dequenching mechanism developed by Lawrence and coworkers.
Reprinted with permission from Wang, Q.; Cahill, S. M.; Blumenstein, M.; Lawrence, D. S., Self-Reporting Fluorescent Substrates of Protein Tyrosine Kinases. J Am Chem Soc 2006, 128 (6), 1808-1809. Copyright (2006) American Chemical Society.
1.9).39 Lawrence and colleagues demonstrated the applicability of the technique to measure the activity of PKA in different mitochondrial sub-compartments.40
Figure 1.9: General design of “Deep Quench” kinase sensor developed by Lawrence and colleagues.
Reprinted with permission from Sharma, V.; Agnes, R. S.; Lawrence, D. S., Deep Quench: An Expanded Dynamic Range for Protein Kinase Sensors. J Am Chem Soc 2007, 129 (10), 2742-2743. Copyright (2007) American Chemical Society.
Another kinase activity measurement system based on fluorescent peptides was pioneered by Allbritton and coworkers employing capillary electrophoresis with laser induced fluorescence detection (CE-LIF). A fluorescently labelled peptide substrate of a kinase of interest is introduced into cell lysates or living cells. At various time points, aliquots/cells are analyzed by CE-LIF in which the nonphosphorylated peptide and the phosphorylated product are separated and quantified. Using this technique, numerous peptide-based sensors have been developed, for example for PKA, PKB, PKC, CamKII, cdc2K, Src and EGFR.41-44
with these two issues are important for further development of the peptide-based sensors.
Spatiotemporal Control and the Creation of Light-Activatable Bioagents
In studying of complex biological processes and medical applications, controlling the presence as well as the amount of an active species in a spatiotemporal manner is crucial. For example, the function of a specific protein in a biological context can be revealed by keeping it in an inactive state for a necessary amount of time then quickly activating it followed by phenotypic observation. Another example is measuring the activity of an enzyme of which the catalytic process is fast. A sensor used to report the activity when introduced into the system would be completely processed before the system gets equilibrated. It would be beneficial if the sensor is delivered into the system in an inert state and quickly converted to active state followed by necessary detection when the system is ready. Another circumstance is in medical applications when a drug is absolutely beneficial if it is active at only one or a few specific locations rather than the whole body. Hence, it is desired to have a “drug” that can circulate in the body in an inert form and can be activate at the specific locations in a controlled manner.
recently.49 Those reversible agents have found great applications in cellular molecular biology.49, 50
In contrast to the former group in which the activated agent can turn itself off after activation, the irreversible light-activatable agents furnish a way to permanently release an active species. These agents usually contain one or a few photocleavable groups.51 Typically, an essential functional group/groups on the bioagent of interest is/are identified and chemically modified with photoremovable group(s). This modification, therefore, renders the bioagent functionally inactive. The inactive bioagent is then introduced into the biological system and converted from inactive to active form upon exposure to light. In some circumstances, however, the photoactivatable bioagents can be considered as generated in an indirect manner through photocleavage-induced molecular interaction disruption. In those cases, a molecule that contains a photolabile group can interact intra- or inter-molecularly and “inhibit” a bioactive molecule. Photolysis triggers cleavage of that photolabile group, and thus disrupts the interactions which results in the release of the active biomolecule (Figure 1.16).
Using both direct and indirect approaches, various photoactivatable bioagents, ranging from ions and small molecules to macromolecules such as proteins and nucleotides, have been developed.50, 52, 53 The following lists just a few of them.
analog (Figure 1.11a).57 Lawrence and coworkers utilizes a similar approach to gain control over gene expression using photoactivatable β-ecdysone (Figure 1.11b).58
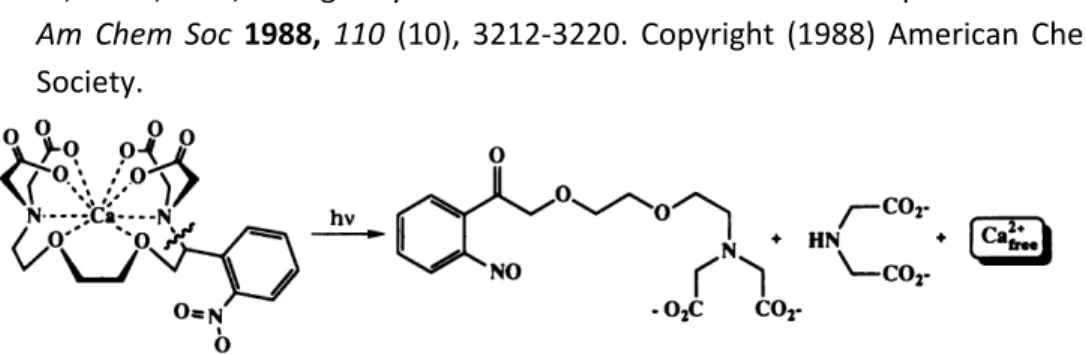
Kaplan and Tsien groups at the same time reported the creation of calcium ion releaser upon exposed to light (Figure 1.12).59, 60. Ellis-Davies and Kaplan reported a construct that selectively binds to calcium with high affinity (80 nM) in the dark. Upon Figure 1.10: Structures of light-activatable ATP (a), glutamate (b), acetylcholine analog (c), and serotonin (d).
NH2 O O O OH NO2 R NH2 O HO O O HO O
O2N
NO2 R NH O HO O OH NH2 O HO O OH
R = CO2H, CH3
H N O O N R NO2
H2N O
O N
R = H, CH3
d) b) NH2 H N O NO2 O OH C) N N N N NH2 O OH OH O P O O O P O P OO O
O O N N N N NH2 O OH OH O P O O O P O P OO O
O O NO2
Inactive ATP analog Active ATP a)
NH2 H N HO
exposure to UV-irradiation (~350 nm), this binding is eliminated, leading to the release of calcium (Figure 1.13).61
Figure 1.12: Light-mediated calcium release designed by Tsien et al.
Adapted with permission from Adams, S. R.; Kao, J. P. Y.; Grynkiewicz, G.; Minta, A.; Tsien, R. Y., Biologically useful chelators that release Ca2+ upon illumination. J Am Chem Soc 1988, 110 (10), 3212-3220. Copyright (1988) American Chemical Society.
Figure 1.13: Light-mediated calcium release designed by Ellis-Davies and Kaplan.
Reprinted from Ellis-Davies, G. C.; Kaplan, J. H., Nitrophenyl-EGTA, a photolabile chelator that selectively binds Ca2+ with high affinity and releases it rapidly upon photolysis. Proc Natl Acad Sci U S A 1994, 91 (1), 187-191.
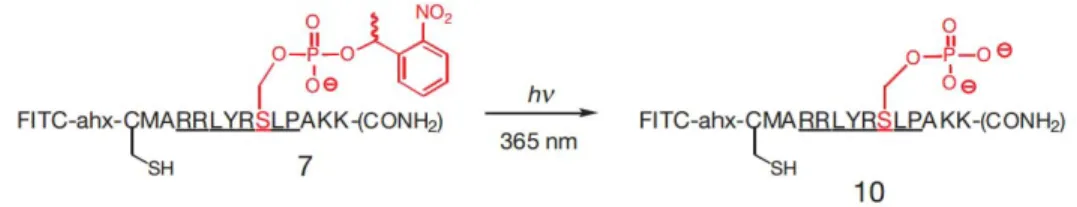
function of phosphopeptide binding protein in cell cycle. The peptide with a photolabile group on the phosphate moiety binds poorly to a 14-3-3 protein (Kd ~ 900 µM). Upon the removal of the photolabile group with UV light, the peptide tightly binds to the 14-3-3 protein (Kd of 25 nM), thus depletes the 14-3-3 from binding to endogenous proteins. With this technique, Imperiali, Yaffe, and coworkers demonstrated the role of 14-3-3 binding in various phases of cell cycle and the consequence, e.g., premature cell cycle entry, release of G1 cells from interphase arrest, and cells death, when such binding is compromised.64
Figure 1.14: Structure of light-activatable phosphopeptide designed by Imperiali and coworkers.
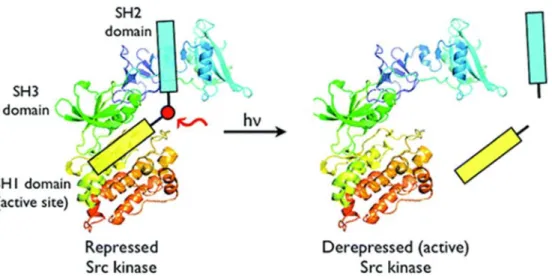
Figure 1.16: Design of photocleavable peptide inhibitor to control Src kinase activity reported by Lawrence and coworkers.
Figure 1.15: Structure of light-activatable PKC fluorescent sensor reported by Lawrence et al.
Figure 1.17: General design, synthesis, and photoactivation of RNA reported by Ando and coworkers.
Reprint with permission from Ando, H.; Furuta, T.; Tsien, R. Y.; Okamoto, H., Photo-mediated gene activation using caged RNA/DNA in zebrafish embryos. Nat Genet 2001, 28 (4), 317-325.
CHAPTER 2: LONG-WAVELENGTH FLUORESCENT REPORTERS FOR PROTEIN KINASES
Fluorescent techniques have become powerful tools in biomedical research. Their in vivo applications, however, reveal an intrinsic limitation brought by tissue opacity. The presence of hemoglobin and melanin limits the use of wavelengths below 600 nm whereas water interferes with the use of wavelength greater than 1000 nm. The problem is exemplified when researchers aim to study biochemistry inside erythrocytes. These cells, unlike other mammalian cells, contain a high percentage of hemoglobin (about 97% by dry weight). The strong absorption of hemoglobin from UV to 600 nm makes it difficult to monitor subcellular biochemical processes in this region (Figure 2.1).
erythrocytes during Plasmodium Falciparum infection and determine the roles of PKA-induced phosphorylation during the infection and propagation of Plasmodium Falciparum. While a number of fluorescent sensors for protein kinases have been developed, none are compatible with the optical challenges associated with erythrocytes. In this chapter, we describe an approach which takes advantage of the commercial availability of various fluorophores to create wavelength-tunable protein kinase sensors. Especially, we report the development of far-red and near-IR fluorescent sensors for protein kinases and demonstrate the applicability of these sensors to monitor endogenous PKA activity in erythrocyte lysates and in erythrocytes when using a light-activatable reporter.
Results and Discussion
Design and Synthesis
Our initial efforts focused on two serine-containing positively charged peptides, Aoc-GRTGRRFSY-amide and KRRRLASLAA-amide, which are known to be phosphorylated by PKA.81 Fluorophores were appended to the N termini of both peptides. The amino octanoyl (Aoc) moiety was used as a spacer in one of these to reduce any potential unfavorable steric effect of the large fluorophores on phosphorylation process. The strategy is outlined in Figure 2.2.
We examined a total of fourteen fluorophores that encompass a nearly 250 nm wavelength range throughout the red/far-red region (λex = 494 - 727 nm, λem = 530 - 752 nm). The structures of these fluorophores were selected from different scaffolds (Figure 2.3). Fluorophores were coupled to the peptide on resin, cleaved by TFA, and then purified by RF-HPLC (Table 2.1).
Figure 2.3: Structures and excitation - emission wavelengths of fluorophores.
HO O O
CO2
-O OH
OH O
N N
5Fam 494 - 530 nm
Cy3 544 - 564 nm
OH N N
CO2
-O O 5Tam 550 - 587 nm
O OH
N N
Atto610 620 - 640 nm
Atto620 620 - 645 nm
unrevealed -O 3S O O N N OH Red630
626 - 653 nm
N N O N O OH Atto633
630 - 654 nm
O OH
N N
Atto635 638 - 660 nm
OH O
N N
Cy5 640 - 665 nm
N N N O O -O 3S OH Atto655 665 - 687 nm
N O N N -O 3S O OH Atto680 685 - 705 nm
-O 3S -O 3S O N N OH O Red681
685 - 715 nm
O N N -O 3S O OH NIR700
691 - 737 nm
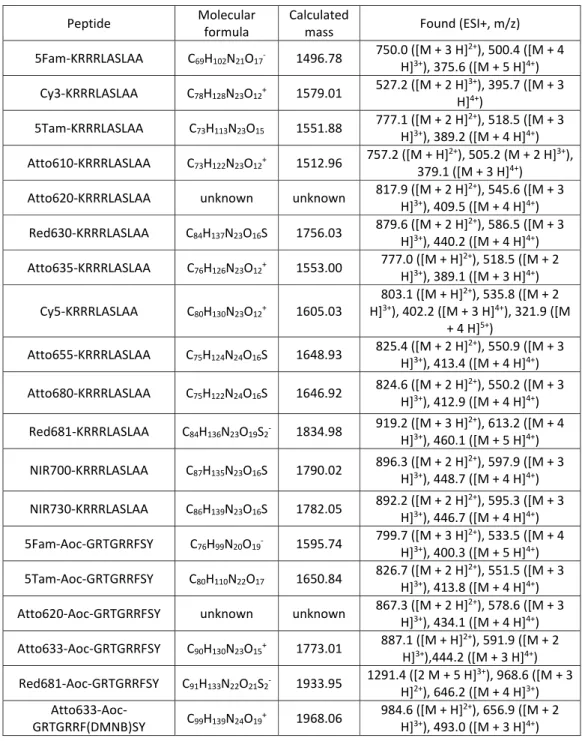
Table 2.1: Peptide ESI+ mass data.
Peptide Molecular
formula
Calculated
mass Found (ESI+, m/z)
5Fam-KRRRLASLAA C69H102N21O17- 1496.78 750.0 ([M + 3 H]
2+), 500.4 ([M + 4
H]3+), 375.6 ([M + 5 H]4+)
Cy3-KRRRLASLAA C78H128N23O12+ 1579.01 527.2 ([M + 2 H]
3+), 395.7 ([M + 3
H]4+)
5Tam-KRRRLASLAA C73H113N23O15 1551.88 777.1 ([M + 2 H]
2+), 518.5 ([M + 3
H]3+), 389.2 ([M + 4 H]4+)
Atto610-KRRRLASLAA C73H122N23O12+ 1512.96 757.2 ([M + H]
2+), 505.2 (M + 2 H]3+),
379.1 ([M + 3 H]4+)
Atto620-KRRRLASLAA unknown unknown 817.9 ([M + 2 H]
2+), 545.6 ([M + 3
H]3+), 409.5 ([M + 4 H]4+)
Red630-KRRRLASLAA C84H137N23O16S 1756.03 879.6 ([M + 2 H]
2+), 586.5 ([M + 3
H]3+), 440.2 ([M + 4 H]4+)
Atto635-KRRRLASLAA C76H126N23O12+ 1553.00 777.0 ([M + H]
2+), 518.5 ([M + 2
H]3+), 389.1 ([M + 3 H]4+)
Cy5-KRRRLASLAA C80H130N23O12+ 1605.03
803.1 ([M + H]2+), 535.8 ([M + 2
H]3+), 402.2 ([M + 3 H]4+), 321.9 ([M
+ 4 H]5+)
Atto655-KRRRLASLAA C75H124N24O16S 1648.93 825.4 ([M + 2 H]
2+), 550.9 ([M + 3
H]3+), 413.4 ([M + 4 H]4+)
Atto680-KRRRLASLAA C75H122N24O16S 1646.92 824.6 ([M + 2 H]
2+), 550.2 ([M + 3
H]3+), 412.9 ([M + 4 H]4+)
Red681-KRRRLASLAA C84H136N23O19S2- 1834.98 919.2 ([M + 3 H]
2+), 613.2 ([M + 4
H]3+), 460.1 ([M + 5 H]4+)
NIR700-KRRRLASLAA C87H135N23O16S 1790.02 896.3 ([M + 2 H]
2+), 597.9 ([M + 3
H]3+), 448.7 ([M + 4 H]4+)
NIR730-KRRRLASLAA C86H139N23O16S 1782.05 892.2 ([M + 2 H]
2+), 595.3 ([M + 3
H]3+), 446.7 ([M + 4 H]4+)
5Fam-Aoc-GRTGRRFSY C76H99N20O19- 1595.74 799.7 ([M + 3 H]
2+), 533.5 ([M + 4
H]3+), 400.3 ([M + 5 H]4+)
5Tam-Aoc-GRTGRRFSY C80H110N22O17 1650.84 826.7 ([M + 2 H]
2+), 551.5 ([M + 3
H]3+), 413.8 ([M + 4 H]4+)
Atto620-Aoc-GRTGRRFSY unknown unknown 867.3 ([M + 2 H]2+), 578.6 ([M + 3
H]3+), 434.1 ([M + 4 H]4+)
Atto633-Aoc-GRTGRRFSY C90H130N23O15+ 1773.01 887.1 ([M + H]
2+), 591.9 ([M + 2
H]3+),444.2 ([M + 3 H]4+)
Red681-Aoc-GRTGRRFSY C91H133N22O21S2- 1933.95 1291.4 ([2 M + 5 H]
3+), 968.6 ([M + 3
H]2+), 646.2 ([M + 4 H]3+)
Atto633-Aoc-GRTGRRF(DMNB)SY C99H139N24O19
+ 1968.06 984.6 ([M + H]2+), 656.9 ([M + 2
Screening Dye Library
The fluorescence increase induced by phosphorylation in the presence of a library of forty eight dyes (Table 2.2) was investigated. To ensure the coverage of all potential peptide-quencher hits, initial screening was carried out in Tris-HCl buffer (25 mM, pH 7.5) at peptide concentration of 2.5 µM and 5 µM; and quencher concentration varied from 5 µM to 60 µM. Upon the addition of PKA to the solution of fluorescently quenched peptide (Tris-HCl buffer containing peptide, quencher, MgCl2, and ATP), fluorescence dequenching ranging from modest to dramatic was observed (Table 2.3, Figure 2.4-2.6).
Table 2.2: Dye library.
A B C D
1 Acid Green 27 Ethyl Orange Aniline Blue WS Naphthol Blue Black
2 Acid Blue 40 Methylene Blue Azure A Methylthymol Blue
3 Evans Blue Brilliant Blue R Azure B bromide Methyl Violet
4 Acid Alizarin Violet N Eriochrome Black T Basic Fuchsin Ponceau S
5 Acid Blue 80 Alizarin Red Bismark Brown Y Rose Bengal
6 N,N-dimethylnitrosoaniline Malachite Green Oxalate Brilliant Yellow Rosolic Acid
7 Cresol Red Phenolphthalein Bromocresol Purple Safranin O
8 Phenol Red Carminic Acid Chlorazol Black E Tartrazine
9 Methyl Orange Nuclear Fast Red Chlorophenol Red Trypan Blue
10 Bromophenol Blue Acid Fuchsin Chrysoidine Y Acid Green 25
11 Xylene Cyanol FF Acridine Orange Erythrosin Acid Blue 129
Table 2.3: The PKA-catalyzed fluorescence increase of the fluorophore-substituted
peptides in buffer Tris-HCl pH 7.5 (25 mM), MgCl2 (1 mM) containing various quenchers.
Fluorescence monitored in a plate reader at maximum wavelengths of the fluorohores except (**) were done in a spectrofluorometer.
Peptide (2.5 μM) Quencher (μM) Fluorescence fold
increase
5Fam-KRRRLASLAA Acid green 27 (30) 3.7 ±0.8
Cy3-KRRRLASLAA Bromophenol blue (20) 5.1 ±0.1
5Tam-KRRRLASLAA Acid blue 80 (15) 24.5 ±1.4
Atto610-KRRRLASLAA Bromophenol blue (35) 5.5 ±0.2
Atto620-KRRRLASLAA Acid blue 80 (7.5) 21.9 ±0.5
Red630-KRRRLASLAA Bromophenol blue (30) 4.0 ±0.5
Atto635-KRRRLASLAA Bromophenol blue (35) 4.2 ±0.2
Cy5-KRRRLASLAA* Bromophenol blue (20) 5.8 ±0.2
Atto655-KRRRLASLAA Acid blue 80 (10) 16.7 ±0.5
Atto680-KRRRLASLAA Acid blue 80 (15) 22.5 ±2.7
Red681-KRRRLASLAA Acid blue 80 (5) 13.8 ±0.7
NIR700-KRRRLASLAA** Bromocresol purple (80) 2.7 ±0.1
NIR730-KRRRLASLAA** Bromocresol purple (80) 2.6 ±0.2
5Fam-Aoc-GRTGRRFSY Acid green 27 (30) 21.2 ±0.4
5Tam-Aoc-GRTGRRFSY Acid blue 80 (15) 100 ±27
Atto620-Aoc-GRTGRRFSY Acid blue 80 (7.5) 31.4 ±1.0
Atto633-Aoc-GRTGRRFSY Acid blue 80 (5) 30.9 ±4.9
Figure 2.4: PKA-catalyzed fluorescence dequenching. (a) 5Fam-KRRRLASLAA-amide (2.5 μM) with Acid Green 27 (30 μM), (b) Cy3-KRRRLASLAA-amide (2.5 μM) with Bromophenol
Blue (20 μM), (c) 5Tam-KRRRLASLAA-amide (2.5 μM) with Acid Blue 80 (15 μM), (d)
Atto610-KRRRLASLAA-amide (2.5 μM) with Bromophenol Blue (35 µM), (e) Atto620-KRRRLASLAA-amide (2.5 µM) with Acid Blue 80 (7.5 μM), (f) Red630-Atto620-KRRRLASLAA-amide
(2.5 μM) with Bromophenol Blue (30 μM). PKA (10 nM) was added to buffer (200 µL),
containing Tris-HCl pH 7.5 (25 mM), MgCl2 (1 mM), ATP (1 mM), peptide, and quencher.
Figure 2.5: PKA-catalyzed fluorescence dequenching (continued). (a) Atto635-KRRRLASLAA-amide (2.5 μM) with Bromophenol Blue (35 μM), (b) Cy5-KRRRLASLAA-Atto635-KRRRLASLAA-amide (2.5 µM) with Bromophenol Blue (20 μM), (c) Atto655-KRRRLASLAA-amide (2.5 μM) with Acid Blue 80 (10 μM), (d) Atto680-KRRRLASLAA-amide (2.5 μM) with Acid Blue 80 (15 μM), (e) Red681-KRRRLASLAA-amide (2.5 μM) with Acid Blue 80 (5 μM), (f) NIR700-Red681-KRRRLASLAA-amide with Bromocresol Purple (80 μM). PKA (10 nM) was added to buffer (200 µL), containing
Tris-HCl pH 7.5 (25 mM), MgCl2 (1 mM), ATP (1 mM), peptide, and quencher. Fluorescence
Figure 2.6: PKA catalyzed fluorescence dequenching (continued). (a) NIR730-KRRRLASLAA-amide with Bromocresol Purple (80 μM), (b) 5Fam-Aoc-GRTGRRFSY-NIR730-KRRRLASLAA-amide (2.5 μM) with Acid Green 27 (30 μM), (c) 5Tam-Aoc-GRTGRRFSY-amide (2.5 µM) with Acid Blue 80 (15 μM), (d) Atto620-Aoc-GRTGRRFSY-amide (2.5 μM) with Acid Blue 80 (7.5 μM), (e)
Red681-Aoc-GRTGRRFSY (2.5 μM) with Acid Blue 80 (5 μM), (f) Atto633-Aoc-GRTGRRFSY-amide
(2.5 μM) with Acid Blue 80 (5 μM). PKA (10 nM) was added to buffer (200 µL), containing
Fluorescent Fold Change and Fluorescent Recovery
We investigated the PKA-catalyzed fluorescence fold change and fluorescence recovery of the best reporters at a fixed concentration of peptide and varied concentrations of quencher. The fluorescence recovery is calculated by dividing fluorescence increase induced by phosphorylation by fluorescence before the addition of quencher. Examples are shown in Figure 2.7. At the fixed peptide concentration of 2.5 µM, the fluorescent fold change tends to approach maximal value while the fluorescence recovery tends to reduce as the quencher concentration increases (Figure 2.7).
Figure 2.7: Dependence of fluorescence fold change and fluorescence recovery on the concentration of quencher. (a, b) Atto680-KRRRLASLAA amide; (c, d) Red681-KRRRLASLAA-amide. Data was acquired in a spectroflurometer.
10 15 20 25 30 0 5 10 15 20
10.0 11.3 12.5 13.8 15.0
Fl uorescen t recover y / % Fo ld c h a n g e
Brilliant Yellow conc. / µM
b) Fold change Recovery
10 20 30 40 50 60 0 5 10 15 20 25
7.5 10.0 12.5 15.0
Fl uoresc en t recove ry / % Fo ld c h a n g e
Acid Blue 80 conc. / µM
a) Fold change Recovery
10 20 30 40 50 60 0 2 4 6 8 10 12
2.50 3.75 5.00 6.25 7.50
Fl uoresc en t recove ry / % Fo ld c h ange
Acid Blue 80 conc. / µM
c) Fold change Recovery
0 5 10 15 20 25 30 35 0 2 4 6 8 10 12 14
3.75 5.00 6.25 7.50
Fluores cen t rec o ve ry / % Fo ld c h an ge
Trypan Blue conc. / µM
Peptide Quencher Binding Investigation
Figure 2.8: Job plot of complex formation of 5Tam-KRRRLASLAA-amide with acid blue 80 (a), 5Tamra-Aoc-GRTGRRFSY-amide with Acid Blue 80 (b) and 5Tam-Aoc-GRTGRRFSY with Evans Blue (c). The peptide and quencher [total concentration of peptide and quencher was 10 µM in (a) and 5 µMin (b, c)] were added to buffer (200 µL) containing Tris-HCl pH
7.5 (25 mM), MgCl2 (1 mM), and ATP (1 mM) in (a) or Tris-HCl pH 7.5 (25 mM), MgCl2 (1
mM), ATP (1 mM), and NaCl (150 mM) in (b, c). Mixtures were incubated at room temperature for 10 min before the absorbance measurements.
0 0.2 0.4 0.6 0.8 1 1.2
0 0.2 0.4 0.6 0.8 1
A b so rban ce di ff eren ce
Peptide molar fraction
a) 550 nm 625 nm
-0.4 -0.2 0 0.2 0.4 0.6 0.8 1 1.2
0 0.2 0.4 0.6 0.8 1
A b so rba n ce di ff eren ce at 556 nm
Peptide molar fraction
b) 0 0.2 0.4 0.6 0.8 1 1.2
0 0.2 0.4 0.6 0.8 1
A b so rpba nce d if fe re nce at 556 nm
Peptide molar fraction
Initial Phosphorylation Rate and Kinase Inhibitor IC50 Determination
We investigated the feasibility of using our reporters to detect phosphorylation at different wavelengths. We first used five reporters (5Fam: λex - λem = 494 nm - 530 nm, 5Tam: 550 nm - 587 nm, Atto620: 620 nm - 645 nm, Atto680: 685 nm - 705 nm, and Red681: 685 nm - 715 nm) to determine the initial phosphorylation rates based on the assumption that the formation of the phosphopeptides is linear with respect to fluorescence increase. A standard value was acquired employing 5Fam-KRRRLASLAA-Figure 2.9: Dynamic light scattering analysis did not reveal detectable aggregate formation. Correlation function of 5Tam-Aoc-GRTGRRFSY-amide (1 µM) solution (a), Evans Blue (2 µM) solution (b), and 5Tam-Aoc-GRTGRRFSY-amide (1 µM) + Evans Blue (2 µM) solution.
0.6 1 1.4 1.8
0 200 400 600 800 1000
Correl
ation functi
on
Tau / µs → a) 0.999 1 1.001 1.002 1.003 1.004
0 200 400 600 800 1000
Correlation functi
on
Tau / µs → b) 0.998 0.999 1 1.001 1.002 1.003
0 500 1000
Correl a ti on fun cti on
(CE-LIF). As shown in the Table 2.4, the obtained values from various peptide/quencher pairs are comparable to the standard value obtained by capillary electrophoresis.
In addition to the initial rate determination, we further investigated the ability of our reporters for determining the IC50 of kinase inhibitors. H9 and H89 were selected as examples of PKA inhibitors since their IC50 values for PKA have been well documented in literatures. As shown in Figure 2.10, IC50 value of H9 and H89 determined by various reporters are comparable to the values reported in literatures.82 The assay is flexible in term of excitation and emission wavelengths since they can be selected if desired from λex: 494 nm - 730 nm and λem: 530 nm - 750 nm.
Effect of High Salt Concentration on the Fluorescence Response
mechanism; and that the presence of positively charged residues in the peptide sequence might not be absolutely required for the fluorescence increase to be observed.
Table 2.4: Initial phosphorylation rate of various peptide/dye quencher pairs. (#) value determined by CE-LIF.
Figure 2.10: IC50 curve of H9 and H89 toward PKA. PKA (10 nM) was added to buffer (200
µL) containing Tris-HCl (25 mM, pH 7.5), MgCl2 (1 mM), ATP (100 µM),
Monitoring PKA Activity in Erythrocyte Lysates
As mentioned before, PKA plays important roles in erythrocyte biochemistry and the infection of malarial parasite Plasmodium Falciparum. However, the high hemoglobin Table 2.5: Effect of salt on the fluorescence response upon phosphorylation. Peptides (2.5 μM) and various dye quenchers were incubated under either “no salt” buffer containing
Tris-HCl (25 mM, pH 7.5), MgCl2 (1 mM), ATP (1 mM) or “with salt” buffer containing
Tris-HCl (25 mM, pH 7.5), MgCl2 (1 mM), ATP (1 mM), and 150 mM NaCl. The reaction was
initiated by addition of PKA (10 nM).
Buffer
condition Peptide (2.5 μM) Quencher (μM) Fluorescent quenching (%)
Fluorescent fold increase
No salt 5Fam-Aoc-GRTGRRFSY Acid green 27
(30) 97.2 ±0.3 18.5 ±3.4
With salt 5Fam-Aoc-GRTGRRFSY Acid green 27
(30) 97.0 ±0.1 3.5 ±0.5
No salt 5Tam-Aoc-GRTGRRFSY Acid Blue 80 (15) 99.8 ±0.1 103.7 ±24.4
With salt 5Tam-Aoc-GRTGRRFSY Acid Blue 80 (15) 99.7 ±0.0 41.0 ±1.2
No salt Atto620-Aoc-GRTGRRFSY Acid Blue 80 (7.5) 99.1 ±0.1 16.6 ±0.8
With salt Atto620-Aoc-GRTGRRFSY Acid Blue 80 (7.5) 98.6 ±0.0 18.2 ±0.1
No salt Atto633-Aoc-GRTGRRFSY Acid Blue 80 (5) 99.4 ±0.3 30.2 ±9.1
With salt Atto633-Aoc-GRTGRRFSY Acid Blue 80 (5) 98.6 ±0.2 23.6 ±3.0
Table 2.6: Effect of salt on the fluorescence response upon phosphorylation of peptides with Evans Blue. Peptides (2.5 μM) and Evans Blue (2.5 μM) were incubated under either
“no salt” buffer containing tris-HCl (25 mM, pH 7.5), MgCl2 (1 mM), ATP (1 mM) or“with
salt” buffer containing tris-HCl (25 mM, pH 7.5), MgCl2 (1 mM), ATP (1 mM), and 150 mM
NaCl. The reaction was initiated by addition of PKA (10 nM).
Buffer
condition Peptide (2.5 μM) Fluorescent quenching (%) Fluorescent fold increase
No salt 5Fam-Aoc-GRTGRRFSY 80.9 ±1.5 2.9 ±0.5
With salt 5Fam-Aoc-GRTGRRFSY 62.1 ±1.1 1.4 ±0.0
No salt 5Tam-Aoc-GRTGRRFSY 99.8 ±0.0 20.6 ±2.9
With salt 5Tam-Aoc-GRTGRRFSY 99.8 ±0.0 34.6 ±14.5
No salt Atto633-Aoc-GRTGRRFSY 98.0 ±0.4 2.0 ±0.3
600 nm. To confirm the feasibility of using our reporters in erythrocytes, we investigated the loss of fluorescence signals from three peptides in erythrocyte lysate: 5Fam-Aoc-GRTGRRFSY-amide, 5Tam-Aoc-5Fam-Aoc-GRTGRRFSY-amide, and Atto633-Aoc-GRTGRRFSY-amide. As expected, while 90% of the fluorescence signal is lost for the 5Fam-peptide and 98% for the 5Tam-peptide, only 10% of the signal is compromised in the case of the Atto633-peptide in 10% lysate (Figure 2.11, blue and red). Additionally, the fluorescence signals from 5Fam and 5Tam labeled peptides are completely blocked, whereas 50% of the original Atto633-peptide signal is still detected in 100% erythrocyte lysate (Figure 2.11, blue and green).
We further investigated the fluorescence response upon phosphorylation of Figure 2.11: Relative fluorescence of 5Fam-, 5Tam-, and Atto633 - labeled petides (1μM) in the presence of PBS 1X, 10% erythrocyte lysate, and 100% erythrocyte lysate.
greater fluorescence response (34 fold) compared to the response of the Atto633-peptide (3 fold) (Table 2.5, 2.6). However, no fluorescence response is detected when the 5Tam-peptide is phosphorylated in erythrocyte lysates in the presence of Evans Blue while profound response is still observed when the Atto633-peptide is used (Figure 2.12).
We also examined the quenching efficiency of quenchers in erythrocyte lysates. Figure 2.12: Reaction progress curve of the PKA-catalyzed phosphorylation of fluorophore-Aoc-GRTGRRFSY-amide (1 µM) with Evans Blue (2 µM) in 100% erythrocyte lysates where the fluorophore is Atto633 (black) or 5Tam (red).
0.5 1 1.5 2 2.5 3 3.5
0 100 200 300 400 500 600
F
luores
cen
ce Fo
ld
Ch
ang
e
→
Time / s →
Figure 2.13: Quenching of Atto633-Aoc-GRTGRRFSY (1 μM) fluorescence by Acid Blue 80
(circles, EQ50 = 8.1 ± 1.7 μM) and Evans Blue (squares, EQ50= 0.35 ± 0.03 μM) in the
presence of 10% erythrocyte lysate. EQ50 is the concentration of quencher at which
Atto633-peptide fluorescence (Figure 2.13). Furthermore, erythrocyte cellular integrity is markedly reduced upon exposure to Acid Blue 80 (30 µM), but remains unperturbed in the presence of Evans Blue (30 µM). Therefore, further phosphorylation studies were performed with the Atto633-peptide and Evans blue quencher.
Selectively Detect PKA Activity in Erythrocyte Lysate
Erythrocytes possess a number of protein kinases.83 Therefore we investigated whether the observed fluorescence response is due to endogenous PKA activity. The PKA inhibitor H89 blocks the observed fluorescence change with an IC50 of 1.14 ± 0.17 µM in 10% lysates. The more selective PKA inhibitor KT5720 prevents the phosphorylation-induced fluorescence response with an IC50 of 1.59 ± 0.36 µM.
the rate of fluorescence response compared to control lysates. This directly corresponds with the amount of PKA removed from the lysate (Figure 2.14). These results confirm that the fluorescence response in the lysate is due to PKA activity.
Light-activatable sensor and the monitoring PKA activity inside erythrocytes
Figure 2.15: Photolysis of Atto633-Aoc-GRTGRRFS(DMNB)Y-amide (a) Structure of peptide before and after photolysis (b) UV traces at 600 nm of Atto633-Aoc-GRTGRRFS(DMNB)Y-amide before (grey) and after photolysis (black). (c, d) ESI+ mass data of before and after photolysis in (b) respectively. Atto633-Aoc-GRTGRRFS(DMNB)Y-amide (5 µM) in PBS 1x was kept in dark or underwent 2 min illumination before analyzed by LC-MS. LC-MS analytical characterizations were run on an Agilent instrument equipped with UV-VIS and quadrupole mass detectors using either a Viva C4 column (5 µM, 50 x 2.1 mm) from
Restek. All LC-MS experiments were conducted using H2O-CH3CN solvents with 0.1%
formic acid. Photolysis was performed using an Oriel 200 W Hg-arc lamp (model 66901) equipped with a beam splitter and a UV bandpass 360 ± 50 nm filter (Newport, FSQ-UG1).
After photolysis Before photolysis
-20 20 60 100
0 2 4 6 8 10 12 14 16 18
Ab
s / a.u.
→
Time / min →
b) 493.0 656.9 984.6 0 20 40 60 80 100 120
0 500 1000 1500
Re a ti ve in te n si ty → m/z → c) 444.2 591.8 887.2 0 20 40 60 80 100 120
0 500 1000 1500
Rel at iv e inten sit y → m/z → d) Atto633-Aoc-GRTGRRFSY-amide
O NO2 OCH3 OCH3
Light-Activation and Monitoring PKA Activity in Erythrocytes
These results confirm that Atto633-GRTGRRFSY-amide peptide is phosphorylated by PKA upon photolysis.
Conclusion
fluorophores. We have demonstrated the applicability of the approach to develop long wavelength fluorescent reporters for PKA and illustrated visualization of the protein kinase activity in erythrocytes.
Materials and Method
General reagents and solvents were purchased from Fisher or Sigma-Aldrich. 2-(6-chloro-1H-benzotriazole-1-yl)-1,1,3,3-tetramethylaminium hexafluorophosphate (HCTU),
Syntheses
Synthesis of Fmoc-L-Ser(DMNB)-OH
Fmoc-L-Serine allyl ester
(dd, J = 2.9, 11.2 Hz, 1 H), 2.37 (br. s., 1 H). Exact mass calculated for C21H21NO5 367.14; found (ESI+, m/z) 368.1 (M + H)+, 390.1 (M + Na)+.
DMNB trichloroacetimidate
4,5-dimethoxy-2-nitrobenzyl alcohol (8.97 g, 42.08 mmol) and anhydrous K2CO3 (14.2 g, 102.74 mmol) were stirred in anhydrous CH2Cl2 (120 mL) under N2 atmosphere. To the above mixture, trichloroacetonitrile (10 mL, 99.73 mmol) and anhydrous triethylamine (6 mL, 43.01 mmol) were added and the reaction mixture stirred at room temperature for 24 h. CH2Cl2 (300 mL) was added to the reaction mixture. The organic layer was collected and washed with 0.5 N HCl followed by solvent removal. The dried crude residue was purified by silica flash chromatography (75:25 hexanes:ethyl acetate) to give DMNB trichloroacetimidate: 1H NMR (400 MHz, CDCl
3) δ = 8.51 (s, 1 H), 7.75 (s, 1 H), 7.23 (s, 1 H), 5.78 (s, 2 H), 3.97 (s, 3 H), 3.96 (s, 3 H). Exact mass calculated for C11H11Cl3N2O5 355.97; found (ESI+, m/z) 374.9 (M + H3O)+.
Fmoc-L-Serine(DMNB) allyl ester
Fmoc-L-Serine allyl ester (1.74 g, 4.75 mmol) and the DMNB trichloroacetimidate
Hz, 2 H), 7.18 (s, 1 H), 5.97 - 5.82 (m, 1 H), 5.71 (d, J = 8.4 Hz, 1 H), 5.33 (d, J = 17.1 Hz, 1 H), 5.23 (d, J = 10.4 Hz, 1 H), 4.98, 4.92 (ABq, JAB = 15.4 Hz, 2 H), 4.71 (d, J = 5.1 Hz, 2 H), 4.68 - 4.62 (m, 1 H), 4.48, 4.39 (ABXqd, JAB = 10.5 Hz, JAX = 6.8 Hz, JBX = 6.9 Hz, 2 H), 4.24 (t, J = 7.1 Hz, 1 H), 4.18 - 4.04 (m, 2 H), 3.96 (s, 3 H), 3.95 (s, 3 H), 3.94 - 3.89 (m, 1 H). Exact mass calculated for C30H30N2O9 562.20; found (ESI+) 563.2 (M + H)+, 585.2 (M + Na)+. Fmoc-L-Serine(DMNB)-OH
Fmoc-Serine(DMNB) allyl ester (1.00 g, 1.78 mmol) was dissolved in CHCl3 (40 mL) containing acetic acid (21 mL) and N-methylmorpholine (3 mL). To the above solution was added Pd(Ph3P)4 (0.97 g, 0.84 mmol). The reaction mixture was stirred for 4 h at room temperature and neutralized by the addition of 0.1 N HCl until pH 4 and then the suspension was extracted with CH2Cl2 (twice) and ethyl acetate (three times). The organic extracts was dried (Na2SO4), and concentrated under reduced pressure. The crude residue was purified by silica flash chromatography (CH2Cl2 and then 48:2 CH2Cl2:CH3OH) to yield Fmoc-L-Serine(DMNB)-OH: 1H NMR (400 MHz, CDCl
3) δ = 7.76 (d, J = 7.6 Hz, 2 H), 7.66 (s, 1 H), 7.60 (t, J = 5.9 Hz, 2 H), 7.40 (t, J = 7.5 Hz, 2 H), 7.31 (dt, J = 1.2, 6.4 Hz, 2 H), 7.10 (s, 1 H), 5.69 (d, J = 8.3 Hz, 1 H), 4.97, 4.87 (ABq, JAB = 15.29, 2 H), 4.68 (br.s., 1 H), 4.53 - 4.37 (m, 2 H), 4.23 (t, J = 6.7 Hz, 1 H), 4.12 (d, J = 9.2 Hz, 1 H), 3.93 (s, 3 H), 3.90 (s, 3 H), 3.89 - 3.83 (m, 1 H). 1H NMR (400 MHz , acetone-d