CHARACTERIZATION OF THE BREAST CANCER KINOME
Alicia Ann Midland
A dissertation submitted to the faculty of the University of North Carolina at Chapel Hill in partial fulfillment of the requirements for the degree of Doctor of Philosophy in the
Curriculum of Bioinformatics and Computational Biology.
Chapel Hill 2012
Approved by:
Shawn M. Gomez, Eng.Sc.D.
Gary L. Johnson, Ph.D.
Yufeng Liu, Ph.D.
M. Ben Major, Ph.D.
iii ABSTRACT
ALICIA ANN MIDLAND: Characterization of the breast cancer kinome (Under the direction of Shawn M. Gomez and Gary L. Johnson)
Protein kinases are integral to cellular signaling and their dysfunction can lead to
the development of cancer. Breast cancer is a heterogeneous disease that is responsible
for many deaths each year where abnormalities in kinases have been observed. Many
studies focus on a select few kinases and the interaction of all 518 kinases is not well
understood. Wide-scale molecular profiling of kinases, including signature-finding and
network reconstruction, is a necessary step towards understanding how these genes get
deregulated and progress in disease.
High-throughput analysis techniques were applied to quantify the expression of
protein kinases in various types of breast cancer including: cell lines, mouse models, and
a patient tumor. Using RNA-seq, we analyzed the expression of over 70% of kinases in
each breast cancer cell type. An emerging technique that combines the use of multiplexed
inhibitor beads with mass spectrometry (MIB/MS) was used to measure kinase activity
changes upon treatment with kinase inhibitors. MIB/MS found 40-50% of the RNA-seq
expressed kinases to be active. Statistical pattern recognition and multivariate methods
were tested to find possible kinase activity signatures for breast cancer subtypes. We also
constructed simple networks for triple negative breast cancer (TNBC) samples using
correlation calculations of MIB/MS data across drug treatments. We found that many of
for a reprogrammed TNBC kinome, but the lack of experimental replicates disallows us
from making statistically significant predictions from the data.
Dealing with high-throughput experiments made us realize that organization of
the generated data is another important challenge. Data should be made openly available
because someone else may find unique characteristics or results that were initially
missed. We developed Kinome DB, a protein kinase website that compiles information
directly related to kinase experiments.
While we were unable to draw concrete conclusions regarding kinase activity
signatures, we tested the viability of several methods to evaluate MIB/MS data and
characterized the breast cancer kinase transcriptome using RNA-seq. These are necessary
steps for determining new kinase drug targets and rational combination therapies for
v
ACKNOWLEDGMENTS
First, I would like to thank Shawn Gomez and Gary Johnson, my co-advisors on
this project. Their immeasurable contributions of mentorship, knowledge, financial
support, and scientific visions taught me how to think about and conduct scientific
research. Thank you to the members of my committee for your guidance and suggestions
on my project.
I am thankful to all past and present members of the Gomez and Johnson labs.
From the Johnson lab, I would especially like to thank Debbie Granger for training me
and helping me out with “wet bench” experiments on several early mornings. I also thank
James Duncan and Marty Whittle for collaborating with me on this project. My graduate
school experience would not have been the same without the members of the Gomez lab
around me. Their knowledge accompanied by daily banter, quips, and overall nerdery
helped many days pass by quicker, with laughter, and for that I thank them.
I am ever grateful to all of my friends who stuck by me along this journey,
especially Janet Doolittle and David Ivy, both of whom I could always count on to keep
me levelheaded and sane. I would like to sincerely thank my parents and brother for
always standing by me. Without their constant love and support, this dissertation would
TABLE OF CONTENTS
LIST OF TABLES ... viii
LIST OF FIGURES ... ix
LIST OF ABBREVIATIONS AND SYMBOLS ... xi
CHAPTER I: INTRODUCTION ...1
Importance of Protein Kinases in Cancer ...2
Predict Methods to Predict Gene Signatures and Networks ...4
CHAPTER II: BREAST CANCER TRANSCRIPTOME PROFILING USING NEXT-GENERATION SEQUENCING RNA-SEQ DATA ...7
Introduction ...7
Methods...10
Results and Discussion ...13
Conclusions ...18
Figures and Legends ...20
CHAPTER III: COMPUTATIONAL APPROACHES TO IDENTIFY BREAST CANCER SUBTYPE SPECIFIC KINOME SIGNATURES USING MIB/MS KINOME ACTIVATION STATE PROFILING ...27
Introduction ...27
Methods...30
Results and Discussion ...33
vii
Figures and Legends ...39
CHAPTER IV: Kinome DB: KINOME DATABASE ...49
Introduction ...49
Methods...51
Results and Discussion ...52
Conclusions ...59
Figures and Legends ...60
CHAPTER V: CONCLUSION ...76
Summary of Findings ...76
Challenges ...76
Future Directions ...77
Concluding Remarks ...78
APPENDICES ...79
APPENDIX 1: RNA-seq read counts for expressed kinases ...79
APPENDIX 2: RNA-seq RPKM values for expressed kinases with great than 50 reads ...91
APPENDIX 3: RNA-seq read counts for expressed kinases in TNBC ...103
APPENDIX 4: RNA-seq RPKM values for expressed kinases in TNBC with greater than 50 reads ...116
LIST OF TABLES
Table 2.1. RNA-seq protein kinases per cell line ...21
Table 2.2. RNA-seq protein kinases per TNBC cell type ...23
Table 2.3. Missense and Nonsense mutations in SUM159 ...26
Table 3.1. MIB/MS captured protein kinases per cell line ...39
ix
LIST OF FIGURES
Figure 2.1. Flowchart of Bowtie Alignment Procedure ...20
Figure 2.2. Venn Diagram Showing Overlap of Protein Kinase Transcripts Between Cell Lines ...22
Figure 2.3. Venn Diagram and Kinase Tree Showing RNA-seq Coverage ...24
Figure 2.4. Scatterplot of Cancer Cell Line Kinase RPKM Fold Changes Relative to HuMECs ...25
Figure 3.1. Venn Diagram and Kinase Tree Showing MIB/MS Coverage ...41
Figure 3.2. PCA for 4 Cell Lines (HuMEC, BT-474, MDA-MB-231, and MCF-7) after Treatment with Lapatinib ...42
Figure 3.3. Principle Components Analysis (PCA) and K-means of SUM159 Treated with AZD6244 Time Course Data ...43
Figure 3.4. Hierarchical Clustering Analysis of SUM159 Time Course Treated with AZD6244 ...44
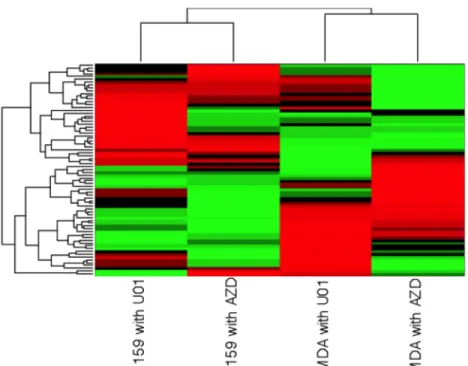
Figure 3.5. Hierarchical Clustering Analysis of SUM159 and MDA-MB- 231 Treated with AZD6244 and U0126 at 24 Hours ...45
Figure 3.6. Results of CIA Comparing SUM159 to HuMEC ...46
Figure 3.7. SUM159 Kinase Network ...47
Figure 3.8. C3Tag Kinase Network ...48
Figure 4.1. Kinome Database Homepage ...60
Figure 4.2. Kinome Database Kinase List Page ...61
Figure 4.3. Kinome Database Kinase Page ...62
Figure 4.4. Kinome Database Family List Page ...63
Figure 4.5. Kinome Database Family Page ...64
Figure 4.6. Kinome Database Cell Type List Page ...65
Figure 4.8. Kinome Database Inhibitor List Page ...67
Figure 4.9. Kinome Database Inhibitor Page ...68
Figure 4.10. Kinome Database Experiments List Page ...69
Figure 4.11. Kinome Database MIB/MS Experiments Page ...70
Figure 4.12. Kinome Database RNA-seq Experiments Page ...71
Figure 4.13. Kinome Database Sample Experiment Page ...72
Figure 4.14. Kinome Database Sample Experiment Run Page ...73
Figure 4.15. Kinome Database Data Page ...74
xi
LIST OF ABBREVIATIONS AND SYMBOLS
BC: breast cancer
bp: base pair
CIA: co-inertia analysis
BWA: Burrows-Wheeler Alignment tool
ER: estrogen receptor
ER-: estrogen receptor negative
GEMM: genetically engineered mouse model
HER2/neu: v-erb-b2 erythroblastic leukemia viral oncogene homolog 2
HER2/neu-: HER2/neu negative
hg19: NCBI build 37
HuMEC: TERT-immortalized mammary epithelia
MEK: mitogen-activated protein kinase kinase
MIB: multiplexed kinase inhibitor beads
MIB/MS: multiplexed kinase inhibitor beads and mass spectrometry
PCA: principle components analysis
PR: progesterone receptor
PR-: progesterone receptor negative
RNA-seq: RNA-sequencing
RPKM: reads per kilobase of exon model per million mapped reads
SILAC: stable isotope labeling by amino acids in cell culture
TNBC: triple-negative breast cancer
CHAPTER ONE INTRODUCTION
Breast cancer is collectively the second most frequent cause of death in women
and the chance of a woman developing breast cancer in her lifetime is approximately 1 in
8 (American Cancer Society, 2012). The disease is heterogeneous, with known
differences in molecular variations, histological composition, and clinical outcomes.
Breast cancers are typically diagnosed based on the presence/absence of three receptors:
estrogen receptors (ER), progesterone receptors (PR), and v-erb-b2 erythroblastic
leukemia viral oncogene homolog 2 (HER2/neu). Triple-negative breast cancer (TNBC)
is a particularly aggressive and commonly reoccurring breast cancer subtype that does not
express the common hormone receptor targets (ER-/PR-/HER2/neu-).
Studies of the breast cancer genome have divided tumors into five subtypes
(Luminal A, Luminal B, HER2-enriched, Basal-like, and Claudin-low) as well as a
normal-like group (Herschkowitz et al., 2007; Perou et al., 2000; Sørlie et al., 2001,
2003). Profiling of microarray gene expression data was used to determine these subtypes
and the subtypes have been found to predict patient outcomes (van ’t Veer et al., 2002).
Despite these advances, there are many unanswered questions regarding molecular
changes in breast cancer, why drug treatments are or become ineffective, and what we
should target to stop or treat the disease. To address these questions, this dissertation
in breast cancer, mainly in TNBC, which is the most difficult to treat, and how to
organize large datasets, enabling researchers to acquire meaningful information from
them.
Importance of Protein Kinases in Cancer
Protein kinases are key components of cellular signal transduction pathways and
their abnormal regulation or overexpression is fundamental to cancer development and
progression. The human kinome is made up of approximately 518 kinases. Many protein
kinase inhibitors are administered clinically to treat cancers, but with limited success
because tumors are able to evade the treatment. For example, through the activation of
alternative kinase-regulated pathways. Much is still unknown about the network
dynamics of kinases and how the kinome changes in response to cancer and cancer
treatments.
Protein kinase genes are commonly mutated in cancer. Driver mutations give
cancer cells a selective advantage for growth and are causally associated in oncogenesis
(Stratton, Campbell, & Futreal, 2009). The Sanger Institute examined the protein coding
sequence of 518 protein kinase genes in primary cancers and cancer cell lines using
Affymetrix SNP microarrays and their screen of 25 breast cancers detected 92 mutations
(Stephens et al., 2005). Mutations were found in approximately 15% of kinases and a
majority were base substitutions that resulted in missense amino acids (Stephens et al.,
2005). A recent genomic sequencing study of 100 breast cancer tumors found 40 driver
3
Since there are over 100 kinase-specific inhibitors in Phase 1-3 clinical trials for
various diseases, kinases are a viable group to target for new breast cancer, specifically
TNBC, treatment therapies (Walker & Newell, 2009). The kinase inhibitors are effective
for treating patients who have a specific set of mutations in kinase genes, but not for
those who have mutations that are different (Fedorov, Müller, & Knapp, 2010). Analyses
targeted to each individual are necessary because cancers affecting the same tissue in
different patients have a diverse set and number of mutations (Fedorov et al., 2010).
Today, biopsies of tumors are taken so that cancer can be diagnosed based on
histology, but it is still too expensive to genetically sequence or run quantitative
proteomics on every tumor. However, if we determine which kinase genes to target, just
these specific kinases can be assayed, cutting the time and cost of breast cancer
diagnoses. Many academic research laboratories study protein kinases, but Fedorov et al.
found that most published research was conducted on 1-5% of all kinases with
approximately 25% having unknown function and about 50% vastly uncharacterized
(Fedorov et al., 2010). I assess methods for processing next-generation sequencing data,
specifically RNA-sequencing data (RNA-seq), to study all human protein kinases and
look for new driver mutations in a TNBC cell line in Chapter 2. In Chapter 3, I show
methods to determine which kinase genes are most responsible for changes in protein
activity upon treatment with kinase inhibitors.
Since most academic and commercial research is focused on the same small set of
protein kinases, there is a lack of resources for researchers who want information on all
kinases, apart from a few government funded projects that have information for all genes
abandoned, with broken web domains or websites that have not been updated in years. In
Chapter 4, I present a new kinome database that has facts for all 518 human protein
kinases. The database has a focus on breast cancer and has information about cell types,
kinase inhibitors, and real experimental data.
Previous Methods to Predict Gene Signatures and Networks
Many studies are designed to find gene signatures specific to diseases such as
cancer to use in predicting prognosis, response to treatment, and/or death. In 2002, van ‘t
Veer et al. found a 70 gene prognosis profile by applying a classification method using
correlation coefficient, rank-ordering of genes, and ‘leave-one-out’ cross validation on 78
DNA microarrays of sporadic lymph-node-negative breast cancer patients (van ’t Veer et
al., 2002). In additional studies, they showed that their gene-expression profile performed
better as a predictor of disease outcome in young breast cancer patients than standard
clinical risk factors (Buyse et al., 2006; Chang et al., 2005; van de Vijver et al., 2002).
Other researchers assessed the method used by van ‘t Veer et al. and other gene
signature studies because the overlap between the predicted gene sets was nearly zero
genes (Ein-Dor, Kela, Getz, Givol, & Domany, 2005). Focusing on data from van ‘t Veer
et al., they found that the set of 70 predictive genes outputted by the method was not
unique and changed based on the subset of patients used in the analysis (Ein-Dor et al.,
2005). The variation in gene sets is likely because several genes correlate with patient
survival with little differences in the correlation values (Ein-Dor et al., 2005).
Additional statistical measures such as risk scores, Pearson correlation, and
5
for specific or even across many different types of cancer (Chen et al., 2007; Liu et al.,
2007; Xu, Geman, & Winslow, 2007). The methods described are far from perfect in
predicting response in all cancer subtypes. It is still difficult to genetically screen all
patient tumors due to cost, time, and analysis restraints.
Kinases have been shown to acquire drug resistance to inhibitors so combination
therapies may be necessary for sustained effectiveness (Lo, 2012; Ocaña, Amir, Seruga,
Martin, & Pandiella, 2012). Many clinical trials are assessing combinatorial therapies of
targeted kinase inhibitors in cancer (Al-Lazikani, Banerji, & Workman, 2012). Knowing
all possible connections between kinases in the kinome network would help predict
combination therapies. In Chapter 3 I use computational methods to find kinase networks.
The use of high-throughput technologies, such as DNA microarrays,
next-generation sequencing (NGS), and high-throughput proteomics has greatly broadened the
scope of cancer genomic and proteomic research studies. There exist many computational
methods and statistical models for microarray generated data, however, the development
of appropriate tools for the analysis of NGS and high-throughput proteomics still remains
a challenge, partly due to the sheer amount of resulting data. NGS, particularly RNA-seq,
has a wide variety of applications including differential gene expression, gene discovery,
mutation/SNP discovery, novel transcripts, and novel isoforms.
Here, I present a global look at the kinome of breast cancer, primarily focusing on
TNBC. My approach is applicable to any type of cancer for which there is
next-generation genomics and proteomics data. Prior information about genes is not required
to find the kinase genes in RNA-seq data, which is not the case for microarrays that need
Multiplexed Inhibitor Beads coupled with Mass Spectrometry (MIB/MS) data for the
TNBC kinome and there is no existing TNBC kinome signature or network that is used to
predict drug combinations. Knowledge of the TNBC kinome transcriptome and proteome
will lead to new drug targets and rational combination therapies for treatment of TNBC.
In addition, a kinome database online resource with experimental data will allow
researchers to further characterize protein kinases and study this cancer subtype to aid in
CHAPTER TWO
BREAST CANCER TRANSCRIPTOME PROFILING USING NEXT-GENERATION SEQUENCING RNA-SEQ DATA
INTRODUCTION
Transcriptome profiling requires obtaining transcript expression data for all genes
and was made easier with the development of RNA-seq. Unlike microarrays or
hybridization- based techniques, RNA-seq does not rely on existing knowledge of the
genome sequence nor have detection limitations due to background levels an`d signal
saturation (Wang, Gerstein, & Snyder, 2009). RNA-seq is also getting increasingly less
expensive with competition between next-generation sequencing companies and the
development of new sequencing machines that can generate more data in less time.
Researchers can take advantage of the amount of data produced by multiplexing samples
using unique primers for each experimental condition.
The general protocol of RNA-seq is that a population of RNA is converted to a
cDNA fragment library with adaptors attached to one or both ends. The fragments may
be amplified then sequenced from one (single-end sequencing) or both ends (paired-end
sequencing) to produce millions of 30-400 base pair (bp) reads (Wang et al., 2009). The
number of reads and the read lengths are increasing as the technology improves.
RNA-seq can be performed on any high-throughput RNA-sequencing platform (Wang et al., 2009).
alignment and analysis of RNA-seq data. There is currently no standard analysis protocol
or program that all researchers use to process the data.
TNBC’s are comprised of the Basal-like and Claudin-low breast cancer subtypes
and lack estrogen and progesterone receptors, as well as the HER2 targets for treatments.
like and Claudin-low breast cancers have distinct biological characteristics.
Basal-like breast cancer highly expresses proliferation genes and the basal cluster, which is a
unique gene cluster that includes potential drug targets EGFR and c-kit. Claudin-low
breast cancers have low expression of proliferation genes, have lost cell-cell adhesion
molecules, and show expression of epithelial-mesenchymal transition (EMT) and stem
cell feature-associated genes. TNBC has been found to be more prevalent in younger
(premenopausal) women and in young African American women (Carey et al., 2006;
Herschkowitz et al., 2007). TNBC is typically more aggressive than other breast cancer
subtypes and is more difficult to treat, leading to a poorer prognosis for patients (Dent et
al., 2007).
Here, we characterized the kinase transcriptome in breast cancer samples, with a
focus on TNBC, using RNA-seq data. For the analyses, we investigated some of the most
widely used alignment programs at the time: Bowtie and Burrows-Wheeler Alignment
tool (BWA) (Langmead, Trapnell, Pop, & Salzberg, 2009; Li & Durbin, 2009). We
compiled a list of all kinases and developed a computational analysis protocol for
obtaining kinase transcripts from raw RNA-seq outputs. The analysis begins with a
stringent kinase transcript-finding protocol to optimize reads included from a short-read
(35-bp) protocol. This method was followed with a study focused on longer read (76-bp)
9
TNBC cell line. Evaluation of the kinase transcripts found shows that a majority of the
kinome is expressed in each cell type at varying levels. Knowledge of these transcript
expression levels is an additional tool for investigations into the kinome of TNBC and
METHODS Data Sources
The Johnson Lab prepared cDNA libraries for next-generation RNA-sequencing
in three breast cancer cell lines: MDA-MB-231, BT474, and MCF-7, and a
non-cancerous control cell line: HuMEC (TERT-immortalized mammary epithelia). Two
lanes of sequencing per cell line were completed using the Illumina sequencing platform
producing 35-bp single-end reads.
76-bp Illumina RNA-seq data from The Cancer Genome Atlas (TCGA) was
obtained to profile patient’s Claudin-low breast tumor and two Claudin-low TNBC lines,
SUM159 and MDA-MB-231.
RNA-seq Alignment and Kinase Analysis
A reference dataset of human mRNA transcripts was downloaded from NCBI
build 37 (hg19) and reformatted it to be FASTA format to use in the alignment. The
analysis software Bowtie was used in the alignment of the first set of shorter RNA-seq
reads. Default parameters were not used in the alignment. Instead, due to our desire to
provide a high-quality characterization of the kinase repertoire in each cell line, we
performed an interactive procedure of alignments with multiple levels of stringency. The
procedure is detailed below (see Results). Upon alignment, in-house scripts were used to
quantify read counts for kinases. Kinase genes with greater than 50 reads per lane were
summed for each cell line.
The longer 76-bp read data was aligned to the UCSC human knownGene mRNA
from NCBI build 37 (hg19) using Bowtie (Langmead et al., 2009). The alignment was
11
was reported for each aligned read. Duplicate reads were removed using Picard
(http://picard.sourceforge.net) and in-house scripts were used to calculate read counts for
all genes and protein kinase genes were parsed from the list. The read counts were
summed for all isoforms of each kinase gene and again we required that the kinase genes
have greater than 50 reads each.
RNA-seq Normalization
The quantified kinase transcript counts were normalized with a calculation of
reads per kilobase of exon model per million mapped reads (RPKM) (Mortazavi et al.,
2008). RPKM is calculated with the formula:
𝑅𝑃𝐾𝑀=10!×𝐶 𝑁×𝐿
where C is the number of reads that mapped to exons, N is the total number of mappable
reads, and L is the sum of exons in base pairs. Median isoform lengths were used in the
RPKM calculations to be consistent with TCGA analysis methods.
The raw kinase transcript read counts for the 76-bp data were also RPKM
normalized as described for the data above (Mortazavi et al., 2008). The value of “N”
(total number of mappable reads) in the RPKM formula was defined as the total number
of aligned reads minus the duplicate reads. The mean isoform length for each gene was
used in the RPKM calculations.
Mutation Discovery in RNA-seq Data
The possible presence of driver mutations and SNVs in SUM159 was explored by
using the raw 76-bp SUM159 RNA-seq reads from the TCGA. The reads were re-aligned
to the UCSC knownGene mRNA transcripts, but using the computational alignment
possible mutations in the data where sequences aligned, but with mismatches (Li et al.,
2009). Potential mutations that occurred in kinase transcripts were parsed from the pileup
file and filtered using in-house scripts. To check for any nonsynonymous mutations, the
original UCSC knownGene mRNA was translated in the six potential protein-coding
frames and checked for the longest resulting protein starting with the start codon, ATG,
to find the protein-coding region. The position of each mutation was checked to see if it
was found within the coding region and if the mutation caused an amino acid change.
Upon compiling lists of missense and nonsense mutations, the amino acid changes were
13 RESULTS AND DISCUSSION
Transcriptome Profiling of Protein Kinases in Breast Cancer Cell Lines
To characterize protein kinases, we obtained raw Illumina RNA-seq data from the
Johnson Lab for four cell lines: MDA-MB-231 (Claudin-low), BT474 (HER2/Neu),
MCF-7 (luminal B) and HuMEC (TERT-immortalized mammary epithelia). RPKM
normalization was used to characterize the expression of kinases for each cell line at the
level of mRNA transcripts (Midland et al., 2012). The reads were aligned to human
mRNA transcripts from hg19 using Bowtie and the alignment procedure is detailed as
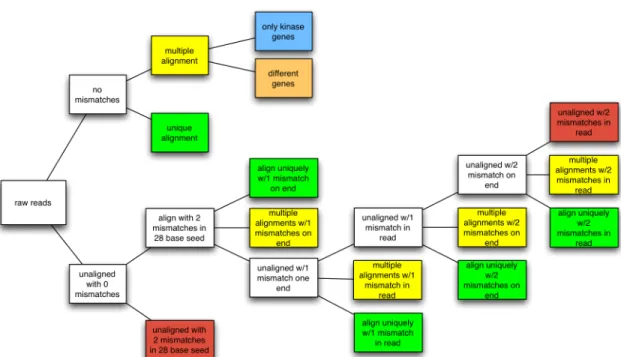
follows (Figure 2.1):
1) Perform alignments of reads allowing for zero mismatches between the read
and the reference sequence.
2) Reads that aligned perfectly AND to only a single kinase gene are assigned to
the “unique alignment” category.
3) Reads that align perfectly, but to multiple reference sequences, are processed to
distinguish between a read that aligned to multiple kinases or multiple isoforms
of a single kinase gene vs. a read that aligns without error to multiple different
genes (including non-kinases).
4) Align with 28 base seed with 2 mismatches allowed (typical default setting)
a) This step serves to filter out reads that cannot be aligned even under
these non-stringent conditions, as they are not included in the further
analyses (Figure 2.1, red boxes).
5) Allow 1 mismatch on the end of the read.
7) Allow 2 mismatches on the end of the read.
8) Allow 2 mismatches in the entire read.
First, reads aligning uniquely to one transcript were outputted (Figure 2.1, green
boxes). The list of reads hitting multiple transcripts were then realigned to the reference
mRNA transcripts (Figure 2.1, yellow boxes). Reads consisting of all “A” or “T”
nucleotides were removed before aligning. The majority of reads aligned to the reference
mRNA transcripts with most reads hitting multiple transcripts. In-house scripts were used
to quantify read counts for kinases. Reads that aligned to one kinase uniquely were
assigned a count of one. The reads aligning to multiple transcripts could hit: 1) different
isoforms of the same kinase, 2) several different kinase genes, 3) a kinase gene and other
genes, 4) or only other non-kinase genes (Figure 2.1, blue and orange boxes; shown only
once as an example, but done for reads in all multiple alignments (Figure 2.1, yellow
boxes)). The read counts that hit different isoforms of the same kinase were summed for
each gene and reads hitting different kinases were given a fraction of a count based on the
number of genes that were hit (Appendix 1). Reads aligning to kinases and other genes
were not included in the analysis. The inclusion of fractional counts did not alter the
overall count data or relative numbers between genes. Kinase genes with at least 50 reads
per lane were summed for each cell line. Then the quantified kinase transcripts were
RPKM normalized using median isoform lengths (Appendix 2).
Somewhat surprisingly, each cell line was found to express approximately
365-385 kinases of the 518 kinases in the human kinome, with little variation in the relative
numbers of kinases in the four lines (Table 2.1, Figure 2.2). Only 5-15 kinases are
15
reads per gene. In BT474 cells, Her2/Neu is highly overexpressed, while in
MDA-MB-231 cells AXL (UFO) is the highest expressed kinase transcript. We are aware of the
possibility that specific mRNAs and proteins may have a low level of expression with
<50 reads per gene. Many kinases are expressed at lower read levels, which suggest their
protein expression is also low. Therefore, the number of kinases captured by MIB/MS at
the protein level is likely greater than the 40-50% we have found using the >50 read
RNA-seq analysis.
Analysis of Kinase Transcripts in TNBC
The TCGA provided us with longer read (76-bp) Illumina RNA-seq data for
MDA-MB-231, SUM159, and a patient Claudin-low tumor. Multiple alignment programs
were assessed before we decided to align reads to the UCSC human knownGene mRNA
from NCBI build 37 (hg19) using Bowtie, allowing just one mismatch per read
(Langmead et al., 2009). Reads were summed for kinase transcripts (Appendix 3). As in
our previous study, we calculated RPKMs to normalize kinase read counts for which
there were greater than 50 reads per gene (Appendix 4) (Mortazavi et al., 2008). We
found better RNA-seq transcriptome coverage of the kinases in this study, finding
400-500 distinct kinases per cell type (Table 2.2, Figure 2.3A and B). The increase in reads is
likely due in part to the longer 76-bp reads compared to the 35-bp and because we started
out with more lanes of raw data: 3-4 lanes per sample, compared to 2 lanes for the
previous cell lines. The patient tumor was found to have the most kinases and had 43
unique kinases, which was much more than we previously found when comparing cell
many different kinds of cells, not just breast cancer cells, so we expect to find more genes
expressed in the sample.
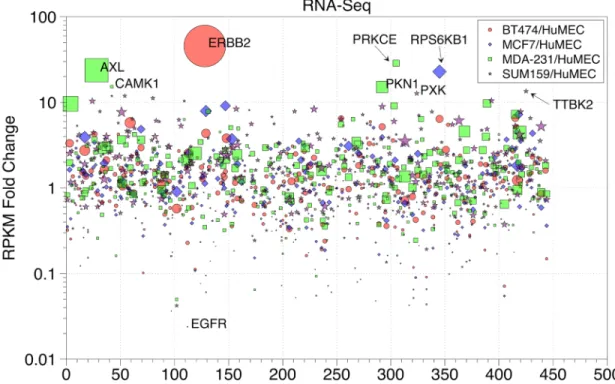
We compared RPKM-normalized RNA-seq data for BT-474, MCF-7,
MDA-MB-231, and SUM159 cell lines to HuMEC and plotted the kinase fold change relative to
HuMECs in alphabetical order (Figure 2.4). The kinase points were scaled relative to the
number of raw read counts, so a point with a large diameter indicates larger numbers of
raw reads. If a cancer cell line kinase RPKM value is greater than the corresponding
HuMEC kinase RPKM value, then the fold change will be greater than one. If the cancer
cell line kinase RPKM value is less than the HuMEC kinase, the fold change is less than
one.
Mutation-Finding in SUM159
Since SUM159 was found to not have any highly overexpressed kinases, we
looked for possible driver mutations and SNVs by reanalyzing the RNA-seq reads. The
alignment program BWA was used to align reads to the UCSC knownGene mRNA
followed by analyses with Samtools to generate a pileup file of mutations (Li et al., 2009;
Li & Durbin, 2009). The mutations that occurred in kinases were parsed from the pileup
file and filtered to only include confident hits. We then wanted to check for any
nonsynonymous mutations that may alter protein function. We translated the original
UCSC knownGene mRNA and found the coding region of the mRNA. Since the position
of each mutation was known, we checked if the mutation fell within the coding region
and if the mutation caused a change in the amino acid that was encoded, which could
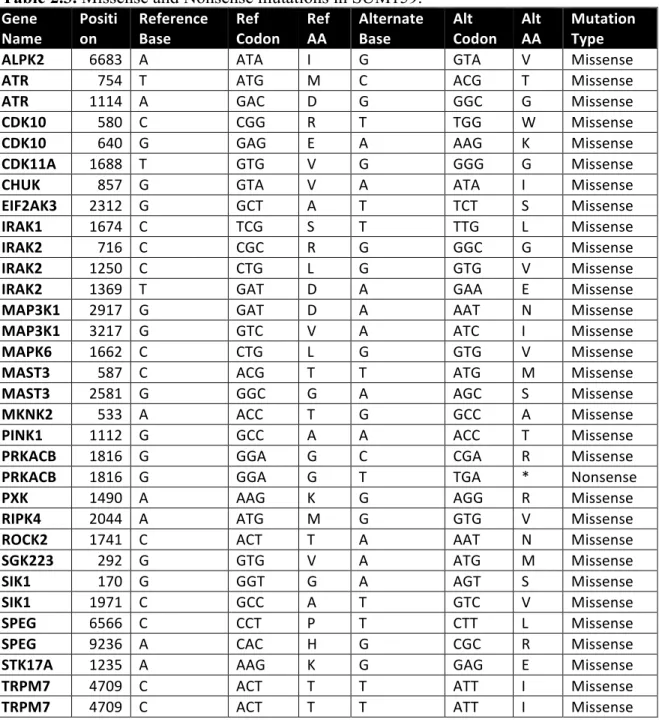
result in a nonsense (stop codon) or missense change (different amino acid). We found 31
17
checking the possible mutations in all isoforms of each kinase, we found that nearly all of
our missense mutations resulted in known natural variant amino acid changes. Therefore,
our analysis did not result in finding any likely driver mutations in SUM159 protein
kinases. A study of somatic mutations of protein kinase genes in 10 different types of
cancer found that breast cancer had a lower prevalence of mutations than cancers that
have a higher turnover or epithelia that is repeatedly exposed to mutagens, such as lung
or colorectal (Greenman et al., 2007). These results suggest that the underlying
mechanism which fuels the behavior of this breast cancer line must derive from more
complex mechanisms than simple driver mutations in kinases and we must therefore
CONCLUSIONS
We have characterized the kinome of several breast cancer cell lines, made
comparisons of the breast cancer kinase transcriptomes to one another, to a control, and
to a patient tumor sample. The broad scope of computational analysis techniques used
here includes the untargeted kinases and not just the handful of kinase genes that are
frequently studied by a majority of kinase research laboratories. Here, we developed
methods to optimize the use of short-read RNA-seq data in order to obtain read counts of
genes and calculate normalized values for large gene lists. We also discussed and
explored how RNA-seq data can be used to find potential driver mutations in a TNBC
cell line.
In principle, our approach is applicable to any RNA-seq data where the analysis is
focused on all gene transcripts, kinase genes, or another set of genes. All cells express
protein kinases and oftentimes in cancer, kinase gene expression is altered or the kinases
have mutations. Many studies have analyzed breast cancer using microarrays, giving
some initial insight into the disease. RNA-seq has the potential to increase our
understanding of how gene expression varies, what mutations are present, and much
more.
Analysis of RNA-seq data remains a challenge and the field does not have a
standard set of methods or experimental design. Computational tools and techniques can
help mine the data and are being increasingly developed as the cost of high-throughput
sequencing decreases. As the cost of sequencing decreases, better experimental design is
possible, allowing for more sample replicates and the application of advanced statistical
19
transcriptome and how it varies between tumors and healthy tissue will not only further
our basic comprehension of cancer, but may also provide clinical targets to treat the
FIGURES AND TABLES
Figure 2.1. Flowchart of Bowtie Alignment Procedure. Multiple levels of
21 Table 2.1. RNA-seq protein kinases per cell line.
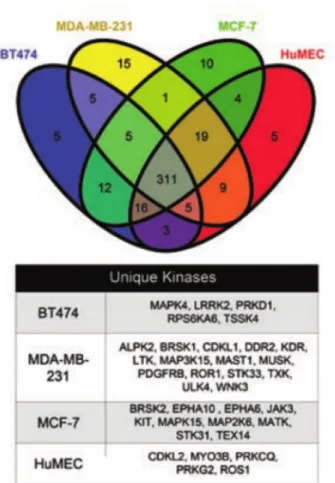
Figure 2.2.Venn Diagram Showing Overlap of Protein Kinase Transcripts
Between Cell Lines. RNA-seq reads for four cell lines were aligned to human genome 19 (hg19) mRNA transcripts using Bowtie. The venn diagram displays the overlap of protein kinases with greater than 50 aligned reads and shows that most kinases were found to be in all cell lines and few kinases were found to be unique to a specific cell line. There are 365-385 total kinases expressed in the four cell lines using this read count threshold. The kinases unique to each cell line are listed in the table below the venn diagram.
23
Table 2.2. RNA-seq protein kinases per TNBC cell type.
Figure 2.3. Venn Diagram and Kinase Tree Showing RNA-seq Coverage.(A) Venn diagram and (B) kinome tree shows kinase expression defined by RNA-seq across patient tumor TNBC and MDA-MB-231 and SUM159 cell lines. 78-88% of the expressed kinome is observed by RNA-seq.
A
25
Figure 2.4. Scatterplot of Cancer Cell Line Kinase RPKM Fold Changes Relative to HuMECs. RPKM values were calculated for kinase genes with greater than 50 read counts for BT-474, MDA-MB-231, MCF-7, and HuMEC RNA-seq data. Kinases are ordered alphabetically along the x-axis and the point sizes were scaled relative to the number of raw read counts; large-diameter points indicate larger numbers of raw read counts. Fold change relative to HuMEC is indicated on the y-axis. Fold change calculations with zero in the denominator (no HuMEC expression) are not shown.
Table 2.3. Missense and Nonsense mutations in SUM159. Gene
Name Position Reference Base Ref Codon AA Ref Alternate Base Alt Codon Alt AA Mutation Type
ALPK2 6683 A ATA I G GTA V Missense
ATR 754 T ATG M C ACG T Missense
ATR 1114 A GAC D G GGC G Missense
CDK10 580 C CGG R T TGG W Missense
CDK10 640 G GAG E A AAG K Missense
CDK11A 1688 T GTG V G GGG G Missense
CHUK 857 G GTA V A ATA I Missense
EIF2AK3 2312 G GCT A T TCT S Missense
IRAK1 1674 C TCG S T TTG L Missense
IRAK2 716 C CGC R G GGC G Missense
IRAK2 1250 C CTG L G GTG V Missense
IRAK2 1369 T GAT D A GAA E Missense
MAP3K1 2917 G GAT D A AAT N Missense
MAP3K1 3217 G GTC V A ATC I Missense
MAPK6 1662 C CTG L G GTG V Missense
MAST3 587 C ACG T T ATG M Missense
MAST3 2581 G GGC G A AGC S Missense
MKNK2 533 A ACC T G GCC A Missense
PINK1 1112 G GCC A A ACC T Missense
PRKACB 1816 G GGA G C CGA R Missense
PRKACB 1816 G GGA G T TGA * Nonsense
PXK 1490 A AAG K G AGG R Missense
RIPK4 2044 A ATG M G GTG V Missense
ROCK2 1741 C ACT T A AAT N Missense
SGK223 292 G GTG V A ATG M Missense
SIK1 170 G GGT G A AGT S Missense
SIK1 1971 C GCC A T GTC V Missense
SPEG 6566 C CCT P T CTT L Missense
SPEG 9236 A CAC H G CGC R Missense
STK17A 1235 A AAG K G GAG E Missense
TRPM7 4709 C ACT T T ATT I Missense
CHAPTER THREE
COMPUTATIONAL APPROACHES TO IDENTIFY BREAST CANCER SUBTYPE SPECIFIC KINOME SIGNATURES USING MIB/MS KINOME
ACTIVATION STATE PROFILING
INTRODUCTION
In parallel with the RNA-seq analyses, our collaborators in Gary Johnson’s lab
helped advance a chemical proteomics technique that couples Multiplexed Inhibitor
Beads (MIBs) with mass spectrometry (MIB/MS) to characterize the activity of
endogenous kinases in cell samples. The approach was shown to quantitate the kinase
activity and drug responsiveness of 50-60% of the expressed kinome (Duncan et al.,
2012). The MIBs are made up of mixtures of specific and pan-kinase inhibitors. While
various laboratories developed aspects of the initial methodology (Bantscheff et al., 2007;
Oppermann et al., 2009), the Johnson Lab extended MIB technology with the use of
multiple inhibitors coupled to beads layered in a column to enrich for lower abundance
kinases. They had observed that more highly abundant kinases and ERK1/2 were
suppressing binding of the less abundant kinases. In studies involving cell lines, Stable
Isotope Labeling by Amino acids in Cell culture (SILAC) is used to isotopically label
proteins for quantitative proteomics. Used along with MIBs and mass spectrometry, the
kinase expression and post-translational modification of up to three cell populations can
A 60 protein proteome signature of differentially expressed proteins was found
for invasive ductal breast carcinoma in three patients using unsupervised principle
components analysis (PCA) applied to liquid chromatography mass spectrometry peptide
fragmentation data (Röwer et al., 2009). The study was a proof of concept to identify
tumor from control samples. The analysis was later further refined using samples from
six patients with 2D gel analysis and mass spectrometry followed by PCA and
hierarchical clustering analyses (Röwer et al., 2011). The follow-up study found a
sub-signature of 20 proteins that still showed effective separation power when identifying
differential protein expression (Röwer et al., 2011). The breast cancer subtypes of the
tumors included in the studies are unclear and the methods used to identify the protein
signatures are far from use in the clinic without further validation.
As we have learned more about biology and with the advent of high-throughput
technologies, researchers have been moving away from the “molecular biology
paradigm” (Bensimon, Heck, & Aebersold, 2012). The paradigm assumes there is a direct
link between gene and protein function with proteins arranged in linear pathways without
any feedback to the upstream proteins (Bensimon et al., 2012). Advancements in
genomics and proteomics enable scientists to reconstruct biological networks that are
more accurate in describing cellular function. Network reconstruction is complicated
because molecular networks are dynamic and not uniform between individuals due to
genetic background, epigenetic changes, differential expression, network reprogramming,
and exogenous signals (Pe’er & Hacohen, 2011). Understanding these differences can
help explain why a targeted therapy can cause different effects in patients with the same
29
response, and potential because basal levels of signals could be indistinguishable between
cancerous and healthy cells (Pe’er & Hacohen, 2011). Obtaining tumor samples is
invasive and difficult, therefore, use of cancer models, such as cell lines, is critical in
studying cell perturbations to construct networks and determine nodes that are viable
drug targets before administering therapies to patients.
Just as gene expression does not always directly correlate with protein expression,
protein expression does not directly translate to protein activity. Using the MIB/MS
technique, we have kinase activity data for several breast cancer cell lines and the C3Tag
genetically engineered mouse model (GEMM), including quantitative data for cells
treated with mitogen-activated protein kinase kinase (MEK) inhibitors. Here, I apply
statistical pattern recognition methods and a multivariate method to the Johnson Lab’s
MIB/MS data to find kinase activity signatures specific to breast cancer subtypes. I also
conducted a preliminary study of methods for constructing simple networks for TNBC
model systems using MIB/MS data as another step towards finding novel targeted
METHODS Data Sources
Our collaborators in the Johnson Lab used SILAC labeling with MIBs and mass
spectrometry to quantify binding of protein kinases in the breast cancer cell lines:
MDA-MB-231, BT474, MCF-7, and SUM159, and a non-cancerous control cell line: HuMEC.
Kinase activity was also profiled in C3Tag mice, a mouse model of TNBC. Quantitative
proteomics time course experiments were conducted for the four cell lines mentioned
above (BT-474, MDA-MB-231, MCF-7, and HuMEC) in response to the EGFR/HER2
inhibitor, lapatinib. MIB/MS was performed on TNBC cells treated with MEK inhibitors
(AZD6244 and U0126) at various time points. SUM159 was also treated with BEZ235,
which targets the kinase MTOR.
Statistical Pattern Finding Techniques
Principle components analysis was performed with Matlab (Version 7.13.0,
R2011b, The Mathworks, Inc., Natick, MA, USA). PCA is applied to data matrices to
extract dominant patterns with goals such as simplification, data reduction, outlier
detection, variable selection, and prediction (Wold, Esbensen, & Geladi, 1987). Our data
matrix here consisted of rows of kinases as “objects” and “variable” columns of different
times of treatment. PCA transforms the data to turn a set of observations of variables that
may correlate into principal components, a set of linearly uncorrelated variables. The first
principal component has the largest variance and subsequent components have the
highest variance, but must be orthogonal to the previous components.
K-means clustering and principle components analysis was conducted with R
31
is a non-hierarchical cluster analysis method. The goal is to partition observations, in this
case kinases, into k clusters where each observation falls into the cluster with the nearest
mean value. The k-means clusters were plotted on the first two PCA principal
components axes (Peeples, 2011).
Clustergram objects were also created and displayed as heat maps with
dendrograms using Matlab. The clustergram function computes hierarchical clustering
with Euclidian distance metric on a data matrix. The method is often applied to gene
expression data with rows being genes and columns are samples. In our case the data
matrix consisted of kinase activity as rows and clustering was computed either across
time for the same sample or across different drug treatments and cell types.
Co-inertia analysis (CIA) was also performed with R (see version above). CIA is
a multivariate method for comparing two different sets of data that measure different
traits in a system. In general, CIA conducts PCA on both data sets and uses the
information from the PCA analysis to identify how the data sets co-vary. The method has
been applied extensively to ecological data and has been applied to link proteomic and
gene expression data (Dray, Chessel, & Thioulouse, 2003; Fagan, Culhane, & Higgins,
2007). We explored the applicability of CIA to two sets of MIB/MS data for drug treated
cells.
Network Construction
Networks were constructed and plotted using Mathematica (Version 8.0, Wolfram
Research Inc., Champaign, IL, USA). The preliminary network analysis involves
identifying correlations between kinases and/or conditions, depending on the orientation
correlation value exceeds a specified threshold and edge lengths are arbitrary. For the
analysis here, we used data for one cell type across several drug conditions and identified
33 RESULTS AND DISCUSSION
MIB/MS Profiling of Protein Kinases
Using layered MIB columns with mass spectrometry (MIB/MS), we found
160-180 unique kinases per cell type or approximately 30% of all kinases and about 40% of
expressed kinases as was found with RNA-seq (Table 3.1). These quantitative values
show that although RNA-seq may show a gene as being expressed, it does not necessarily
mean that there will be detectible protein activity for the corresponding gene.
In the subsequent study focusing on TNBC cells and MEK inhibitor treatments,
we used MIB/MS to capture kinase activation and found approximately 50% of kinases
being expressed by RNA-seq (Table 3.2, Figure 3.1C and D). More kinase activity is
being detected, as the MIB/MS technology is being refined and perfected.
Signature Finding Methods Applied to MIB/MS
To identify potential protein kinases that would fall into breast cancer subtype
specific signatures, principal components analysis (PCA) was applied to time course data
for the initial four cell lines (BT-474, MDA-MB-231, MCF-7, and HuMEC) treated with
lapatinib (Figure 3.2). PCA reduced the dimensionality of the data and the plots show the
variables (in this case, kinases) that are responsible for a large part of the variation in the
data as outliers. HuMEC had the least number of outliers, as we would expect because it
is a non-cancerous control cell line. MCF-7 had the most outliers, but MDA-MB-231 had
outliers that were very far removed from most of the data points. UFO (AXL) is known
to be overexpressed in MDA-MB-231 and appears as one of our outliers (Figure 3.2D).
Very few of the outlier kinases overlapped between cell lines and although some of the
2010). EGFR is a target that has been under investigation to treat TNBC because it is
over-expressed in the Basal-like subtype (Dent et al., 2007; Liedtke et al., 2008). EGFR
is a tyrosine kinase and is found on the cell surface where it binds to particular ligands to
activate downstream signal transduction pathways to control cell differentiation, growth,
proliferation, and survival (Oda et al., 2005). A trial of EGFR inhibition in TNBC, where
a subset of breast cancers were examined by gene expression array before and one week
after therapy, showed that the EGFR pathway was activated in most Basal-like breast
cancers. However, cetuximab, an anti-EGFR monoclonal antibody, inactivated the
pathway in a minority of the cancers (Anders & Carey, 2009). These studies along with
our results suggest that the mechanism that drives this cancer appears to be more complex
and incorporates alternate pathways rather than being caused by one deregulated kinase
and more work must be done to find appropriate targets for treatment.
We similarly applied K-means clustering and PCA to time course data for
SUM159 treated with AZD6244 using a procedure that integrates the two analysis
methods (Peeples, 2011). The times included were 4, 12, and 24 hours of treatment. We
tested 10 cluster solutions and found four to be the optimal number of clusters for the
data from a plot of cluster solutions plotted against the Log of the Sum of Squared Error
(SSE). PCA was conducted on the original data set and samples were plotted on the first
two component axes with the four clusters outlined (Figure 3.3). The plot shows little
overlap between the clusters, meaning they are strong at the level of clustering we
selected and the first two principal components explain 93.84% of the variability. The
outlier kinases from the PCA analysis are labeled on the plot and we found that many of
35
determined by the Johnson Lab’s initial analyses (Duncan et al., 2012). In particular we
found UFO (AXL), JAK1, KCC2G, and PDGFRβ to cluster together and it was
previously found that these kinases all exhibited increased MIB binding. We also found
TESK1 to be in this cluster, but this kinase was not found in the earlier reprogrammed
kinase signature results. In addition, several other kinases, in the fourth cluster on right
side of the figure, including MP2K1, appear to be significant in distinguishing differences
in behavior, but were not previously identified as being part of the published kinase
signature.
We performed hierarchical clustering of the SUM159 treated with AZD6244 time
course data to observe how the kinase activity changed over time (Figure 3.4). Cells were
treated for 4, 12, and 24 hours and kinase activity was profiled for each time point. From
the heatmap generated upon clustering, it is easy to see the reprogramming, or changes in
kinase activity that occur between 4 hours and 12 or 24 hours, that occurs with MEK
inhibition, as was a result of the initial study. For example, groups of kinases shift from
low activity (green) at 4 hours to higher activity (red) over time. The activity of many
kinases shifts depending on the length of inhibitor exposure. Additionally, in the study,
SUM159 and MDA-MB-231 were both treated with AZD6244 and U0126 for 24 hours.
Hierarchical clustering of the data shows that the SUM159 cells treated with each
inhibitor cluster together and the MDA-MB-231 cells cluster together, suggesting that, in
a global sense, kinome response to these two different drugs is more similar within cell
lines than between cell lines (Figure 3.5). Such similarities may not exist when looking at
specific subsets of kinases, where kinase activity may be more similar across drugs than
Co-Inertia Analysis of MIB/MS Data
As a possible signature-finding method, we tested co-inertia analysis to answer
the question of if there were kinase activity differences in SUM159 cells compared to
some sort of control under drug treatments. HuMEC was used as the control because it is
a non-cancerous cell line even though the samples did not receive the same drug
treatments. SUM159 was treated with U0126, AZD6244, and BEZ235, each for 24 hours,
while HuMEC was treated with lapatinib for 4, 24, and 48 hours. Both data sets have the
same number of conditions, but that is not a requirement of CIA. The only requirement
for this method is that the number of rows must be the same. To satisfy this, only kinases
that were found in both cell lines for all of the conditions were included in the
computation.
CIA was performed and resulting kinase “distances” were plotted in transformed
space (Figure 3.6). Looking at the plot, the line between the dots and arrowheads shows
the divergence of the kinase between the data sets. Therefore, a larger divergence
represents a larger difference in the activation of that particular kinase while a shorter line
would represent a smaller divergence and a small difference between the two data sets.
From these results, it appears that SUM159 cells and HuMEC cells differ the most in
EGFR, GAK, and LYN kinase activation. However, the differences do not appear to be
that great considering that the divergence of these kinases are within 3 standard
deviations of the mean of the “distances” between the cell lines. With more accurate data
and data that is more comparable, such as the same drug treatments administered to two
cell lines, the analysis could reveal changes in the kinase activation profiles of each
37 Exploration of Kinase Network Construction
Correlations of kinase activity were calculated across samples SUM159 cells
treated with AZD6244 (4 samples), U0126 (2 samples), BEZ235 (1 sample), and
lapatinib (1 sample). The correlation values were used to construct a network graph
where kinases are nodes and edge connections are formed between kinases if their
correlation was greater than a specified threshold value of 0.5, in this case (Figure 3.7).
This threshold value was chosen because it did not display too much noise in the data and
allowed for quite a few connected. PDGFRB was found to be one of the few highly
connected nodes, so imatinib, an inhibitor that targets PDGFR, could be further explored
as a treatment option.
Network analysis was also applied to MIB/MS data from C3Tag mouse samples
treated with AZD6244. Again, correlation values were used to construct a network graph
(Figure 3.8). For this example, connections between kinases were included if their
correlation was greater than a threshold of 0.85. A larger value was chosen because there
are many more correlations compared to SUM159, so a higher number had to be chosen
for nodes to be visible in the graph. Even with this higher cutoff value, it is difficult to
see specific nodes that are highly connected. It appears that the network may have
underlying subnetworks, which is something we could explore further especially as we
CONCLUSIONS
We have explored the application of statistical signature-finding methods and
network analyses to MIB/MS data for various breast cancer cells treated with kinase
inhibitors. Since we did not have access to many samples, it is difficult to draw concrete
conclusions from the results. As we add more data, it will open doors for more
complicated multivariate analyses and further refinement of our signature-finding
methods. We are hoping to gather more data for the cell lines included in our study from
the ArrayExpress Archive (http://www.ebi.ac.uk/arrayexpress/), particularly to add to the
CIA. An interesting future analysis would be comparisons of MIB/MS activity to
RNA-seq expression values using CIA. This study would depend on obtaining RNA-RNA-seq data
for inhibitor-treated cells. Many computational-experimental strategies exist to construct
network models depending on what data is available. While the effects of cancer drug are
difficult to predict because crosstalk and feedback are complicated processes, network
construction will help us learn how the mechanism functions. The networks presented
here may provide a set of initial hypotheses for further investigation, potential therapeutic
39 FIGURES AND TABLES
Table 3.1. MIB/MS captured protein kinases per cell line.
41
Figure 3.1. Venn Diagram and Kinase Tree Showing MIB/MS Coverage.(A) Venn diagram and (B) kinome tree showing kinases captured and identified by MIB-based proteomics across patient tumor TNBC and MDA-MB-231 and SUM159 cell lines. MIB/MS captures 50-60% of the expressed kinome as observed by RNA-seq (compare to Figure 2.3).
A
43
PCA showing K-means Clusters
Figure 3.4. Hierarchical Clustering Analysis of SUM159 Time Course Treated with AZD6244. This dendrogram and heat map displays how the kinase activity shifts from 4 to 12 and 24 hours, showing how kinase activity does not remain suppressed or stable with prolonged inhibitor treatment. Green corresponds to low activity and red corresponds to high activity.
45
Figure 3.6. Results of CIA Analysis Comparing SUM159 to HuMEC. Plot of kinase “distances” in transformed space. Each number represents a kinase and corresponds to a pair of points. The dot at one end of the line represents the
47
Figure 3.7. SUM159 Kinase Network. This network diagram shows connections of correlated kinases for SUM159 treated with AZD6244, U0126, BEZ235, and lapatinib surpassing a correlation threshold of 0.5. Node weight corresponds to average
Figure 3.8. C3Tag Kinase Network. This network diagram shows connections of correlated kinase activity for C3Tag mice treated with AZD6244, surpassing a correlation threshold of 0.85.
CHAPTER FOUR
KINOME DB: KINOME DATABASE
INTRODUCTION
As described in Chapter 1, protein kinases are integral to cellular signaling and
deregulation or overexpression of the genes can lead to many diseases, including cancer.
There are approximately 518 kinases in the human kinome and many inhibitors are
administered clinically or are being studied to treat cancers. Given the importance of
protein kinases to disease, one would think there are many available resources to aid in
the study of kinases. However, this is not the case and most existing kinase-centered
websites have turned into non-working links, have not been updated in years, or are not
easy to use. For example, the Protein Kinase Resource, an academic site with kinase
sequence and structural information, appears to have last been updated in 2006 (Niedner
et al., 2006; Smith et al., 1997). Since 1999, kinase.com and kinbase have been
maintained by Sugen and the Salk Institute to support their publications (Manning,
Whyte, Martinez, Hunter, & Sudarsanam, 2002). Like the Protein Kinase Resource,
kinbase also has sequence and protein information, but the kinbase pages are not easy to
navigate and appear unorganized.
Existing websites do not display any information specific to cell types, kinase
inhibitors, or any experimental data that is relevant to kinases. There are a few projects
information for all genes or proteins. Since the websites cover the entire genome, they are
fairly generic and still do not have any experimental data. As the volume of
high-throughput data increases, there is a need for data organization, storage, and accessibility.
Some publications require data to be made available in a supplement. However, given the
amount of data that is generated in next generation sequencing experiments, it is often
impossible for raw data to be available for download and difficult to recreate analysis
results.
Here, we present a new kinome database: Kinome DB that has information about
all 518 human protein kinases. Our database currently has a focus on breast cancer and
has descriptions for cell types, kinase inhibitors, and real experimental RNA-seq and
MIB/MS data. The website includes all experimental conditions used and plots of the
data with the processed data available for download. We hope to collaborate with other
kinase researchers to make more high-throughput data publically available and that the
51 METHODS
Data Sources
Uniprot names and accession numbers were compiled from the Universal Protein
Resource (www.uniprot.org). Protein kinase names, Entrez ID’s, and alternative names
were compiled from the NCBI Gene website. The kinase family tree image on the
homepage was from Cell Signaling Technology (www.cellsignal.com). Information
about cell types and inhibitors were found in publications, on breast cancer cell line
information websites, and on PubChem. Experimental MIB/MS data is from studies
conducted by the Johnson Lab at UNC. Raw RNA-seq data was also generated by the
Johnson Lab or from collaborators the TCGA and processed as described in Chapter 1,
above.
Website Development
Programming was completed in the integrated development environment Eclipse
(www.eclipse.org) along with the Python plugin, PyDev. All data for Kinome DB is
stored in a MySQL database. MySQL is an open source relational database management
system. The open source tool phpMyAdmin was used for the administration of the
MySQL database. phpMyAdmin can be used to create, modify, and delete databases,
tables, fields, and rows, so it was useful whenever we needed to drop data tables to reload
data. A Python script is used populate the MySQL database directly from csv
(comma-separated values) files.
The open source Python web framework Django (www.djangoproject.com) was
used for back-end website development. Django uses the model-view-controller design
front-end webpage development (http://twitter.github.com/bootstrap/). Matplotlib, a
plotting library, was used for plotting data on the website
53 RESULTS AND DISCUSSION
Data Compilation
Initially, our collaborators in the Johnson Lab provided us with a list of kinase
Uniprot abbreviations and accession numbers. Then, corresponding kinase gene names
and alternate names were found on the NCBI Gene website. Many of the kinase names
have changed since we first compiled the data, so a lot of manual checking was necessary
to get an up-to-date and accurate list. The Uniprot accession and the Entrez gene ID
values seem to be stable. Cell type information was found in online resources and
inhibitor information was compiled from studies or PubChem (Anastassiadis, Deacon,
Devarajan, Ma, & Peterson, 2011; Karaman et al., 2008). All RNA-seq and MIB/MS
proteomics experimental data included in the database has been described in the
preceding chapters (Chapters 2 and 3).
Database Population
Data is loaded into the MySQL database using a Python script from csv files. This
enables ease of data compilation because researchers usually store data in tables using
programs such as Microsoft Excel. Each csv column corresponds to a column in the
MySQL table. MySQL assigns a number as the primary key for tables, so tables can
easily be connected using other data values as foreign keys and the connected table’s
primary key will be displayed in the new table.
Webpage Construction and Design
The main component files in Django are models.py, views.py, and urls.py. We
used a load_data.py script to load data into MySQL tables. The table structures are
character field, text field, decimal field, foreign key, or other table connection and so on.
A slug is a short label and only contains letters, numbers, underscores, or hyphens. The
slug is typically used in uniform resource locators (URLs). Functions to call aspects in
specific models are contained in views.py and each view function is connected to an html
template file. Slugs are defined in each view and used by urls.py for each page’s web
URL.
Each view specific html file extends a base template that contains links to style
sheets, the code for the sidebar with links, and the footer information. That way, this code
does not need to be on every page. We used front-end components from twitter bootstrap
(http://twitter.github.com/bootstrap/). Twitter bootstrap is a free collection of tools for
creating websites and web applications including HTML and CSS-templates for buttons,
typography, forms, and other web interface parts. We wanted a clean and simple design
that was easy to navigate.
Kinome DB Informational Webpages
The Kinome DB homepage displays a short description of the website, the Cell
Signaling kinase family tree, and a sidebar with several links to other pages on our site.
Each family section of the tree links to the corresponding family information page. The
sidebar has a link for the homepage at the top, followed by several categories with links:
Kinases, Families, Cell Types, Inhibitors, Experiments, MIB/MS, RNA-seq, and Data
(Figure 4.1). There is also a search box that allows users to query aspects on the site,
which will be explained in more detail below.
The Kinases link in the sidebar directs users to a page with a list of all 518 human