Incremental Benefit of a Home Visit Following Discharge
for Patients with Multiple Chronic Conditions Receiving
Transitional Care
Carlos Jackson, PhD,1Elizabeth W. Kasper, MSPH,2 Christianna Williams, PhD,3and C. Annette DuBard, MD, MPH1
Abstract
Transitional care management is effective at reducing hospital readmissions among patients with multiple
chronic conditions, but evidence is lacking on the relative benefit of the home visit as a component of transitional
care. The sample included non-dual Medicaid recipients with multiple chronic conditions enrolled in Community
Care of North Carolina (CCNC), with a hospital discharge between July 2010 and December 2012. Using claims
data and care management records, this study retrospectively examined whether home visits reduced the odds of
30-day readmission compared to less intensive transitional care support, using multivariate logistic regression to
control for demographic and clinical characteristics. Additionally, the researchers examined group differences
within clinical risk strata on inpatient admissions and total cost of care in the 6 months following hospital discharge.
Of 35,174 discharges receiving transitional care from a CCNC care manager, 21% (N
=
7468) included a home
visit. In multivariate analysis, home visits significantly reduced the odds of readmission within 30 days (odds
ratio
=
0.52, 95% confidence interval 0.48–0.57). At the 6-month follow-up, home visits were associated with fewer
inpatient admissions within 4 of 6 clinical risk strata, and lower total costs of care for highest risk patients (average
per member per month cost difference $970;
P
<
0.01). For complex chronic patients, home visits reduced the
likelihood of a 30-day readmission by almost half compared to less intensive forms of nurse-led transitional care
support. Higher risk patients experienced the greatest benefit in terms of number of inpatient admissions and total
cost of care in the 6 months following discharge. (Population Health Management
2016;19:163–170)
Introduction
P
revention of hospital readmissions has become ahigh priority for health care payers and providers in re-cent years. A variety of ‘‘transitional care’’ approaches have been implemented across the country to improve care for patients in the period following hospital discharge and reduce the likelihood of medical complications that lead to hospital readmission. Elements of transitional care vary, but may in-clude improved discharge planning, coordination with com-munity providers, patient education, and follow-up contact by a pharmacist or nurse care manager after discharge.1,2
Although current evidence strongly supports the effec-tiveness of transitional care models in reducing read-missions, less is known about the benefits of individual
components of transitional care and which patients are most likely to benefit.3In particular, few studies have rigorously evaluated the added benefit of an in-person home visit for patients transitioning from the hospital, although existing studies indicate a positive effect. In one randomized con-trolled trial of elderly patients, in-person home visits from an advanced practice nurse during the 4 weeks after hospital discharge delayed the time to a first readmission and re-duced the number of multiple readmissions compared to similar patients receiving routine discharge planning.4In a pair of studies of patients with chronic congestive heart failure, those patients who received home visits within 7 to 14 days of discharge had fewer unplanned readmissions and longer survival.5Home visits may provide unique opportu-nities to identify and address issues that prevent a smooth
1Community Care of North Carolina, Raleigh, North Carolina. 2
Independent Contractor.
3Cecil Sheps Center for Health Services Research, University of North Carolina at Chapel Hill, Chapel Hill, North Carolina.
ªThe Author(s) 2015; Published by Mary Ann Liebert, Inc. This Open Access article is distributed under the terms of the Creative Commons Attribution Noncommercial License (http://creativecommons.org/licenses/by-nc/4.0/) which permits any noncommercial use, distribution, and reproduction in any medium, provided the original author(s) and the source are credited.
Mary Ann Liebert, Inc. DOI: 10.1089/pop.2015.0074
transition from the hospital. At a home visit, a care manager may gather vital medication use information; educate pa-tients and families about events surrounding the hospitali-zation, management of acute or chronic conditions, and warning signs of decline; assure that patients are well pre-pared for follow-up appointments; and identify social or environmental concerns.6However, there are a number of less intensive components of transitional care that may satisfactorily meet the needs of patients at less cost, in-cluding a bedside visit by a nurse care manager while the patient is still in the hospital, checking in with the patient during the primary care follow-up appointment, coordina-tion of services behind the scenes, telephone contact, or written correspondence. Although most would expect there to be some ‘‘drop-off’’ in effectiveness with these less in-tensive activities, the question remains whether home visits yield sufficiently greater benefit to justify the additional resource investment.
North Carolina’s medical home program for Medicaid beneficiaries, Community Care of North Carolina (CCNC), has demonstrated success in reducing readmissions among bene-ficiaries with complex chronic medical conditions through a multifaceted transitional care program that emphasizes com-munication and timely follow-up with a patient’s primary care medical home after discharge, comprehensive medication management, patient and caregiver education, and face-to-face contact by a nurse care manager for high-risk patients.6 Prior evaluation demonstrated a 20% reduction in risk of readmission over the year following discharge among pa-tients who received any degree of transitional care man-agement support.7 Another study demonstrated the benefit of timely outpatient follow-up for the highest risk patients.8 The present study sought to determine whether an in-person home visit by a nurse care manager yielded measurable benefit above and beyond less intensive components of transitional care performed by the care manager. Specifi-cally, the researchers conducted a retrospective analysis of care management data and Medicaid claims, controlling for patient and hospital characteristics, to examine 30-day readmission rates and 6-month cost and utilization outcomes for patients who received a home visit compared to those who received transitional care support that did not include a home visit.
Methods
Selection of sample
Eligible patients were discharged from a North Carolina hospital between July 1, 2010, and December 31, 2012, with the hospitalization paid by North Carolina Medicaid. Patients had to be Medicaid eligible for at least 1 month prior to admission and at least 90 days post discharge; and not dually enrolled in Medicare during the follow-up period. Patients living in a 5-county region with a capitated behav-ioral health care waiver were excluded because of incomplete data on psychiatric hospitalizations. Patients were identified as having multiple chronic or catastrophic conditions by 3M’s Aggregated Clinical Risk Group9 classification system in analysis of all Medicaid claims history 2010–2012. Eligible discharges excluded obstetric and newborn hospitalizations, and required that the patient was discharged to home with either self-care or home health services.
There were 120,039 discharges meeting these criteria. For patients having more than 1 eligible discharge, the re-searchers selected the first discharge and additional dis-charges that were at least 90 days apart. This resulted in the selection of 86,462 index discharges. Of these, 53,197 dis-charges were for individuals enrolled in CCNC and there-fore eligible to receive the transitional care intervention. Of these, 38,904 discharges received some form of transitional care support by a CCNC staff member. (Components of the CCNC transitional care management program, and the frequency with which specific component interventions were delivered during the time period of this study, have been described previously.6) For the present analysis, these discharges were divided into 2 mutually exclusive groups based on the type of transitional care received. The ‘‘Home Visit’’ group (N=7468) comprised those who received an in-person visit any time between the date of their index ad-mission and 30 days post discharge or readad-mission if read-mitted within 30 days. Patients who did not receive a home visit but did receive less intensive transitional care services comprised the ‘‘Other Transitional Care’’ comparison group (N=27,706). Index discharges for patients who received care management services initiated between 30 and 90 days post discharge, and those whose initial care management service occurred within 30 days after a readmission, were excluded from all analyses (N=3730).
The primary outcome of interest was readmission within 30 days of the index discharge, identified in claims with dates of service through March 31, 2013, paid by June 30, 2013. Readmissions on the same day as the index discharge and those for obstetrics or newborn were excluded. Sec-ondary outcomes were total inpatient admissions and total Medicaid costs per member per month over the 6-month period following index discharge.
For assessment of these outcomes, patients were stratified into 6 categories of readmission risk associated with their Clinical Risk Group (CRG). Developed by 3M Health In-formation Systems, CRGs use a hierarchical model to assign patients into 1 of 1075 mutually exclusive CRGs based on historical claims data. The average 90-day readmission rate among patients in each of the 1075 CRGs during a 5-year period determined the expected readmission rate for study patients within the same CRG. Further details about this methodology have been described previously.8
Data sources and control variables
Data regarding patient demographic characteristics and enrollment in Medicare, Medicaid, and CCNC came from the North Carolina Medicaid eligibility and enrollment files. Costs, utilization, pharmacy fills, clinical characteristics, and medical history measures were derived from paid Med-icaid claims. Information regarding the transitional care intervention was recorded according to standardized docu-mentation protocols in CCNC’s care management infor-mation system.
statistical control of differences between the intervention groups.
Statistical analysis
The Home Visit and Other Transitional Care groups were compared on all covariates using logistic regression, with Home Visit vs. Other Transitional Care as the dependent variable and each covariate as the single independent vari-able. Logistic regression also was used to estimate odds ratios (ORs) for the Home Visit compared to Other Tran-sitional Care, with 30-day readmission as the dependent variable, controlling for patient demographic characteristics, patient medical history, and characteristics of the index hospitalization. All analyses account for the correlation among discharges for the same client using generalized estimating equations, specifying an exchangeable correla-tion matrix to obtain robust parameter estimates and stan-dard errors.
Secondary analyses examined the incremental impact of a home visit on number of inpatient admissions during the
6-month follow-up period using negative binomial regres-sion, and total Medicaid costs using linear regression. These analyses were limited to the first index admission for each patient. Both models controlled for the same covariates as the primary analysis. Both outcome variables were con-verted to an average per month based on number of eligible months during the 6-month follow-up period. Total Med-icaid costs were log-transformed in the linear regression model. All analyses were conducted using SAS 9.2 (SAS Institute, Inc., Cary, North Carolina).
Results
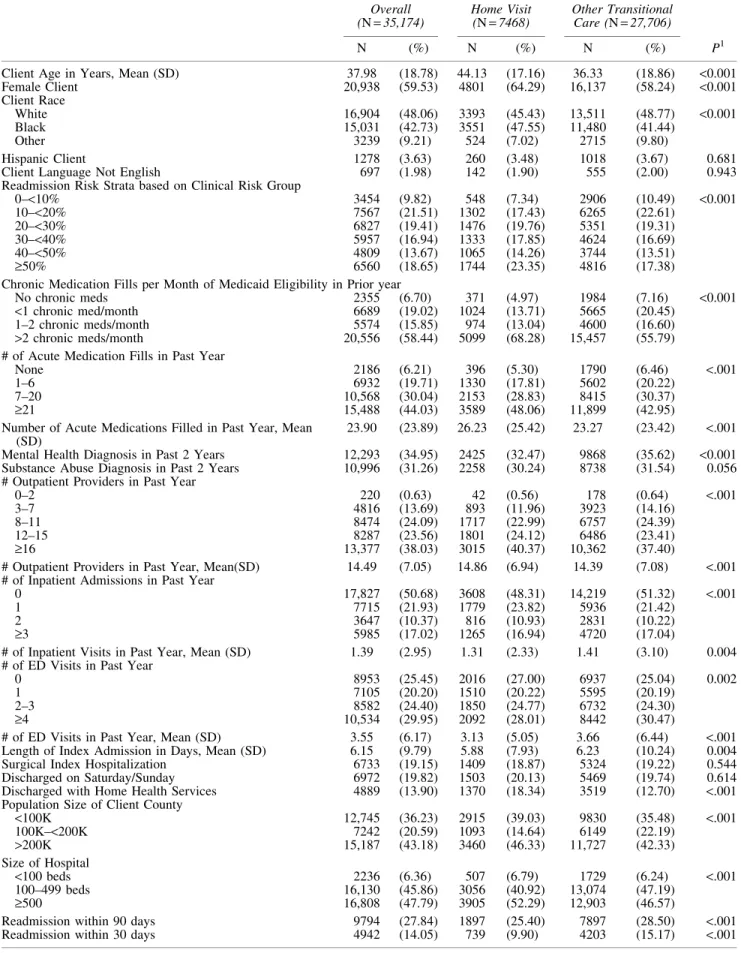
There were a total of 35,174 qualifying discharges among 26,647 patients who received CCNC transitional care during the study period. Transitional care included a home visit for 7468 of these discharges. Table 2 describes the sample of discharges, overall and by treatment group (Home Visit vs. Other Transitional Care). The 2 groups differ on many characteristics, with those receiving a home visit being older, more likely to be female, and more likely to be black.
Table 1. Description of Covariates
Measure Description
Patient Demographic Characteristics
Sex Male is reference group Age Age in years at index discharge
Race White, Black, Other (White as reference group); other includes small number unreported
Ethnicity Hispanic vs. non-Hispanic Primary Language English vs. Other
Population Size of Client County As of July 2010:<100K, 100K–199,999, 200K+
Medicaid Eligibility Months of Medicaid eligibility in the pre period. Most patients had 12 months of Medicaid eligibility, so variable was dichotomized as 1–11 months or 12 months Patient Medical History
History of Mental Illness Any paid claim with a mental health diagnosis as a primary diagnosis in the 2 years prior to index admission date (ICD-9 code 295.xx,296.xx,298.xx)
History of Substance Abuse Any paid claim with substance abuse as primary or any discharge diagnosis in the 2 years prior to index admission date (ICD-9 code 303.xx, 304.xx, 305.xx Except for 305.1x)
Prior Hospitalizations Number of Inpatient visits in the year prior to index admission date, categorized as 0,1,2,3 or more
Prior ED Visits Number of ED visits in the year prior to index admission date, categorized as 0,1,2– 3, 4 or more
Outpatient Providers Number of distinct outpatient providers in the year prior to index admission date, categorized as 0–2, 3–7, 8–11, 12–15, 16 or more
Chronic Medications Filled Number of medication fills for chronic medications per month of Medicaid eligibility in the year prior to index admission
Acute Medications Filled Number of medication fills for acute medications in the year prior to index admission date, categorized as 0,1–6,7–20, 21+
Characteristics of Index Hospitalization
CRG Risk Strata Each discharge was assigned to a risk strata based on the patient’s CRG. Historical data were used to provide benchmark readmission rates for each CRG. These were then divided into 6 strata based on expected rate of readmission associated with those CRGs.
Medical or Surgical Admission Based on DRG, index discharge was categorized as medical or surgical, medical as reference group
Hospital Size Number of hospital beds,<100, 100–499, and 500+beds Length of Stay Length of Index hospital stay in days
Weekend Discharge Discharged on Saturday or Sunday
Home Health Services Discharged to home with home health services
Table 2. Description of Study Population (N=35,174discharges)
Overall (N=35,174)
Treatment Group
P1 Home Visit
(N=7468)
Other Transitional Care (N=27,706)
N (%) N (%) N (%)
Client Age in Years, Mean (SD) 37.98 (18.78) 44.13 (17.16) 36.33 (18.86) <0.001
Female Client 20,938 (59.53) 4801 (64.29) 16,137 (58.24) <0.001
Client Race
White 16,904 (48.06) 3393 (45.43) 13,511 (48.77) <0.001
Black 15,031 (42.73) 3551 (47.55) 11,480 (41.44)
Other 3239 (9.21) 524 (7.02) 2715 (9.80)
Hispanic Client 1278 (3.63) 260 (3.48) 1018 (3.67) 0.681
Client Language Not English 697 (1.98) 142 (1.90) 555 (2.00) 0.943
Readmission Risk Strata based on Clinical Risk Group
0–<10% 3454 (9.82) 548 (7.34) 2906 (10.49) <0.001
10–<20% 7567 (21.51) 1302 (17.43) 6265 (22.61)
20–<30% 6827 (19.41) 1476 (19.76) 5351 (19.31)
30–<40% 5957 (16.94) 1333 (17.85) 4624 (16.69)
40–<50% 4809 (13.67) 1065 (14.26) 3744 (13.51)
‡50% 6560 (18.65) 1744 (23.35) 4816 (17.38)
Chronic Medication Fills per Month of Medicaid Eligibility in Prior year
No chronic meds 2355 (6.70) 371 (4.97) 1984 (7.16) <0.001
<1 chronic med/month 6689 (19.02) 1024 (13.71) 5665 (20.45)
1–2 chronic meds/month 5574 (15.85) 974 (13.04) 4600 (16.60)
>2 chronic meds/month 20,556 (58.44) 5099 (68.28) 15,457 (55.79)
# of Acute Medication Fills in Past Year
None 2186 (6.21) 396 (5.30) 1790 (6.46) <.001
1–6 6932 (19.71) 1330 (17.81) 5602 (20.22)
7–20 10,568 (30.04) 2153 (28.83) 8415 (30.37)
‡21 15,488 (44.03) 3589 (48.06) 11,899 (42.95)
Number of Acute Medications Filled in Past Year, Mean (SD)
23.90 (23.89) 26.23 (25.42) 23.27 (23.42) <.001
Mental Health Diagnosis in Past 2 Years 12,293 (34.95) 2425 (32.47) 9868 (35.62) <0.001 Substance Abuse Diagnosis in Past 2 Years 10,996 (31.26) 2258 (30.24) 8738 (31.54) 0.056 # Outpatient Providers in Past Year
0–2 220 (0.63) 42 (0.56) 178 (0.64) <.001
3–7 4816 (13.69) 893 (11.96) 3923 (14.16)
8–11 8474 (24.09) 1717 (22.99) 6757 (24.39)
12–15 8287 (23.56) 1801 (24.12) 6486 (23.41)
‡16 13,377 (38.03) 3015 (40.37) 10,362 (37.40)
# Outpatient Providers in Past Year, Mean(SD) 14.49 (7.05) 14.86 (6.94) 14.39 (7.08) <.001 # of Inpatient Admissions in Past Year
0 17,827 (50.68) 3608 (48.31) 14,219 (51.32) <.001
1 7715 (21.93) 1779 (23.82) 5936 (21.42)
2 3647 (10.37) 816 (10.93) 2831 (10.22)
‡3 5985 (17.02) 1265 (16.94) 4720 (17.04)
# of Inpatient Visits in Past Year, Mean (SD) 1.39 (2.95) 1.31 (2.33) 1.41 (3.10) 0.004 # of ED Visits in Past Year
0 8953 (25.45) 2016 (27.00) 6937 (25.04) 0.002
1 7105 (20.20) 1510 (20.22) 5595 (20.19)
2–3 8582 (24.40) 1850 (24.77) 6732 (24.30)
‡4 10,534 (29.95) 2092 (28.01) 8442 (30.47)
# of ED Visits in Past Year, Mean (SD) 3.55 (6.17) 3.13 (5.05) 3.66 (6.44) <.001 Length of Index Admission in Days, Mean (SD) 6.15 (9.79) 5.88 (7.93) 6.23 (10.24) 0.004
Surgical Index Hospitalization 6733 (19.15) 1409 (18.87) 5324 (19.22) 0.544
Discharged on Saturday/Sunday 6972 (19.82) 1503 (20.13) 5469 (19.74) 0.614
Discharged with Home Health Services 4889 (13.90) 1370 (18.34) 3519 (12.70) <.001 Population Size of Client County
<100K 12,745 (36.23) 2915 (39.03) 9830 (35.48) <.001
100K–<200K 7242 (20.59) 1093 (14.64) 6149 (22.19)
>200K 15,187 (43.18) 3460 (46.33) 11,727 (42.33)
Size of Hospital
<100 beds 2236 (6.36) 507 (6.79) 1729 (6.24) <.001
100–499 beds 16,130 (45.86) 3056 (40.92) 13,074 (47.19)
‡500 16,808 (47.79) 3905 (52.29) 12,903 (46.57)
Readmission within 90 days 9794 (27.84) 1897 (25.40) 7897 (28.50) <.001
Readmission within 30 days 4942 (14.05) 739 (9.90) 4203 (15.17) <.001
Those in the Home Visit group also tended to be in higher risk CRGs, have more outpatient providers and more med-ication fills in the past year, and were more likely to be discharged with home health services than those receiving less intensive forms of transitional care. Although the av-erage number of inpatient admissions and emergency de-partment (ED) visits in the past year were slightly lower for the Home Visit group, a slightly lower proportion had no inpatient admissions in the prior year. There were a total of 4942 readmissions within 30 days (14.1%), with read-missions less common in the Home Visit group (9.9% vs. 15.2%,P<0.001) in unadjusted analysis.
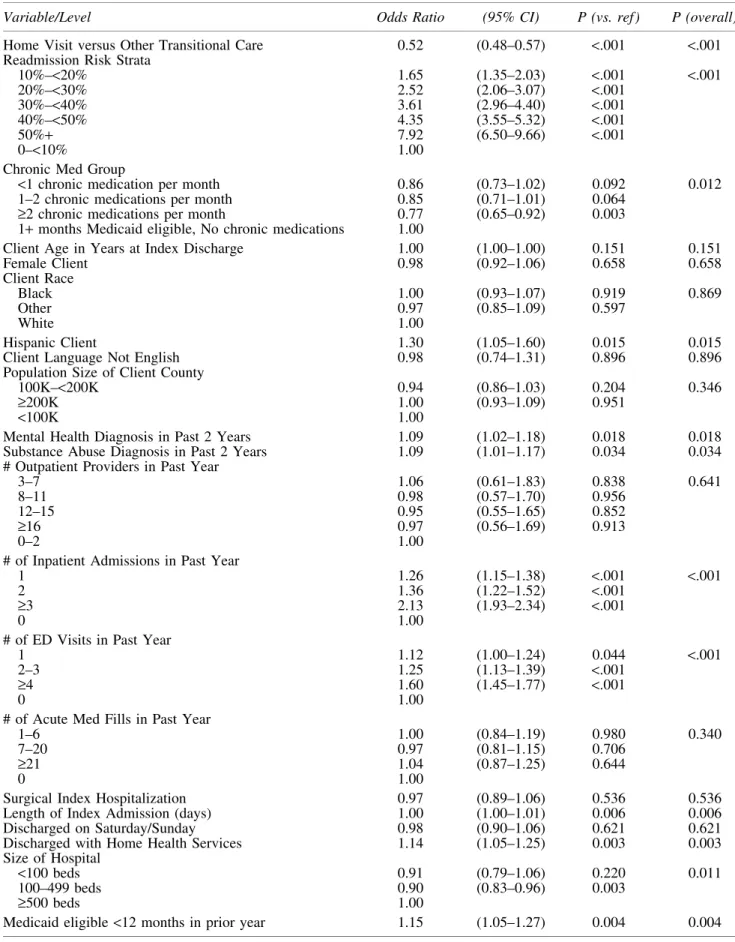
Multiple logistic regression analysis demonstrated a strong, statistically significant reduction in the odds of 30-day readmission for those who received a home visit com-pared to other transitional care (OR=0.52, 95% confidence interval [CI]=0.48–0.57,P<0.001) (Table 3). As expected, patients in higher-risk CRGs, and those with a history of inpatient and ED visits in the past year, had a greater like-lihood of a 30-day readmission. Because being discharged with home health services was associated with greater readmission risk as well as greater likelihood of a home visit under the CCNC transitional care program, a sensitivity analysis was conducted excluding patients discharged to home health services, with virtually no change in the results (OR=0.53, 95% CI=0.48–0.59, P<0.001). Additionally, when excluding patients who were readmitted before rea-sonable time had passed to conduct a home visit (7 days post discharge), the effect was reduced yet still clinically and statistically significant (OR=.70, 95% CI=0.64–0.77,
P<0.001).
Table 4 presents the results of additional analyses related to inpatient admissions and total cost of care in the 6-month follow-up period. Results of the negative binomial analyses, controlling for each of the covariates listed in Table 1, showed statistically significant reductions in inpatient ad-missions in the follow-up period for 4 of the 6 clinical risk strata, with the others approaching significance. The ob-served reduction in inpatient utilization was incrementally greater with increasing clinical risk. In the linear regression analysis, home visits also were associated with a trend to-ward lower total per member per month costs in the 6 months following discharge in all but the lowest risk stratum, with the magnitude increasing with clinical risk. However, this cost difference reached statistical significance only for the highest risk strata (average monthly cost dif-ference $970, chi-square=14.94, P<0.001). This finding remained significant even when excluding patients dis-charged with home health services, and excluding those readmitted within 7 days of discharge.
Discussion
Although considerable attention has focused on accu-rately refining the ability to predict which patients are most likely to be readmitted, there is a need to move beyond more accurate prediction of high-risk patients to more accurate prediction of impactable patients, with a greater focus on directing specific care management interventions to those patients who are most likely to benefit. Health care orga-nizations have implemented a variety of strategies to im-prove care transitions following hospital discharge, which
may vary in resource intensity from improved discharge planning processes in the hospital setting, to telephonic follow-up after discharge, to multidisciplinary care team approaches with face-to-face contact in the patient’s home. The researchers have previously described that the effec-tiveness of transitional care management, broadly defined to include any form of transitional care support beyond usual care, varies according to the clinical complexity of the pa-tient, with highest risk patients yielding the greatest benefit in terms of reduced rehospitalizations over the subsequent year.7 The present study further refines our understanding of the incremental value of the home visit as a component of transitional care, and which patients can be expected to benefit the most from this relatively resource-intensive intervention.
This evaluation found that receiving a home visit from a care manager after hospital discharge substantially reduced 30-day readmission rates for patients with multiple chronic conditions, by approximately half, beyond less intensive forms of transitional care. The impact of the transitional care home visit on total admissions and total Medicaid costs over the 6-month follow-up period varied by clinical risk. In the extreme example, for every 100 patients in the highest risk group who received a home visit, 37 additional admissions were averted in the 6 months after discharge, and total Medicaid costs were reduced by $581,800. In contrast, al-though future admissions were modestly reduced for the lowest risk group (2 admissions averted for every 100 pa-tients over 6 months), total costs of care were higher. Generally, the association between home visits and reduc-tions in future hospitalizareduc-tions and total costs was greater as the patient’s clinical complexity and underlying risk of readmission increased. For patients with an inherent risk of readmission >30%, home visits were associated with a 6-month reduction in total Medicaid costs in excess of $2000 per patient. Patients in this highest risk group are characterized by having 3 or more serious chronic medical conditions, typically including advanced coronary artery disease, chronic obstructive pulmonary disease, chronic re-nal failure, congestive heart failure, diabetes, ischemic vascular disease, or a history of organ transplant, dialysis, or total parenteral nutrition.
The incremental cost of a home visit as a component of transitional care management will vary by setting, but the effect estimates in Table 4 should provide a useful heuristic for program planners. Although formal cost-savings analysis was beyond the scope of this study, it is known that inter-vention costs may vary widely, related to geographic vari-ation in salary for care team members and travel distance to the patient’s home. The CCNC transitional care program was built on the existing care management infrastructure, including a locally embedded multidisciplinary care team workforce, existing relationships with primary care provid-ers and hospitals in local communities, and a statewide informatics platform and care management information system. This infrastructure provides economies of scale that may not translate to other environments. In any setting, a positive return on investment for home visits is much more likely if intelligently targeted toward higher risk patients.
Table 3. Results of Logistic Regression Analyses Predicting Likelihood of a30-day Readmission
Variable/Level Odds Ratio (95% CI) P (vs. ref) P (overall)
Home Visit versus Other Transitional Care 0.52 (0.48–0.57) <.001 <.001 Readmission Risk Strata
10%–<20% 1.65 (1.35–2.03) <.001 <.001 20%–<30% 2.52 (2.06–3.07) <.001
30%–<40% 3.61 (2.96–4.40) <.001 40%–<50% 4.35 (3.55–5.32) <.001
50%+ 7.92 (6.50–9.66) <.001
0–<10% 1.00
Chronic Med Group
<1 chronic medication per month 0.86 (0.73–1.02) 0.092 0.012 1–2 chronic medications per month 0.85 (0.71–1.01) 0.064
‡2 chronic medications per month 0.77 (0.65–0.92) 0.003 1+months Medicaid eligible, No chronic medications 1.00
Client Age in Years at Index Discharge 1.00 (1.00–1.00) 0.151 0.151 Female Client 0.98 (0.92–1.06) 0.658 0.658 Client Race
Black 1.00 (0.93–1.07) 0.919 0.869
Other 0.97 (0.85–1.09) 0.597
White 1.00
Hispanic Client 1.30 (1.05–1.60) 0.015 0.015 Client Language Not English 0.98 (0.74–1.31) 0.896 0.896 Population Size of Client County
100K–<200K 0.94 (0.86–1.03) 0.204 0.346
‡200K 1.00 (0.93–1.09) 0.951
<100K 1.00
Mental Health Diagnosis in Past 2 Years 1.09 (1.02–1.18) 0.018 0.018 Substance Abuse Diagnosis in Past 2 Years 1.09 (1.01–1.17) 0.034 0.034 # Outpatient Providers in Past Year
3–7 1.06 (0.61–1.83) 0.838 0.641
8–11 0.98 (0.57–1.70) 0.956
12–15 0.95 (0.55–1.65) 0.852
‡16 0.97 (0.56–1.69) 0.913
0–2 1.00
# of Inpatient Admissions in Past Year
1 1.26 (1.15–1.38) <.001 <.001
2 1.36 (1.22–1.52) <.001
‡3 2.13 (1.93–2.34) <.001
0 1.00
# of ED Visits in Past Year
1 1.12 (1.00–1.24) 0.044 <.001
2–3 1.25 (1.13–1.39) <.001
‡4 1.60 (1.45–1.77) <.001
0 1.00
# of Acute Med Fills in Past Year
1–6 1.00 (0.84–1.19) 0.980 0.340
7–20 0.97 (0.81–1.15) 0.706
‡21 1.04 (0.87–1.25) 0.644
0 1.00
Surgical Index Hospitalization 0.97 (0.89–1.06) 0.536 0.536 Length of Index Admission (days) 1.00 (1.00–1.01) 0.006 0.006 Discharged on Saturday/Sunday 0.98 (0.90–1.06) 0.621 0.621 Discharged with Home Health Services 1.14 (1.05–1.25) 0.003 0.003 Size of Hospital
<100 beds 0.91 (0.79–1.06) 0.220 0.011 100–499 beds 0.90 (0.83–0.96) 0.003
‡500 beds 1.00
Medicaid eligible<12 months in prior year 1.15 (1.05–1.27) 0.004 0.004
Home visits provide a range of services that may assist a patient in transitioning after a hospital discharge, including patient and family education, identification of social and environmental barriers, and a complete medication review and reconciliation. The researchers speculate that the in-home medication reconciliation is a large driver of the added effectiveness of a home visit, particularly for patients with multiple chronic conditions. However, additional re-search is needed to explore this further. Medication man-agement for patients receiving CCNC transitional care management services goes far beyond the traditional con-cept of simply documenting a comprehensive list of med-ications. Serious medication discrepancies are highly prevalent for the high-risk Medicaid population after hos-pital discharge. CCNC nurse care managers work closely with clinical pharmacy staff to identify discrepancies across all available sources of medication data.6,10 Patients with multiple chronic conditions typically have multiple physi-cians involved in their care and require multiple medica-tions, and medication changes made during a hospitalization can add confusion to the overall care plan. Although med-ication reconciliation can be done over the phone, a visit to the patient’s home allows the nurse care manager to gather information firsthand about which medications are being taken regularly (including over-the-counter medicines, al-ternative therapies, and older prescriptions), and to better identify barriers to medication compliance or exacerbating factors such as high sodium foods in the kitchen. The home visit may allow the care team to more effectively educate patients and caregivers on medication use and side effects,
and to coordinate with the patient’s primary care medical home and specialist physicians in a timely manner to resolve discrepancies. Additional details about CCNC care man-agement and medication manman-agement strategies in the home visit setting have been described elsewhere.11,12
This study was limited to a Medicaid population in North Carolina, and therefore the results may not apply to the general population. As with any observational study based on claims data, there is the potential for selection bias and inadequate control of demographic, clinical, and program-matic confounders. There may be factors related to a care manager’s decision to conduct a home visit, and a patient’s willingness to receive a home visit, that could not be con-trolled for. To attempt to control for potential biases, this analysis used a large sample size and controlled for a broad range of covariates, including details about patient demo-graphics, medical history, the index hospitalization, and a variety of robust measures of clinical risk. The comparison group included only patients who were willing and able to receive some care management intervention, thus remov-ing patients who were either unreachable or completely unwilling to engage. During the study time frame, program expectations were that care managers should prioritize home visits for patients they perceived to be most vulnerable or at highest risk of readmission. Retrospectively, objective evi-dence offers reassurance that the home visit intervention was not biased toward lower risk patients: patients who received home visits had more chronic conditions, more chronic and acute medications, more providers, and a higher inherent risk of readmission based on CRG distribution.
Table4. Incremental Gross Savings Associated with Home Visits Following Hospital Discharge
Clinical Risk Strata (Benchmark Readmission
Risk Based on CRG) Home Visit
Unique Discharges included in Sample
In 6 Months following Index Discharge.
Inpatient Admissions PMPM
Total Medicaid Costs PMPM
0–<10% Yes 535 0.022 $879
No 2819 0.026 $790
Difference (per month) 0.004 $90*
10–<20% Yes 1260 0.041 $1230
No 6039 0.052 $1311
Difference (per month) 0.011** -$82
20–<30% Yes 1431 0.075 $1825
No 5168 0.091 $1891
Difference (per month) 0.016* -$66
30–<40% Yes 1290 0.117 $2396
No 4455 0.144 $2742
Difference (per month) 0.027 -$347
40–<50% Yes 1014 0.160 $3044
No 3603 0.205 $3667
Difference (per month) 0.045* -$623
50%+ Yes 1671 0.282 $4539
No 4645 0.343 $5508
Difference (per month) 0.061** -$970**
*Statistically significant group differences,P<.05. **Statistically significant group differences,P<.01.
The researchers applied a negative binomial and a linear regression analysis using the same covariates as listed in Table 1 to examine the incremental impact of a home visit on future utilization and cost, respectively. Total Medicaid costs were log-transformed when evaluated in the regression model. Both regression models were limited to the first index admission for each patient.
The evaluation approach used further mitigated against selection bias by stratification of patients into CRGs, al-lowing direct comparison of patients with equivalent disease burden and risk at the time of hospital discharge. During the year prior to the index discharge, half of the patients in each group had not had any hospitalizations. Group differences were small with regard to percent of population with 1, 2, and 3 or more previous admissions, and further mitigated after sorting into individual risk strata. Hence, we can be confident that the baseline differences between groups, within strata, were similar enough to allow for direct com-parisons within strata, and observed differences in read-mission rates likely were not due to regression to the mean. Unique strengths of this study include the use of a large and complex transitional care population, spanning a diverse geography and multiple provider systems, as well as visi-bility into complete claims history, which allowed for granular examination of the impact on future admissions and total cost of care within multiple strata of clinical risk. Al-though a quasi-experimental study design cannot establish a causal relationship, the observed associations between home visits and study outcomes were substantial, and compelling enough to warrant attention from health care administrators and stakeholders, and to stimulate further investigation in other populations.
As provider organizations take on increasingly greater financial risk for failed hospital transitions, whether through financial penalties or through more broad-based account-able care arrangements with both public and private payers, they will need a more complete understanding of where readmission reduction opportunities exist and the expected return on investment for deploying transitional care inter-ventions. Hospital discharge is a critical moment for care coordination interventions to improve outcomes for com-plex patients, yet many patients fall through the cracks during this period. Planning for proper care and timely support after discharge must begin before a patient leaves the hospital, and must be integrated within a coordinated system of longitudinal care that can adapt to available re-sources and a patient’s individual needs. To this end, this analysis demonstrates a crucial role for postdischarge home visits, executed within a systematic framework for identi-fying high-risk patients with multiple chronic conditions who are most likely to benefit.
Author Disclosure Statement
Drs. Jackson, Williams, and DuBard, and Ms. Kasper declared the following potential conflicts of interest with respect to the research, authorship and/or publication of this article: Both Drs. Jackson and DuBard are employees of Community Care of North Carolina whose transitional care program is being evaluated here.
This work was partially funded by the North Carolina Healthcare Quality Alliance and the NC Department of
Health and Human Services, Office of Rural Health and Community Care.
References
1. Coleman EA, Parry C, Chalmers S, Min S-J. The care transitions intervention: results of a randomized controlled trial. Arch Intern Med. 2006;166:1822–1828.
2. Naylor MD, Aiken LH, Kurtzman ET, Olds DM, Hirsch-man KB. The care span: the importance of transitional care in achieving health reform. Health Aff (Millwood). 2011; 30:746–754.
3. Hansen LO, Young RS, Hinami K, Leung A, Williams MV. Interventions to reduce 30-day rehospitalization: a sys-tematic review. Ann Intern Med. 2011;155:520–528. 4. Naylor MD, Brooten D, Campbell R, et al. Comprehensive
discharge planning and home follow-up of hospitalized elders: a randomized clinical trial. JAMA. 1999;281:613– 620.
5. Stewart S, Horowitz JD. Home-based intervention in con-gestive heart failure: long-term implications on readmission and survival. Circulation. 2002;105:2861–2866.
6. DuBard CA, Cockerham J, Jackson CT. Collaborative ac-countability for care transitions: the community care of North Carolina transitions program. NC Med J. 2012;73(1): 34–40.
7. Jackson CT, Trygstad TK, DeWalt DA, DuBard CA. Transitional care cut hospital readmissions for North Car-olina Medicaid patients with complex chronic conditions. Health Aff (Millwood). 2013;32:1407–1415.
8. Jackson CT, Shahsahebi M, Wedlake T, DuBard CA. Timeliness of outpatient follow-up: an evidence-based ap-proach for planning after hospital discharge. Ann Fam Med. 2015;13:115–122.
9. Hughes JS, Averill RF, Eisenhandler J, et al. Clinical risk groups (CRGs): A classification system for risk-adjusted capitation-based payment and health care management. Med Care. 2004;42:81–90.
10. Pikoulas T, McKee J, Jackson C, Trygstad T, Mahan A, Lancaster M. Community care of North Carolina—a statewide initiative for innovative pharmacy practice with a behavioral health focus. Mental Health Clinician. 2014; 4:27–275.
11. Trygstad T. A series of well-coordinated dismounts. N C Med J. 2012;73(1):35–36.
12. Trygstad T, Rice K, Robinson T, et al. Community care of North Carolina: building regional integrated delivery sys-tems that support the medical home. NC Pharmacist. 2011; 91(1):6–17.
Address correspondence to:
Dr. C. Annette DuBard Community Care of North Carolina 2300 Rexwoods Drive, Suite 200 Raleigh, NC 27607