ASSESSING GREEN INFRASTRUCTURE
IMPLEMENTATION IN WASHINGTON, D.C.
to Promote Equity and Climate Change Resilience
Audrey Vogel
Table of Contents
Introduction ... 2
Literature Review ... 3
Dimensions of Climate Change ... 3
Geography and the Built Environment ...3
Green Infrastructure ... 4
Social Vulnerability ...4
Resilience and Adaptation ...4
Benefits of Green Infrastructure ...5
Social Dimensions ...6
Case Study: Washington, DC ... 7
Green infrastructure Implementation ... 7
Study Area and Data ... 9
Variables ... 9
Green Infrastructure Data ...9
Socioeconomic Data ...9
Land Use and Environmental Data ...9
Spatial Distribution ... 11
Hypotheses ... 11
Methodology ... 11
Results ... 11
Discussion ... 13
Conclusion ... 15
References ... 17
Works Cited ... 17
Data Sources ... 21
2 | VOGEL
Green infrastructure (GI) is broadly defined as natural and semi-natural mechanisms that protect and restore ecosystem functions within and around urban areas (Dhakal and Chevalier 2017; Hansen and Pauleit 2014; Kimmel et al. 2013). Examples of green infrastructure include rain gardens, rain barrels, and green roofs, in addition to more subtle practices such as permeable pavement, bioswales, and tree canopy preservation. These mechanisms are primarily geared towards stormwater management, but can also provide additional environmental and social benefits (Meerow and Newell 2017; Hansen and Pauleit 2014). Modern cities face a number of challenges such as flooding, air and water pollution, urban heat islands, and aging infrastructure. These challenges are particularly dire in the context of climate change, which exacerbates these problems (USGCRP 2018; Sharifia and Yamagata 2014). The use of green infrastructure has been widely recognized as an effective adaptation practice that can be used to help build resilience in urban areas by reducing the severity of certain climate impacts, such as flooding and heat stress. In the absence of strategic and participatory planning, green infrastructure can also potentially exacerbate social-spatial inequalities in urban areas. Populations that are socially, economically, institutionally, or otherwise marginalized are especially vulnerable to the impacts of climate change and often have the highest need for green infrastructure planning (Bowen and Lynch 2017; Heckert and Rosan 2016). However, Environmental Justice literature indicates that these populations are often benefitting the least from infrastructure investments, and green spaces such as parks and open space (Hendricks et al. 2018). As cities begin to engage in adaptation planning with green infrastructure it is crucial for local governance to focus on strategies that explicitly protect and promote equity sustainability.
In this Masters Project, I provide an overview of green infrastructure planning in the context of social equity and climate change resilience, examine green infrastructure implementation in Washington DC, analyze the relationships between socioeconomic and environmental variables that
could potentially influence the spatial distribution of green infrastructure, and provide recommendations based upon my analysis. The purpose of this master’s project is to identify and potential disparities or equity issues in green infrastructure implementation at the block group level. Based on green infrastructure, climate change, and environmental justice literature, I hypothesize that a number of social and economic factors would be associated with the density of green infrastructure. More specifically, I hypothesized that there would be a positive relationship between income and education, and the density of green infrastructure projects (projects per square mile), and that there would be a negative relationship with respect to the proportion of renters, people of color, and cost-burdened households. To evaluate my hypotheses, I used a variety of methods including initial qualitative case study research, spatial analysis and mapping, and quantitative statistical methods.
My case study of Washington, DC examines this complicated and potentially problematic relationship between green infrastructure and social equity. Washington, DC has made exceptional progress in implementing green infrastructure through a combination of development regulations, capital expenditures, and incentive programs (DDOE 2013; DC Water 2015). While these have been relatively successful at increasing the development of green infrastructure in Washington, DC there are potential challenges surrounding planning and social equity. Ideally in planning green infrastructure projects, the City should be ensuring that infrastructure serves all of DC’s neighborhoods equally and that environmental resources and amenities are redistributed to the neighborhoods that most need them (Lim 2018; Heckert and Rosan 2015; Wolch et al. 2015). In this Master’s project I address the following question: is there a relationship between socio-economic factors and the spatial distribution of green infrastructure in Washington, DC? Understanding these potential relationships highlights important areas for improvement as cities move forward with climate change adaptation planning.
Literature Review
Dimensions of Climate ChangeThe U.S. Global Change Research Program (USGCRP) defines climate change as “changes in average weather conditions that persist over multiple decades or longer” this encompasses both increases and decreases in temperature, in addition to shifts in precipitation, and shifts in the risk of certain types of severe weather events (USGCRP 2018). According to the 2018 National Climate Assessment, global climate change is occurring at a rate faster than has ever occurred in the history of modern civilization. Sea level rise and storm surges, heat stress, extreme precipitation, inland and coastal flooding, landslides, drought, increased aridity, forest fires and water scarcity are all expected to increase as climate change continues to progress, with negative impacts on people in terms of health, livelihoods, and assets. Some of these impacts are more localized to specific regions, while others are more widespread across the country. Nonetheless, most communities are subject to multiple climate-related impacts and the compounding effects of these impacts threaten the livability of urban settlements and increase the vulnerability of urban social and economic systems (USGCRP 2018; IPCC 2014; Ven et al. 2016). In natural hazards literature and research, vulnerability generally refers to the potential for loss from an environmental hazard. (Cutter, Boruff, and Shirley 2003). In the context of climate change, vulnerability generally refers to the capacity to be harmed, or the propensity or predisposition to be adversely affected by climate change in the short and long term (NRC 2010; IPCC 2014). Since losses and impacts vary geographically, over time, and among different social groups, the nature of vulnerability and climate change adaptation is inherently spatial and temporal (Shi et al. 2016; Cutter, Boruff, and Shirley 2003). The multiple dimensions of vulnerability include biophysical vulnerability, the vulnerability of the built and environment in addition to social and economic vulnerability. When addressing climate change adaptation and resilience, governments and planners must consider these multiple dimensions of exposure and vulnerability.
Geography and the Built Environment
According to the National Research Council, vulnerability associated with climate change is based on underlying ecological and social stressors (2010). While the specific stressors tend to vary dramatically
from place to place, it is evident that urban areas are particularly vulnerable. Cities are often located in hazard prone areas such as floodplains and fragile coastal areas, which increases exposure to and risk of threats posed by heavy storm events and sea level rise (NRC 2010; UCS 2013). Global average sea level has risen approximately 8 inches since 1900, and is expected to rise an additional 1 to 4 feet by the end of the century (USGCRP 2018). Approximately 5 million people in the U.S. live within 4 feet of the local high-tide level. Furthermore, the combination of storm surges and high tides with sea level rise will exacerbate the risk of devastating floods in these areas (USGCRP 2014). In addition, urban development patterns have led to modifications of hydrologic systems that increase the incidence and severity of urban flooding. A key characteristic of urbanization is the removal of vegetative surfaces that are for providing evaporative cooling, rainwater interception, and flood water infiltration and storage. Cities also have altered energy exchanges that cause the urban heat island effect (UHI), in which urban areas tend to have higher air and surface temperatures than their rural surroundings (Grimm et al. 2008). Consequently, as global temperatures increase, cities are particularly susceptible to heat stress. (Grimm et al. 2008; Gill et al. 2007; wwCarter et al. 2017).
4 | VOGEL
Social Vulnerability
Social vulnerability and equity are important to consider in the context of climate change because certain populations have less capacity to prepare for, respond to, and recover from climate-related impacts and hazards (Lynn, MacKendrick, and Donoghue 2011). The majority of world population is now living in cities and population projections indicate that almost all future population growth will occur in urban areas (USGCRP 2018; IPCC 2014; Sharifa and Yamagata 2014). Hazard risks are often highest for those that are already vulnerable, such as low-income communities, communities of color, children, and the elderly; moreover, cities often have higher concentrations of these vulnerable groups. In this context, Cutter, Boruff, and Shirley (2003) define social vulnerability as a measure of both the sensitivity of a population to natural hazards and its ability to respond to and recover from the impacts of hazards. The literature suggests that sociodemographic indicators, such as income and poverty level, housing conditions, educational attainment, and age group, are useful in measuring and understanding social vulnerability. (Cutter, Boruff, and Shirley 2003).
Resilience and Adaptation
The concept of resilience is traditionally used to describe the ability of an object to return to its original position after receiving a “hit” and the ability to successfully survive a shock or trauma (Sharifia and Yamagata 2014). However, in the context of climate change, the IPCC defines resilience as “the capacity of social, economic, and environmental systems to cope with a hazardous event, trend, or disturbance, responding or reorganizing in ways that maintain systems’ essential function, identity, and structure while also maintaining the capacity for adaptation, learning, and transformation” (IPCC 2014). The notion of resilience in urban planning has become increasingly important as global warming progresses, and communities continue to feel the effects of a changing climate. The Union of Concerned Scientists refer to a “resilience gap” which represents the degree to which a community is unprepared for damaging climate effects, which more or less will indicate the degree to which people will suffer from climate-related events. In order to narrow the gap, communities must engage in both adaptation and mitigation activities (UCS 2016). Mitigation includes actions that lessen the likelihood of such an event
occurring, for example reductions in greenhouse gas emissions. Adaptation refers to adjustments in human or natural systems in response to actual or anticipated climatic stimuli or their effects (Glavovic and Smith 2014). Both adaptation and mitigation are of crucial importance as the severity of climate impacts become more of a reality in cities.
Research indicates that vulnerable groups may not only be disproportionately affected by climate change impacts, but also adaptation strategies if they are not implemented under policies that consider existing inequalities (Anguelovski et al. 2016). Urban adaptation responses, such as decisions about where to prioritize physical protection projects, install green infrastructure, or route public transportation have differential impacts on urban residents. If these responses neither address social inequities nor engage vulnerable populations, they can inadvertently harm low-income and minority residents and exacerbate justice issues (USGCRP 2018). According to Bowen and Lynch (2017) the concept of maladaptation is defined by as ‘action taken ostensibly to avoid or reduce vulnerability to climate change that impacts adversely on, or increases the vulnerability of other systems, sectors or social groups. According to Anguelovski et al. (2016) climate change adaptation strategies can produce injustices that fall into two primary categories: interventions that negatively affect or displace poor communities and interventions that protect economically valuable and/or wealthy areas over low-income or minority neighborhoods, or fail to involve affected communities in the process. Their research findings suggest that these actions most commonly include infrastructure investments, land use regulations, and the creation of protected areas disproportionately affect or displace low-income and minority communities.
Green Infrastructure
(Demuzere et al. 2014; Andersson et al. 2014; Kimmel et al. 2013; Tzoulas et al. 2007)
The most commonly cited environmental benefits of GI, besides stormwater management, include improved air quality, and urban heat island mitigation. As a means for climate change adaptation, green infrastructure is especially useful for moderating temperatures in urban areas. The urban heat island (UHI) is a climatic phenomenon caused by anthropogenic heat release, air pollution, and the use artificial surfaces such as concrete and asphalt in place of soil and vegetation (Hamada et al. 2013). Urban green infrastructure, particularly green roofs, tree canopy, and green spaces, reduces the urban heat island effect through the conversion of energy from the sun into latent heat by evapotranspiration from vegetated surfaces (Foster et al. 2011, Gill et al. 2007; Hamada et al. 2013). Consequently, GI can provide crucial health benefits in a warming climate. Extreme temperatures exacerbate cardiovascular diseases,
respiratory diseases, and mental stress, in addition to increasing the risk of mortality and morbidity (Bowen and Lynch 2017).
Beyond mitigating heat stress, green infrastructure can also provide additional health benefits. According to the Harvard Health and Places Initiative (HAPI), proximity to green space increases the likelihood of engaging in exercise and physical activity. One study found that having 10% more green space within a 1 km radius of an individual’s neighborhood was protective and artificial mechanisms that protect, restore and
mimic ecosystem functions within and around urban areas (Dhakal and Chevalier 2017; Hansen and Pauleit 2014; Downing 2014). Examples include green roofs, right-of-way bioswales, rain gardens, green streets and alleyways, permeable pavements, urban green spaces and tree canopy coverage. These types of structures and installations provide numerous ecological and social benefits to urban areas, ranging from stormwater management and pollution reduction, as well as improved public health (Meerow and Newell 2017; Jim et al. 2015). These benefits are often classified as ecosystem services, which include four types: provisioning, regulating, supporting, and cultural services (Lovell and Taylor 2013). These proven benefits of green infrastructure are widely documented, prompting an abundance guidance materials, handbooks, and case studies from the EPA, state governments, and non-profit organizations to help expand the implementation of GI practices. The benefits of green infrastructure in the context of climate change adaptation generally relate to the ability to manage water and to moderate temperature, in addition to community benefits. Benefits of Green Infrastructure
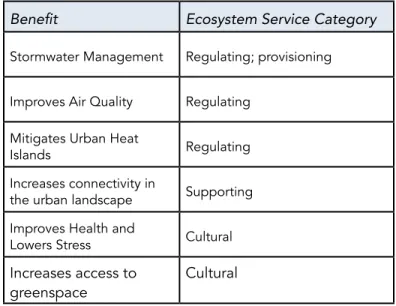
Green infrastructure is most commonly researched and implemented as a means of stormwater management and flood control. The high concentrations of impervious surfaces in urban areas increase the amount of runoff and potential for flooding. Urban stormwater runoff carries pollutants, such as pathogens, nutrients, sediment, and heavy metals, into the water system. In addition, heavy rain events often lead to the discharge of untreated sewage into the waters system in cities with combined sewer systems, which is a hazard to public health. Green infrastructure is used to facilitate the natural flow of water across the area to improve the urban drainage system (Dong et al. 2017). By capturing and retaining rainfall during and after storm events, green infrastructure reduces stormwater discharges. Lower discharge volumes translate into reduced combined sewer overflows, lower pollutant loads, and reduces the incidence of urban flooding. (US EPA 2014). However, the utility of green infrastructure extends beyond just stormwater management. Green infrastructure is widely promoted for its “multifunctionality” in providing a host of ecosystem services and community benefits. Table 1 summarizes the multifunctional benefits of green infrastructure based on ecosystem services categories
Benefit Ecosystem Service Category
Stormwater Management Regulating; provisioning
Improves Air Quality Regulating
Mitigates Urban Heat
Islands Regulating Increases connectivity in
the urban landscape Supporting Improves Health and
Lowers Stress Cultural
Increases access to greenspace
Cultural
6 | VOGEL
of particular diseases including chronic heart disease, upper respiratory tract infection, asthma, and chronic obstructive pulmonary disease (Maas et al. 2009). In addition, there are well documented findings that viewing or experiencing natural environments is associated with lower levels of stress and improved measures of physiological stress (Bowen and Lynch 2017; HAPI 2014). It is important to note that these particular health issues can all be exacerbated by climate change and that these health issues are particularly prevalent among vulnerable population. Furthermore, implementing green infrastructure as a means of climate change adaptation can be specifically beneficial to low income populations. (Bowen and Lynch 2017; Meerow and Newell 2017). Social Dimensions
Green infrastructure has crucial implications for environmental justice and social equity. The extensive environmental justice literature documents how marginalized and vulnerable communities are disproportionately exposed to greater environmental harms and have reduced access to environmental benefits (Bullard and Johnson 2000; Boone 2008; Hendricks et al. 2018; Schwarz et al. 2015). There is significant research indicating that low-income and minority communities have less green space, both in terms of access and total area (Ferguson et al. 2018; Wolch et al. 2014). Heckert and Rosan (2016) use the term “equity void” to describe these communities and neighborhoods with disparities in green space and other amenities. This related to Tiebout’s (1956) “vote with their feet” argument. Tiebout argued that communities offer varying ranges of amenities and people will “vote with their feet” and choose neighborhoods that have a package of amenities that best suits their needs. However, in low-income communities, residents are not able to “vote with their feet” because they often do not have the resources to move to more expensive neighborhoods that may provide more amenities. This results in a large number of low-income residents who are “left” with communities that lack critical amenities that make a difference. Considering these disparities and how they compound with other components of social vulnerability, such as poverty and health, it is clear that low income communities in vulnerable areas would benefit the most from green infrastructure. There is an opportunity to use strategic and participatory
planning to target areas that have high vulnerability not only in the built environment, but also in the social fabric of the community (Meerow and Newell 2017; Heckert and Rosan 2016).
The city of Washington, DC has several characteristics that make it an interesting case study for examining green infrastructure implementation. The location of the city at the confluence of the Potomac River and Anacostia River increases the District’s exposure and susceptibility to periodic flooding. In addition, the city was essentially built on top of three major stream systems - the Tiber Creek, James Creek, and Slash Run. The burial of theses natural drainage systems has caused several hydrologic problems that the city still struggles with today (Strauss et al. 2014). Additionally, a significant portion of DC is served by a combined sewer system (one third), which was developed before the 1900’s. This part of the city is prone to combined-sewer overflows during heavy precipitation events, resulting in mixed sanitary waste and stormwater that is discharged directly into the Anacostia River, Rock Creek, Potomac River or tributary waters. Consequently, the District Water and Sewer Authority, known as DC Water, is under a 2005 court-ordered consent decree from the EPA to control combined-sewer overflows to all three District water bodies (DC Water 2015). In addition, the District Department of Energy and Environment (DOEE) implemented various programs that increase green infrastructure development in the city. Consequently, DC has become a leader among other cities in green infrastructure implementation (US EPA 2014). On the other hand, Washington has a history of social equity issues, segregated by race,
Case Study: Washington, DC
income, and education (Kijakazi et al. 2016). This raises the question of whether or not DC’s green infrastructure programs are potentially exacerbating social inequities. Furthermore, analysis focuses on the relationship between socioeconomic factors and green infrastructure density at the block group level in Washington, DC.
Green infrastructure Implementation
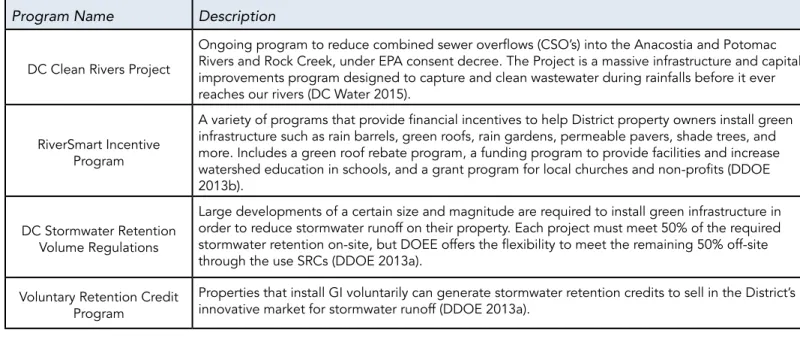
Under the EPA consent decree to reduce combined-sewer overflows, DC Water developed a Long-Term Control Plan to construct three large holding tunnels to provide extra capacity during heavy rainfall in 2005. However, in 2015 DC Water executed a modification to this plan in order incorporate widespread investment in green infrastructure projects. The motivation for this modification was to reduce the cost and scope of gray infrastructure required to control stormwater, and to account for uncertainty associated with future precipitation extremes and climate change (US EPA 2017). The DC Clean Rivers (DCCR) Project is DC Water’s ongoing program under the Long-Term Control Plan Modification. The program includes a green infrastructure plan that guides the implementation of GI in compliance with the consent decree, and promotes GI as an opportunity to create green jobs and provide community amenities. However, these social benefits are not incorporated in the project’s suitability analyses (DC Water 2015).
Program Name Description
DC Clean Rivers Project
Ongoing program to reduce combined sewer overflows (CSO’s) into the Anacostia and Potomac Rivers and Rock Creek, under EPA consent decree. The Project is a massive infrastructure and capital improvements program designed to capture and clean wastewater during rainfalls before it ever reaches our rivers (DC Water 2015).
RiverSmart Incentive Program
A variety of programs that provide financial incentives to help District property owners install green infrastructure such as rain barrels, green roofs, rain gardens, permeable pavers, shade trees, and more. Includes a green roof rebate program, a funding program to provide facilities and increase watershed education in schools, and a grant program for local churches and non-profits (DDOE 2013b).
DC Stormwater Retention Volume Regulations
Large developments of a certain size and magnitude are required to install green infrastructure in order to reduce stormwater runoff on their property. Each project must meet 50% of the required stormwater retention on-site, but DOEE offers the flexibility to meet the remaining 50% off-site through the use SRCs (DDOE 2013a).
Voluntary Retention Credit Program
Properties that install GI voluntarily can generate stormwater retention credits to sell in the District’s innovative market for stormwater runoff (DDOE 2013a).
8 | VOGEL
Separate from DC Water Clean Rivers Project, the District Department of Energy and Environment, manages the RiverSmart Washington project, an incentive and rebate program to promote the installation of green infrastructure on private property. In 2008, DDOE initiated the RiverSmart pilot project in two District Neighborhoods, and it has since than evolved into a city-wide program. The RiverSmart program provides a range of incentives to homeowners, schools, 501(c)(3) non-profit organizations, and places of worship. In the process for homeowners, DDOE conducts audits to assess which GI features are appropriate for the property and partners with local contractors and nonprofits to execute the installation (US EPA 2014). While DDOE supplements the cost of project, the homeowners have a copayment that varies based on the installation type (DDOE 2013b). Consequently, this project may be less accessible to lower-income homeowners and neighborhoods with low homeownership rates. RiverSmart also includes a program that provides grant funding to 501(c)(3) non-profit organizations and places of worship for projects that implement green infrastructure and educate the public about water pollution (DDOE 2013b).
In 2013, DDOE also finalized the “Rule on Stormwater Management and Soil Erosion and Sediment Control” which provides a series of stormwater management regulations for new development and redevelopment in the District. Developments over a certain size are
required to retain the stormwater volume from a 1.2-inch storm on site using green infrastructure practices. The rule also includes a unique trading program that allows regulated properties to purchase “retention credits” from properties that have excess stormwater retention capacity (SDOE 2013a).
This combination of development regulations, incentive programs, and capital improvements resulted in widespread green infrastructure development in the District (Table 2). Through these programs, the District of Columbia has promoted green infrastructure implementation as a revitalization strategy and an opportunity to create community amenities; however, the primary driving factor is to reduce stormwater runoff, ease the burden on the DC’s aging infrastructure systems, and meet water quality regulations (Lim 2018).
Washington, DC also has a sustainability plan (Sustainable DC) and climate action plan (Climate Ready DC). These plans both reference green infrastructure as a means to achieve sustainability and adapt to climate change. In addition, they both include components about social equity and vulnerability in sustainability and resilience; however, they do not draw any connections to the role that green infrastructure has in these processes. Table 3 summarizes the green infrastructure related action items in these plans.
Plan Goals and Actions
Climate Ready DC
Goal: Increase resilience of drinking water, wastewater, and stormwater systems to maintain viability during periods of extreme heat, severe weather, and flooding
Actions: Update design standards for water and drainage infrastructure to address the projected increase intensity of precipitation; Increase combined sewer and separate stormwater system capacity with green and grey infrastructure, including raingardens, green roofs, trees, cisterns, and pervious pavement. Focus first on areas that flood regularly, have steep topography, or have known drainage capacity issues
Goal: Reduce risks of extreme heat and the urban heat island.
Action: Reduce the heat-island effect and related increase in outside air temperatures with cool and living roofs, expanded green space, tree planting, and tree protection efforts, prioritizing hotspots and those areas with the greatest number of heat vulnerable residents. Incorporate heat-island mitigation into planning for green infrastructure, tree canopy, and public space initiatives.
Sustainable DC
Goal: Relieve pressure on stormwater infrastructure and reduce long-term flood risk
Actions: Install 2 million new square feet of green roofs; Increase the use of green infrastructure along public rights of way; Double the number of homes participating in the RiverSmart Homes program; Build 25 miles of green alleys; Establish pervious surface minimums for targeted zoning district.
My analysis focuses on the block groups within the city limits of Washington, DC. This area is ideal for studying trends in green infrastructure implementation because of the city’s unique geographic and demographic conditions, but also due to the significant strides the District Government has made in developing green infrastructure programs. These programs have yielded a large sample of documented and monitored green infrastructure projects across the city. The data used for this study consist of three primary datasets, including spatial data on green infrastructure projects, socio-demographic census data at the block group scale, and environmental/land use data used to control for covariates that may impact green infrastructure density. The study area consists of 419 out of the 451 block groups in Washington DC, due to case-wise deletions of 32 erroneous observations.
Variables
Green Infrastructure Data
The locations of green infrastructure in Washington, DC were obtained from the District of Columbia Stormwater Database, a comprehensive resource that tracks all of the green stormwater best management practices that have been installed to comply with the District’s stormwater regulations, or to participate in one of the voluntary incentive programs (DDOE 2019). The dataset includes information on the project location, installation date, best management practice (BMP) type, and watershed drainage basin (among other factors). For the purpose of this project, I used the project location data and the type classifications in the dataset. The various types of green infrastructure practices in this dataset are described in Table 4. It is important to note that the DC Stormwater Database
Study Area and Data
also included data on grey stormwater infrastructure; however, I did not include the locations of projects classified as “gray infrastructure.”
The green infrastructure project locations were joined with GIS data (shapefile) on census block groups to determine the total number of GI projects for each block group, in addition to counts for the top five most-implemented green infrastructure types: rainwater harvesting, tree planting and preservation, bioretention, bayscaping, and green roof projects (Figure 1). The density for each attribute was calculated by dividing the project/type count by the total area in square miles for each block group. These density attributes were each used as the dependent variable for one of the six regression models in the project. There’s a total of 16,803 green infrastructure projects located within the 419-block group study area. Tree planting and preservation, and rainwater harvesting facilities, account for almost 60% of the total number. This is likely because of the relatively small-scale nature of these projects, as opposed to a green roof facility that can cost thousands of dollars to build. This sheds light on the need to conduct multiple regressions, so that the any differences between implementation can be compared.
Socioeconomic Data
I obtained socioeconomic data at the block group level from the U.S. Census Bureau ACS 2017 (5-year estimates). These variables are measures of population, race, ethnicity, educational attainment, income, and tenancy within each block group (Table 5). Percent of Households that are Cost Burdened is a measure of the number of households that spend more than 30 percent of their household income on housing costs. I chose these factors due to their regular inclusion in Environmental Justice studies of groups that are often environmentally disadvantaged (Heckert and Rosan 2016).
Land Use and Environmental Data
In addition to socioeconomic variables, I collected data on environmental and land use features to strengthen the model. This data was collected primarily from the District of Columbia Open Data portal as shapefiles which were joined with the census block dataset. These variables are described in Table 6. In addition, I obtained GIS data describing the delineation of watersheds in the DC area.
Table 4. Types of Green Infrastructure Practices (DC DOEE 2013a)
BMP Type Description
Rainwater
Harvesting (RH) Collection systems to capture and store rainfall for future use. Cisterns and Rain Barrels
Tree Planting and Preservation (TP)
Preservation of existing trees or planting new trees reduce stormwater runoff onsite. Tree canopy can intercept a significant amount of rainfall before it becomes runoff, particularly if the tree canopy covers impervious surface, such as in the case of street trees.
Bioretention (BR) Practices that capture and store stormwater runoff and pass it through a filter bed of engineered soil media composed of sand, soil, and organic matter. Includes traditional and streetscape bioretention, engineered tree pits, stormwater planters, residential rain gardens.
Bayscaping (BS) Landscaping practice that replaces grass with plants native to the Chesapeake Bay region. Native plants have deeper root systems that absorb more stormwater, reduce erosion, increase infiltration, and are more drought resistant than turf grass or ornamental species.
Green Roof (GR) Green roofs are facilities that capture and store rainfall that would otherwise land on an impervious rooftop, in an “engineered growing media” that is designed to support vegetation.
Permeable Pavement
An alternative paving surface that captures and temporarily stores the design volume by filtering runoff through voids in the pavement surface into an underlying stone reservoir. Includes Porous asphalt, Pervious concrete, Permeable pavers.
Infiltration Mechanisms to capture and store stormwater volumes before allowing it to infiltrate into the soil over a 48-hour period. Includes trenches and basins.
Other Impervious Surface Disconnection, open channels, ponds, wetlands, stream restoration, and land cover change.
Socioeconomic Variables Median Mean Min Max
Total Population 1388 1523.32 463 5407 Population Density (per square mile) 16,873 20,206 1,229 114,789 Median Household Income $84,844 $91,327 $12,649 $250,001 Percent Black or African American 46% 48% 0% 100%
Percent Latinx 7% 10% 0% 53%
Percent of Adults Without A High School Diploma 8% 10% 0% 42% Percent of Renter-Occupied Housing Units 54% 53% 0% 100% Percent of Households that are Cost Burdened 32% 34% 3% 72% Table 5. Summary Statistics for Block Groups in the Study Area (ACS 2017)
Table 6. Land Use and Environmental Variables
Variable Description
CSO Shed Location inside of the Combined Sewer Outfall Shed (binary - y/n coded as 0 or 1) (DDOE 2011)
National Parks Area (Acres) Sum of total area of Park Service properties and other government-owned land within each block group (OCTO 2014)
Parks and Recreation Areas (Acres) Sum of total area of DC Government parks and recreation properties within each block group (DPR 2018)
Storm Surge Density (Percent of Acres in
Block Group) Percent of block group area with a risk of storm tide flooding from hurricanes. (OCTO 2018)
Spatial Distribution
Maps 1 through 7, in the appendix, show the spatial distribution of socioeconomic factors across DC. The city is relatively well educated (56% of adults have a Bachelor’s degree or more), racially diverse (48% Black or African American Alone), and ethnically diverse (11% Latinx). In addition, the city’s median household income is relatively high ($77,649). However, these factors are not evenly distributed across space. There is an east-west divide in regard to race, income, and educational attainment. Based on these maps it is evident that the highest deficits in education and income are located in the southeast portion of the District, in addition to the highest populations of African Americans. This part of the city has a history of environmental justice issues, and has suffered from decades of disinvestment (Lim 2018). One may expect to GI disparities in these areas.
The spatial distribution of green infrastructure density is shown in Maps 8 through 13. While there are several clusters of high density, green infrastructure appears to be relatively dispersed across the city. 45% of the of block groups have one or more green roofs. This BMP is the least dispersed in the city, with highest densities clustered around central downtown. Rainwater harvesting and bioretention projects are more dispersed with 81% of the block groups having at least one rainwater harvesting project and 76% of the block groups have at least one bioretention projects. The following analyses attempt to make sense of these spatial trends.
Hypotheses
Based on environmental justice principles (Wolch et al. 2014; Boone 2008), and the small body of literature examining equity in the distribution of green infrastructure, I hypothesize that there will be a positive relationship between income and education, and the amount of green infrastructure per square mile in a block group, and that there will be a negative relationship with respect to the proportion of renters, people of color, and cost-burdened households. In addition, since DC’s green infrastructure programs focus almost entirely on the stormwater management aspects of GI, I hypothesize the land use and environmental variables will have stronger, more significant relationship with green infrastructure density, compared to the socioeconomic variables.
Methodology
In order to analyze the relationship between socioeconomic factors and the density of green infrastructure in Washington DC, this project used a series of multi-variate Ordinary Least Squares (OLS) regression models. After compiling the variables in ArcMap for spatial analysis, I exported the dataset into Stata. In order to achieve more normal distributions, I performed log transformations for each of the green infrastructure dependent variables, and the population density predictor variable. I then ran six log-linear regression models to determine which of the 13 predictor variables were associated with green infrastructure density. To account for the spatial clustering of green infrastructure activities within watersheds, I clustered robust standard errors around each individual watershed (n=6). The primary model regressed total green infrastructure density as the dependent variable, and then the subsequent models regressed each of the 5 different GI type densities to examine any differences between them. Due to these log transformations, each of these models only includes block groups that include at least one of each respective GI type.
Results
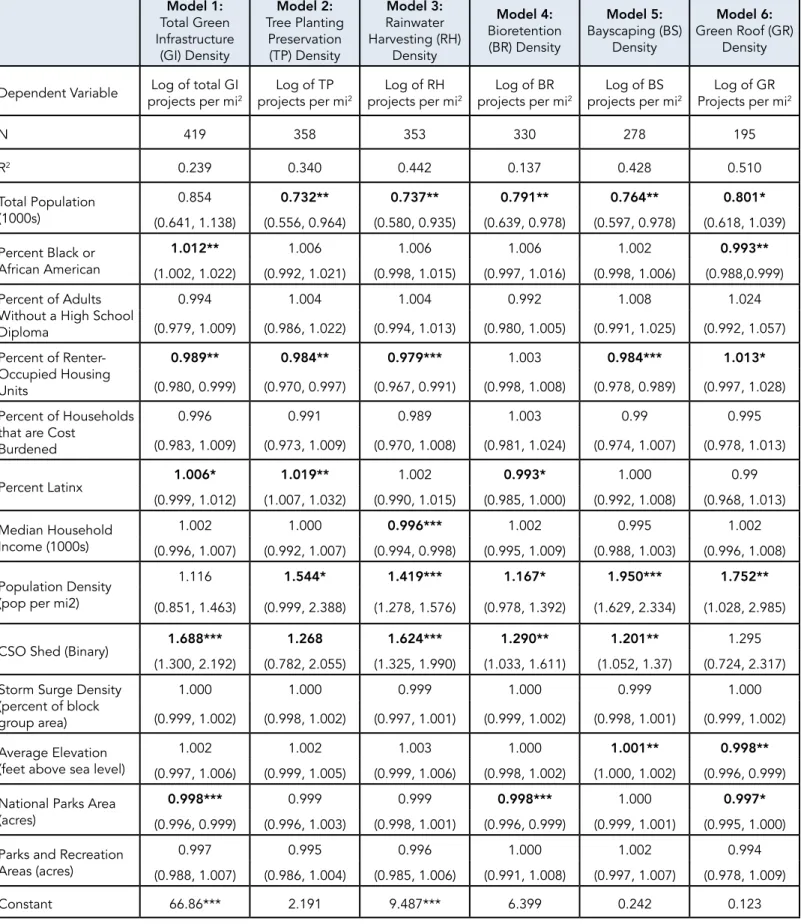
Model 1, total green infrastructure density, had an R2 value of 0.24, which means that the independent variables in the model explain approximately 24% of the variation in green infrastructure density. The R2 values of all the models range from 0.14 to 0.51, with bioretention density (Model 4) being the weakest predictive model, and green roof density being the strongest.
12 | VOGEL
Model 1: Total Green Infrastructure
(GI) Density
Model 2: Tree Planting
Preservation (TP) Density
Model 3: Rainwater Harvesting (RH)
Density
Model 4: Bioretention (BR) Density
Model 5: Bayscaping (BS)
Density
Model 6: Green Roof (GR)
Density
Dependent Variable projects per miLog of total GI 2 projects per miLog of TP 2 projects per miLog of RH 2 projects per miLog of BR 2 projects per miLog of BS 2 Projects per miLog of GR 2
N 419 358 353 330 278 195
R2 0.239 0.340 0.442 0.137 0.428 0.510
Total Population (1000s)
0.854 0.732** 0.737** 0.791** 0.764** 0.801* (0.641, 1.138) (0.556, 0.964) (0.580, 0.935) (0.639, 0.978) (0.597, 0.978) (0.618, 1.039) Percent Black or
African American
1.012** 1.006 1.006 1.006 1.002 0.993** (1.002, 1.022) (0.992, 1.021) (0.998, 1.015) (0.997, 1.016) (0.998, 1.006) (0.988,0.999) Percent of Adults
Without a High School Diploma
0.994 1.004 1.004 0.992 1.008 1.024 (0.979, 1.009) (0.986, 1.022) (0.994, 1.013) (0.980, 1.005) (0.991, 1.025) (0.992, 1.057) Percent of
Renter-Occupied Housing Units
0.989** 0.984** 0.979*** 1.003 0.984*** 1.013* (0.980, 0.999) (0.970, 0.997) (0.967, 0.991) (0.998, 1.008) (0.978, 0.989) (0.997, 1.028) Percent of Households
that are Cost Burdened
0.996 0.991 0.989 1.003 0.99 0.995 (0.983, 1.009) (0.973, 1.009) (0.970, 1.008) (0.981, 1.024) (0.974, 1.007) (0.978, 1.013)
Percent Latinx 1.006* 1.019** 1.002 0.993* 1.000 0.99 (0.999, 1.012) (1.007, 1.032) (0.990, 1.015) (0.985, 1.000) (0.992, 1.008) (0.968, 1.013) Median Household
Income (1000s)
1.002 1.000 0.996*** 1.002 0.995 1.002 (0.996, 1.007) (0.992, 1.007) (0.994, 0.998) (0.995, 1.009) (0.988, 1.003) (0.996, 1.008)
Population Density (pop per mi2)
1.116 1.544* 1.419*** 1.167* 1.950*** 1.752**
(0.851, 1.463) (0.999, 2.388) (1.278, 1.576) (0.978, 1.392) (1.629, 2.334) (1.028, 2.985)
CSO Shed (Binary) 1.688*** 1.268 1.624*** 1.290** 1.201** 1.295 (1.300, 2.192) (0.782, 2.055) (1.325, 1.990) (1.033, 1.611) (1.052, 1.37) (0.724, 2.317) Storm Surge Density
(percent of block group area)
1.000 1.000 0.999 1.000 0.999 1.000 (0.999, 1.002) (0.998, 1.002) (0.997, 1.001) (0.999, 1.002) (0.998, 1.001) (0.999, 1.002)
Average Elevation (feet above sea level)
1.002 1.002 1.003 1.000 1.001** 0.998** (0.997, 1.006) (0.999, 1.005) (0.999, 1.006) (0.998, 1.002) (1.000, 1.002) (0.996, 0.999) National Parks Area
(acres)
0.998*** 0.999 0.999 0.998*** 1.000 0.997* (0.996, 0.999) (0.996, 1.003) (0.998, 1.001) (0.996, 0.999) (0.999, 1.001) (0.995, 1.000) Parks and Recreation
Areas (acres)
As shown in Table 6, Total Population, Population density and Percent of Renter-Occupied Housing Units are significant variables in five out of the six models. There are two socioeconomic variables that were not significant in any of the models, including Percent of Adults Without a High School Diploma and Percent of Cost Burdened Households.
Percent Black or African American is a significant factor in two of the models; in Model 1, Total Green Infrastructure Density, there is a slightly positive, significant relationship between percent Black or African American and total green infrastructure density. When the Black or African American population increases by 1 percent in a block group, the density of green infrastructure is expected to increase by 1%. However, the results of Model 6, Green Roof Density, indicate that when the Black or African American population increases by 1 percent, the density of green roof facilities is expected to decrease by 0.7% Though significant relationships, the associated change is only marginal. Similarly, the percent of the population identifying as Latinx has a significant, yet marginally positive relationship with total green infrastructure density (0.6% increase) and tree planting density (1.9% increase), and a significant, yet marginally negative relationship with bioretention density (0.7% decrease). Median household income is a significant factor in the rainwater harvesting model (3). When median household income increases by $1000 it is expected that the density of rainwater harvesting will decrease by 0.4% percent. Though this relationship is significant and negative, the impact is marginal.
Population density and total population are significant for all five of the GI type models, but not for total GI. The relationship for total population is moderately strong and negative. With a population increase of one unit (1000 people), the various green infrastructure types are expected to decrease by 20 to 27 percent depending on the type, with tree planting decreasing the most (26.8 %) and green roofs decreasing the least (19.9%). However, there is a strong, positive relationship between population density and the green infrastructure types.
In regard to the land use and environmental variables, CSO shed, national park Area, and average elevation were significant in at least one of the models. DC parks and recreation areas and storm surge density
were not significant. CSO shed has a significant and positive relationship with total green infrastructure, Rainwater Harvesting, Bioretention, and Bayscaping Density. When a block group is located in the CSO shed it is expected that total green infrastructure density will be 68.8 percent more than a block group located outside of the CSO shed. Rainwater harvesting density specifically is expected to be 64.2 percent more when located in the CSO shed. There is also an expected increase for biorientation (29%) and Bayscaping (20%). National Parks Area is significant for total green infrastructure, bioretention, and green roof densities. When national park area increases by one acre, there is a very marginal decrease of approximately 0.2 percent for each density. When average elevation increases by one foot, it is expected that bayscaping density will increase by 0.1 percent and green roof density will decrease by 0.2 percent.
Discussion
14 | VOGEL
Race, ethnicity, and income generally do not have a strong relationship with green infrastructure density at the block group level.
Based on my literature review and hypothesis, I expected to see a significant, and negative relationship between percent Black and percent Latinx with green infrastructure density. However, in Model 1, total green infrastructure density actually increases, in association with percent black and Latinx. Although the change is very small, it suggests that green infrastructure placement does not suffer from many of the environmental justice issues affecting provision of other types of infrastructure in DC. Additionally, there is no apparent relationship between median income and total green infrastructure density at the block group level. However, future research needs to examine these findings at a higher resolution geographic scale, because Census block group do not necessarily capture the true variation at a neighborhood level.
The percent of renter-occupied housing units is a significant factor influencing green infrastructure density.
According to the regression analysis results, the amount of total green infrastructure per square mile is expected to decrease by approximately one percent when the share of renters increases by one percent in a block group. This finding aligns with my hypothesis, in that areas with lower-homeownership are benefiting less from green infrastructure than areas with higher homeownership in DC. In regard to the various types, this relationship is significant at the 0.05 level for tree planting and preservation (Model 2), and at the 0.01 level for Rainwater Harvesting and Bayscaping. This is an interesting finding because the DC RiverSmart program provides a variety of incentives for these specific types of projects. This provides insights on the accessibility of the RiverSmart program to property owners versus renters. For example, the RiverSmart Homes and RiverSmart Rebates incentives provides resources for rain barrels, shade trees, rain gardens, and bayscaping specifically for single-family residential properties. While this program has been effective in increasing green infrastructure, it is clear that there is a disparity between who benefits from the program. The incentives for GI installation on private property clearly privileges residents who own their own properties and disadvantages renters (Heckert and Rosan 2016). People that live in areas
with high homeownership or single-family residential neighborhoods are exposed to a greater density of green infrastructure, while those living in areas of high rental occupancy are less likely to reap the benefits of these programs. Moreover, renters will have less autonomy and influence over green infrastructure installation in their neighborhood. The literature indicates that tree canopy preservation is a particularly effective means of climate change adaptation because it moderates temperatures, reducing the severity of heat stress. In addition, it provides a range of social and benefits that are particularly important in vulnerable communities (Bowen and Lynch 2017). Furthermore, it is particularly problematic that tree canopy is negatively associated with renter-occupancy.
The location within DC’s Combined Sewer Outfall (CSO) Shed has a significant and positive relationship with total green infrastructure, Rainwater Harvesting, Bioretention, and Bayscaping Density.
The density of green infrastructure located inside the CSO shed is significantly higher than the amount for block groups located outside of the CSO shed. This aligns with the program goals of the DC Water Clean Rivers project, an extensive capital improvement program to reduce combined sewer overflows into the surrounding watersheds. While this may reflect the relative success of DC’s efforts in promoting green infrastructure implementation, it reinforces that green infrastructure is primarily being implemented as a means for stormwater management. While this is useful in improving water quality across the District and reducing nuisance flooding issues, it does not necessarily ensure that these infrastructure investments are playing a role in a broader effort to adapt to climate change and support vulnerable populations.
The findings (and limitations) of the model provide opportunities for future research.
master plan would help establish clear goals to hold the various program accountable for not only stormwater achievements, but also progress towards climate justice and equity. Various planning strategies and stormwater regulations often have different goals and associated implementation mechanisms. For example, the current programs seek to prioritize low impact development and reduce stormwater runoff, but in order to achieve environmental equity goals will require different implementation strategies. Ideally, a central planning agency should be working to ensure that green infrastructure adequately serves all of the district’s neighborhoods and that environmental resources and amenities are redistributed to the neighborhoods that need them the most (Lim 2018; Heckert and Rosan 2015; Wolch et al. 2015). Furthermore, there is a clear opportunity for the City to use its progress in green infrastructure implementation as a starting point towards decreasing social vulnerability. The literature indicates that intentional inclusion and consideration of local voices are necessary for green infrastructure planning if equitable outcomes are to be obtained (Baker et al. 2019; Wendel et al. 2011; Mandarano and Meenar 2017; BenDor et al. 2018; Bissonnette et al. 2018).
Recommendation #2: Integrate streams of data on urban form and socioeconomic status to aid in equitable and multifunctional implementation of green infrastructure.
The regression analysis indicates that there is a significant, positive relationship between GI density and the DC CSO shed. This sheds light on the need to strategically plan for green infrastructure in areas outside of the CSO as well, for example along the Anacostia River to provide benefits for flood resilience. Adaptive management is key component of the DC Clean Rivers project in which the green infrastructures projects are constructed in a sequential fashion. In between construction phases, the existing GI projects have been monitored and assessed to evaluate their performance. The lessons learned during the monitoring process is intended to then inform the planning and design for the next round of GI project (DC Water 2015). Incorporating local knowledge and spatial, socioeconomic data collection into this evaluation process would increase the potential for GI to reduce social vulnerability and eliminate potential disparities.
specificity required to understand the neighborhood impact. Ground-truthing, stakeholder engagement, and parcel level data would all enable a deeper level of analysis. In addition, this project does not attempt to examine whether green infrastructure investments displace or have a negative impact on vulnerable communities. A longitudinal research component would allow for an analysis of neighborhood change and how it relates to green infrastructure.
Conclusion
Environmental justice literature has demonstrated that the communities that have the highest potential benefit from green infrastructure often have the least access to it and may be negatively impacted by adaptation strategies (Meerow and Newell 2017; Shi et al. 2016; Wolch et al. 2014). Generally, the results of this case study suggest that the citywide efforts of DDOT, DDOE, and DC Water have been successful in promoting widespread green infrastructure development, without causing maladaptive consequences based on race and socioeconomic status. However, there is an apparent disparity among areas with higher rental occupancy. In addition, the review of green infrastructure programs indicates that procedurally, they are primarily focused on stormwater and are not taking advantage of the multifunctional benefits that green infrastructure can provide. In the following section I provide recommendations to improve green infrastructure implementation in Washington, DC as well as other communities engaging in green infrastructure planning.
Recommendation #1: Create a collaborative and participatory green infrastructure planning framework.
16 | VOGEL
Recommendation #3: Update the RiverSmart Program to include specific incentives that target land lords and multifamily developments.
The RiverSmart program’s reliance on private property for the implementation of shade tree planning, rain gardens, rain barrels and other small-scale GI installations, clearly privileges residents who own their own homes and disadvantages renters. By including a program or some sort of platform that targets areas with less participation and specific rental properties will help to alleviate this disparity and create more widespread benefits.
Recommendation #4: Engage with and educate the development community and local residents about the existence of and multiple benefits of green infrastructure.
According to Shandas and Messer (2008), community-based watershed stewardship programs, can increase citizen trust in government, improve the local built environment, and foster participants’ ecological understanding. Since watershed improvement is such a high priority for the DC government, community-based watershed improvement programs can help to fill the gaps between what public institutions can achieve and what the community actually needs. The District has already done a considerable amount of stakeholder engagement in the development of the Clean Rivers Program, the RiverSmart Program, and the 2013 Rule on Stormwater Management and Soil Erosion and Sediment Control. In addition, DDOE announced that the 2019 RiverSmart Communities grant program is heavily targeted towards projects that emphasize the community engagement and outreach activities that will accompany the installation of stormwater projects (DDOE 2015b). Recognizing that engagement and outreach activities are crucial to the success of green infrastructure projects is an important step in the right direction for the RiverSmart program.
Washington, DC’s approach to managing stormwater with green infrastructure has been successful and advantageous in many ways. It represents a shift towards more sustainable, low impact development, and provides opportunities for city residents to do their part through the RiverSmart program. However, without explicitly targeting the neighborhoods with the highest need for green infrastructure, it runs the risk of shifting public investment power to the communities that already have the most capacity and ability to drive changes for themselves (Heckert and Rosan 2016).
References
Works CitedAnguelovski, Isabelle, Linda Shi, Eric Chu, Daniel Gallagher, Kian Goh, Zachary Lamb, Kara Reeve, and Hannah Teicher. 2016. Equity impacts of urban land use planning for climate adaptation. Journal of Planning Education and Research 36 (3): 333.
Baker, Ashley, Emma Brenneman, Heejun Chang, Lauren McPhillips, and Marissa Matsler. 2019. Spatial analysis of landscape and sociodemographic factors associated with green stormwater infrastructure distribution in baltimore, maryland and portland, oregon. Science of the Total Environment 664 : 461-73.
BenDor, Todd K., Vivek Shandas, Brian Miles, Kenneth Belt, and Lydia Olander. 2018. Ecosystem services and U.S. stormwater planning: An approach for improving urban stormwater decisions. Environmental Science and Policy 88 : 92-103.
Bissonnette, Jean-François, Jérôme Dupras, Christian Messier, Martin Lechowicz, Danielle Dagenais, Alain Paquette, Jochen A. G. Jaeger, and Andrew Gonzalez. 2018. Moving forward in implementing green infrastructures: Stakeholder perceptions of opportunities and obstacles in a major north american metropolitan area. Cities 81 : 61-70.
Boone, Christopher G. 2008. Environmental justice as process and new avenues for research. Environmental Justice 1 (3): 149-54.
Bowen, Kathryn J., and Yvonne Lynch. 2017. The public health benefits of green infrastructure: The potential of economic framing for enhanced decision-making. Current Opinion in Environmental Sustainability 25: 90-5.
Bullard, R. D., and G. S. Johnson. 2000. Environmental justice: Grassroots activism and its impact on public policy decision making. Journal of Social Issues 56 (3): 555-78.
Campanella, Thomas. J. 2006. Urban Resilience and the Recovery of New Orleans. Journal of the American Planning Association. 72(2): 141-146. Spring.
Carter, J.G., J. Handley, T. Butlin, and S. Gill. 2017. “Adapting Cities to Climate Change –Exploring the Flood Risk Management Role of Green Infrastructure Landscapes.” Journal of Environmental Planning and Management 1-18: 1–18.
City of New York. 2013. A Stronger, More Resilient New York.
Climate Ready DC. 2016. Climate Ready DC: The District of Columbia’s Plan to Adapt to a Changing Climate.
Cutter, Susan L., Bryan J. Boruff, and W. Lynn Shirley. 2003. Social vulnerability to environmental hazards. Social Science Quarterly 84 (2): 242-61.
Demuzere, M., H. Orru, K. Orru, O. Heidrich, E. Olazabal, D. Geneletti, A. G. Bhave, et al. 2014. Mitigating and adapting to climate change: Multi-functional and multi-scale assessment of green urban infrastructure. Journal of Environmental Management 146 : 107-15.
Dhakal, Krishna P., and Lizette R. Chevalier. 2017. Managing urban stormwater for urban sustainability: Barriers and policy solutions for green infrastructure application. Journal of Environmental Management 203 (Pt 1): 171-81
District Department of the Environment (DDOE)a. 2013. Stormwater Management Guidebook. Center for Watershed Protection: Ellicott City, MD 21043
18 | VOGEL
DC Water. 2015. Long Term Control Plan Modification for Green Infrastructure. Washington DC: DC Water
Dong, Xin, Hao Guo, and Siyu Zeng. 2017. “Enhancing Future Resilience in Urban Drainage System: Green Versus Grey Infrastructure.” Water Research 124: 280–89.
Downing, Jim, Louis Blumberg and Eric Hallstein. 2014. “Reducing Climate Risks with Natural Infrastructure.” The Nature Conservancy: San Francisco, CA
Ferguson, M., H. E. Roberts, R. R. C. McEachan, and M. Dallimer. 2018. Contrasting distributions of urban green infrastructure across social and ethno-racial groups. Landscape and Urban Planning 175 : 136-48.
Ganapati, N. Emel and Sukumar Ganapati. 2009. Enabling Participatory Planning After Disasters. Journal of the American Planning Association, 75:(1): 41-59.
Gill, S.E, J.F Handley, A.R Ennos, and S Pauleit. 2007. Adapting Cities for Climate Change: The Role of the Green Infrastructure. Built Environment 33 (1): 115–33.
Glavovic, Bruce and Gavin Smith. 2014. Adapting to Climate Change: Lessons from Natural Hazards Planning. New York: Springer
Grimm, Nancy B., Stanley H. Faeth, Nancy E. Golubiewski, Charles L. Redman, Jianguo Wu, Xuemei Bai, and John M. Briggs. 2008. Global change and the ecology of cities. Science 319 (5864): 756-60.
Hansen, Rieke, and Stephan Pauleit. 2014. From multifunctionality to multiple ecosystem services? A conceptual framework for multifunctionality in green infrastructure planning for urban areas. Ambio 43 (4): 516-29.
Health and Places Initiative (HAPI). 2014. Mental Health, Health, and Place. A Research Brief. Version 1.0. President and Fellows of Harvard College
He, J., C. Valeo, and FJ-C Bouchart. 2006. Enhancing urban infrastructure investment planning practices for a changing climate. Water Science and Technology 53 (10): 13.
Heckert, Megan, and Christina D. Rosan. 2016. Developing a green infrastructure equity index to promote equity planning. Urban Forestry & Urban Greening 19 : 263-70
Hendricks, Marccus D., Michelle A. Meyer, Nasir G. Gharaibeh, Shannon Van Zandt, Jaimie Masterson, John T. Cooper, Jennifer A. Horney, and Philip Berke. 2018. The development of a participatory assessment technique for infrastructure: Neighborhood-level monitoring towards sustainable infrastructure systems. Sustainable Cities and Society 38 : 265-74.
Hopkins, Kristina G, and Alisha Y Chan. 2017. Associations between Sociodemographics and Green Infrastructure Placement in Portland, Oregon. Journal of Sustainable Water in the Built Environment 3 (3). doi:10.1061/ JSWBAY.0000827.
IPCC. Climate Change 2014: Impacts, Adaptation, and Vulnerability. Revi, A., D.E. Satterthwaite, F. Aragón-Durand, J. Corfee-Morlot, R.B.R. Kiunsi, M. Pelling, D.C. Roberts, and W. Solecki, 2014: Urban areas. In: Climate Change 2014: Impacts, Adaptation, and Vulnerability. Part A:Global and Sectoral Aspects. Contribution of Working Group II to the Fifth Assessment Report of the Intergovernmental Panel on Climate Change [Field, C.B., V.R. Barros, D.J. Dokken, K.J. Mach, M.D. Mastrandrea, T.E. Bilir, M. Chatterjee, K.L. Ebi, Y.O. Estrada, R.C. Genova, B. Girma, E.S. Kissel, A.N. Levy, S. MacCracken, P.R. Mastrandrea, and L.L. White (eds.)]. Cambridge University Press, Cambridge, United Kingdom and New York, NY, USA, pp. 535-612.
Kijakazi, Kilolo, R.A.M. Atkins, Mark Paul, Anne Price, Darrick Hamilton, and William A. Darity Jr. 2016. The Color of Wealth in the Nation’s Capital. A Joint Publication of the Urban Institute, Duke University, The New School, and the Insight Center for Community Economic Development.
Kimmel, Courtney, David Robertson, R. Bruce Hull, Michael Mortimer, and Kris Wernstedt. 2013.Greening the Grey: An Institutional Analysis of Green Infrastructure for Sustainable Development in the US. Center for Leadership in Global Sustainability, Virginia Tech, 2013.
Kuller, Martijn, Peter M. Bach, Diego Ramirez-Lovering, and Ana Deletic. 2018. What Drives the Location Choice for Water Sensitive Infrastructure in Melbourne, Australia? Landscape and Urban Planning 175 : 92-101.
Lim, Theodore Chao. 2018. Revitalizing Urban Neighborhoods by Adopting Green Infrastructure: The Case of Washington DC. Urban Planning International 33(3: 23-31
Lovell, Sarah Taylor, and John R. Taylor. 2013. Supplying urban ecosystem services through multifunctional green infrastructure in the United States. Landscape Ecology 28 (8): 1447-63.
Lynn, Kathy, Katharine Mackendrick, and Ellen M. Donoghue. 2012. Social vulnerability and climate change: Synthesis of literature. USDA Forest Service - General Technical Report PNW-GTR(838): 1-70.
Maas, J., R. A. Verheij, S. de Vries, P. Spreeuwenberg, F. G. Schellevis, and P. P. Groenewegen. 2009. Morbidity is related to a green living environment. Journal of Epidemiology and Community Health (1979-) 63 (12): 967-73.
Mandarano, L., and M. Meenar. 2017. Equitable distribution of green stormwater infrastructure: A capacity-based framework for implementation in disadvantaged communities. Local Environment 22 (11): 1338-57.
Meerow, Sara, and Joshua P. Newell. 2017. Spatial planning for multifunctional green infrastructure: Growing resilience in detroit. Landscape and Urban Planning 159 : 62-75.
Mirti Chand, A. 2018. Place based approach to plan for resilient cities: A local government perspective. Procedia Engineering, 212, 157-164
National Capital Planning Commission (NCPC). 2008. Report on Flooding and Stormwater in Washington, DC.
Rabinowitz, Kate. 2017. A decade of demographic change in D.C.: Which neighborhoods have changed the most? D.C. Policy Center.
Shandas, Vivek, and W. Barry Messer. 2008. Fostering green communities through civic engagement: Community-based enviromental stewardship in the portland area. Journal of the American Planning Association 74 (4): 408-18.
Sharifi, Ayyoob, and Yoshiki Yamagata. 2014. Resilient Urban Planning: Major Principles and Criteria. Energy Procedia 61: 1491–95.
Shi, L., E. Chu, I. Anguelovski, A. Aylett, J. Debats, K. Goh, T. Schenk, et al. 2016. Roadmap towards justice in urban climate adaptation research. Nature Climate Change 6 (2): 131-7.
Schwarz, Kirsten, Michail Fragkias, Christopher G. Boone, Weiqi Zhou, Melissa McHale, J. Morgan Grove, Jarlath O’Neil-Dunne, et al. 2015. Trees grow on money: Urban tree canopy cover and environmental justice. Plos One 10 (4): e0122051
20 | VOGEL
Sustainable DC. 2013. The Sustainable DC Plan. GOVERNMENT OF THE DISTRICT OF COLUMBIA.
Talen, Emily. 2000. Bottom-up GIS: A new tool for individual and group expression in participatory planning. Journal of the American Planning Association 66 (3): 279-94.
Talen, Emily. 1998. Bottom-up GIS: Visualizing fairness: equity maps for planners. Journal of the American Planning Association 64 (1): 22-38
Tiebout, Charles M. 1956. A pure theory of local expenditures. Journal of Political Economy 64 (5): 416-24.
Union of Concerned Scientists. 2016. Toward Climate Resilience: A Framework and Principles for Science-Based Adaptation. Cambridge, Massachusetts: Union of Concerned Scientists.
Union of Concerned Scientists. 2013 (August). Overwhelming Risk: Rethinking Flood Insurance in a World of Rising Seas. Cambridge Massachusetts: Union of Concerned Scientists.
US EPA. 2017. DC Utilizes Green Infrastructure to Manage Stormwater. US EPA: Climate Change Adaptation Resource Center.
US EPA. 2014. Getting to Green: Paying for Green Infrastructure, Financing Options and Resources for Local Decision-Makers. US EPA: Office of Wetlands, Oceans and Watersheds National Estuary Program
USGCRP. 2018. Impacts, Risks, and Adaptation in the United States: Fourth National Climate Assessment, Volume II. U.S. Global Change Research Program, Washington, DC, USA, 186 pp.
USGCRP. 2014. Melillo, Jerry M., Terese (T.C.) Richmond, and Gary W. Yohe, Eds., Change Impacts in the United States: The Fourth National Climate Assessment. U.S. Global Change Research Program, 841 pp.
Ven, V., Snep, R., Koole, S., Brolsma, R., Brugge, V., Spijker, J., and Vergroesen, T. 2016. Adaptation planning support toolbox. Environmental Science & Policy, 66, 427-436
Wendel, Heather E. Wright, Joni A. Downs, and James R. Mihelcic. 2011. Assessing equitable access to urban green space: The role of engineered water infrastructure. Environmental Science and Technology 45 (16): 6728-34.
Wilbanks, Thomas J. and Steven Fernandez. Climate Change and Infrastructure, Urban Systems, and Vulnerabilities. Washington, DC: Island Press/Center for Resource Economics, 2014. doi:10.5822/978-1-61091-556-4
Wolch, Jennifer R., Jason Byrne, and Joshua P. Newell. 2014. Urban green space, public health, and environmental justice: The challenge of making cities ‘just green enough’. Landscape and Urban Planning 125 : 234-44.
Data Sources
US Census Bureau ACS 2017 (5-Year Estimates) https://factfinder.census.gov/faces/nav/jsf/pages/index.xhtml
District Department of the Environment (DDOE) Stormwater Database. “Best Management Practices.” Washington DC: District of Columbia GIS Open Data. http://opendata.dc.gov/datasets/best-management-practices?geometry=-77.893%2C38.713%2C-76.179%2C39.087
District Department of the Environment. 2011. “Combined Sewer Outfall Sewer Shed.” Washington DC: District of Columbia GIS Open Data <http://opendata.dc.gov/datasets/parks-and-recreation-areas>
District Department of Parks and Recreation. 2018. “Parks and Recreation Areas.” Washington DC: District of Columbia GIS Open Data <http://opendata.dc.gov/datasets/parks-and-recreation-areas>
D.C. Office of the Chief Technology Officer. 2018. “Storm Surge Risk Areas.” Washington DC: District of Columbia GIS Open Data < http://opendata.dc.gov/datasets/storm-surge-risk-areas>
D.C. Office of the Chief Technology Officer. 2018b. “Topography - Spot Elevations.” Washington DC: District of Columbia GIS Open Data < http://opendata.dc.gov/datasets/topography-spot-elevations>
22 | VOGEL
Maps Appendix
Percent Latinx
Map 1
Map 2
Map 3
Map 4
Socioeconomic Factors at the Block
Group Level in Washington, DC
Map 6
Map 5
24 | VOGEL