4
The Improved Application
The main problems that we identified at the exist-ing application were related to its availability (on-ly local(on-ly available), the user's intervention ((s)he had to choose the voices of interest) and the lack of use of temporal timestamps of the utterances. Thus, these are the main issues that we addressed and are presented in this paper. The new applica-tion’s purpose is to automatically identify and suggest important moments that appear in a col-laborative learning chat. These moments are then presented to the end user by 2 means: “voice visu-alization” graphics and “hot” moments identifica-tion. The additional information is presented on two new tabs: “List of moments”, that presents all the important moments from a chat that were au-tomatically identified; and “Hot moments”, which adds-in the analysis relying on the time factor.
4.1 Application Overview
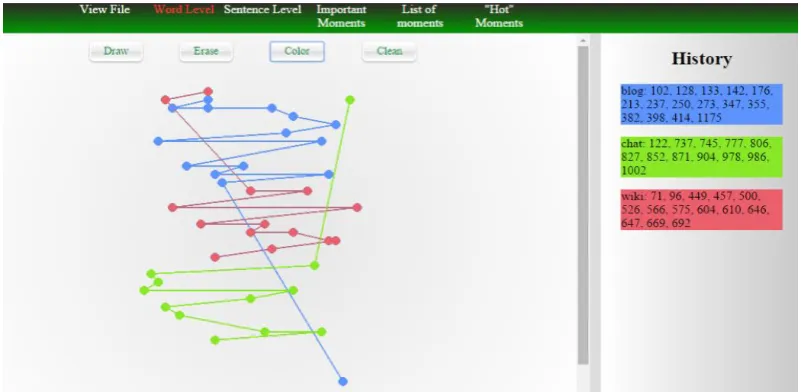
In this subsection, we will present the general graphics and functionalities of the web app, that were ported from the initial application. The first graphic shows the distribution of voices at a word level. Regardless of the conversation length, this graphic offers a suggestive illustration of the dis-tribution of concepts by mapping them in a fixed-size window (see Fig. 1). As a new feature, by clicking a word from the graphic, the user is re-directed in the “View File” tab to see the content of the chat, with the clicked word highlighted.
In Fig. 1 is depicted an example with the selec-tion of 3 voices: one can easily see that the “blog” voice was present in the beginning of the
conver-sation, while the “chat” topic was addressed in the later part of it. Also, in the “History” fragment of the screen, the arrays of positions of the respective concepts are shown. It should be noted that the “History” area is shared by other visualizations (“Sentence Level” and “Important Moments”) and thus, by adding/removing/cleaning concepts to/ from any of these graphics will affect all of them.
To add a word to the graphic, the user would select that word from the vocabulary (not shown in Fig. 1) and press “Draw”. To remove the last concept, the user should press “Erase”, and to re-move all the concepts, (s)he should press “Clean”. The “Color” button changes the latest added con-cept’s color, with a randomly generated one.
By clicking one of the dots, the screen will be re-directed to the “View Chat” tab, pointing to the position of that word's occurrence in the chat. This behavior is illustrated in Fig. 2, where the user pressed the third dot of the “blog” voice from Fig. 1. By adding this re-direction, the user may read in the context of the chat the utterance where the “blog” concept appeared (namely, at position 133, counting all the words from the chat).
The “Sentence Level” graphic is very similar with the previous one, the difference being that now the occurrences are not indexed by the posi-tion of the word itself, but by the posiposi-tion of the utterances they belong to.
4.2 List of Moments
In the initial version of the application, the user had to choose different voices to identify the im-portant moments of the chat. This way, (s)he may oversee some of these moments, if wrong voices are chosen. Thus, we decided to add another view (“List of Moments”) to provide an automatic analysis of the voices from the chat, that doesn't depend on the user's choice. Therefore, in this tab (see Fig. 4), the user has the option to select how many voices (s)he wants to see interacting and then the app detects all the important moments that can be identified using the chosen number of voices. That is, if the user chooses n voices, all the possible combinations of n concepts from the chat are considered, and then, all the moments that are identified are classified according to the criteria developed by Chiru and Trausan-Matu (2012). This way, the user's intervention is minimized, the only thing that (s)he has to input being the cardi-nality of the set of concepts to be analyzed.
4.3 Hot Moments
The last important element that we added to the existing application was the analysis of the utter-ances timestamps, which resulted in the “Hot Moments” view. The graphic from this tab is dif-ferent from the others presented so far, as it doesn't consider the distribution of voices throughout the chat, but it relies on a different fac-tor: time. Thus, it captures the moments when the participants are intensely disputing a subject. However, it should be noted that this functionality is available only for the chats that have the utter-ances' timestamps.
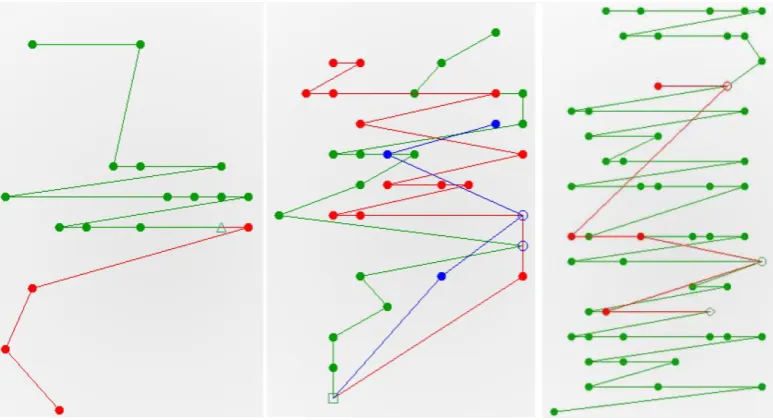
For this visualization, the user is allowed to ad-just the maximum accepted delay between utter-ances, which is initially computed as the chat du ration divided by the number of utterances that it contains. Thus, by adjusting the delay to a lower percentage of this value, some parts of the chat are cut off, the analysis consisting only in the parts of the chat that are “hotter”. In Fig. 5 can be seen the Figure 2: Highlight option for the “Word level” tab.
hot moments sketch’s evolution when the maxi-mum delay is set, in order, to: 100%, 75%, 40% and 15% of the original value. The green areas represent the chat fragments where the delay is less than the chosen percentage of the maximum delay, resulting in considering only highly debated fragments (from the temporality perspective).
The final aspect that we are going to mention here is the combination of “Hot Moments” and “Sentence Level” functionalities. Using this com-bination, the user can view if there is a strong connection between the appearances of certain concepts and the parts from the chat where an in-tense dispute is present. This way, the user can ob-serve whether a concept was more intensely dis-puted compared to others.
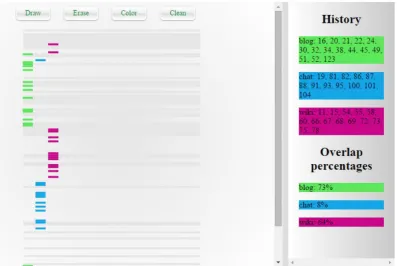
For an easier readability, we also provide an overlap percentage between the sentences where the considered concepts were present and the ones that remained after filtering the chat according to the selected maximum delay. In Fig. 6, we provide an example of this functionality. Seeing this
anal-ysis, one can draw the conclusions that the “blog” (73%) and “wiki” (64%) concepts were more dis-puted than the “chat” (8%) one.
5
Conclusions and Future Developments
In this paper, we presented the improved version of an application for the identification and classi-fication of important moments from the students’ collaborative chats. Compared to the initial ver-sion, two factors were considered in the analysis: the concepts distribution throughout the chat and the intensity of dialogue in various fragments.
Using the visualization graphics, the user may see the main topics that were debated and may speculate whether the participants reached agree-ment or not. Moreover, the “Hot Moagree-ments” func-tionality offers the option to view the intensively disputed parts of a char. Furthermore, by combin-ing the functionalities, it can be seen whether the “Hot Moments” overlap with the voices from the chat, leading to the discovery of inflammatory Figure 4: The List of Moments tab.
topics, along with the participants that let them-selves carried in such intense (contradictory) talks.
The application allows the user to choose the concepts to be analyzed, but also shows the mo-ments that were automatically identified for vari-ous sets of concepts. This way the influence of the user in the analysis is minimized, thus overcoming one of the issues of the initial application.
In terms of future work, an interesting im-provement could be the possibility to offer collab-orative analysis tools, so that multiple persons could participate in the analysis of the same chat.
Acknowledgments
This work has been partially funded by University Politehnica of Bucharest, through the “Excellence Research Grants” Program, UPB – GEX. Identifi-er: UPB–EXCELENȚĂ–2016, 09/26.09.2016.
References
M Mikhail Mikhailovich Bakhtin and Caryl Emerson. 1993. Problems of Dostoevsky’s poetics. U of Min-nesota Press.
Costin-Gabriel Chiru and Stefan Trausan-Matu. 2012. Identification and classification of the most im-portant moments from students’ collaborative dis-courses. In Proc. of ITS, pages 330–339.
Ming Ming Chiu and Lawrence Khoo. 2005. A new method for analyzing sequential processes dynamic multilevel analysis. Small Group Research 36(5): 600–631.
Ellis Hamburger. 2014. Mark Zuckerberg finally ex-plains why he forced you to download the standalone messenger app. https://www.theverge. com/2014/11/6/7170791/mark-zuckerberg-finally-explains-why-he-forced-you-to-download-the. Peter Reimann. 2009. Time is precious: Variable-and
event-centred approaches to process analysis in cscl research. Int. J. of CSCL 4(3):239–257. Anna Sfard. 2000. On reform movement and the
lim-its of mathematical discourse. Mathematical think-ing and learnthink-ing 2(3):157–189.
Gerry Stahl. 2002. Contributions to a theoretical framework for cscl. In Proc. of CSCL: Foundations for a CSCL Community, pages 62–71.
Stefan Trausan-Matu. 2009. The polyphonic model of hybrid and collaborative learning. Handbook of re-search on hybrid learning models: Advanced tools, technologies, and applications, pages 466–486. Stefan Trausan-Matu. 2013. A polyphonic model,
analysis method and computer support tools for the analysis of socially-built discourse. Romanian J. of Information Science and Tech. 16(2-3):144–154. Stefan Trausan-Matu and Traian Rebedea. 2010. A