0095-1137/05/$08.00⫹0 doi:10.1128/JCM.43.5.2391–2398.2005
Copyright © 2005, American Society for Microbiology. All Rights Reserved.
Effect of Sequence Polymorphisms on Performance of Two Real-Time
PCR Assays for Detection of Herpes Simplex Virus
Jeffery Stevenson,
1* Weston Hymas,
1and David Hillyard
1,2ARUP Institute for Clinical and Experimental Pathology1and Department of Pathology,2University of Utah,
Salt Lake City, Utah
Received 2 October 2004/Returned for modification 20 November 2004/Accepted 7 January 2005
Herpes simplex virus (HSV) is the most common cause of acquired, sporadic encephalitis in the United States. PCR identification of HSV in spinal fluid has become the diagnostic gold standard due to its sensitivity and potential for speed, replacing other methods such as culture. We developed a real-time PCR assay to detect HSV, using a new type of hybridization probe, the Eclipse probe. In this study, we ran 323 samples (171 positives and 152 negatives) with the Eclipse real-time PCR assay and compared these results with another PCR assay using gel detection. The real-time assay agreed with our reference method for 319 out of the 323 samples tested (99%). Using two different real-time PCR platforms, we discovered that SNPs within the amplicon’s probe binding region that are used to distinguish HSV-1 from HSV-2 can decrease assay sensitivity. This problem is potentially a general one for assays using fluorescent probes to detect target amplification in a real-time format. While real-time PCR can be a powerful tool in the field of infectious disease, careful sequence evaluation and clinical validation are essential in creating an effective assay.
PCR is now accepted as the gold standard for diagnosis of herpes simplex virus (HSV) infections in the central nervous system (CNS), exhibiting a high degree of specificity and a sensitivity superior to that of culture or DFA (3, 7, 10, 11, 17, 18). While viral culture for HSV encephalitis is still routinely employed in the clinical lab, it is only capable of detecting virus in less than 5% of patients with CNS infections (10, 14). De-tection of low viral titers often found in spinal fluid requires the high level of sensitivity that is provided by amplification-based assays (13).
In recent years, real-time PCR has made testing more con-venient. Retime PCR is more amenable to automation, al-lowing higher throughputs and decreased turnaround times. In addition, the implementation of a one-tube closed reaction greatly reduces the possibility for contamination. Besides the potential for sensitivity roughly equivalent to gel detection, the use of target-specific probes in real-time PCR offers an addi-tional level of specificity. These probes also allow the detection of single nucleotide polymorphisms (SNPs) using melt curve analysis, permitting typing of different viral species.
While real-time PCR has been widely adopted for molecular infectious disease testing, real-time technology has often been compared to traditional methods such as culture, with a pre-dictable enhancement in sensitivity (4, 6, 7, 12). The current literature is more limited on the comparative performance of real-time PCR with established PCR formats. There is little definitive published evidence that real-time detection using fluorescent probes is more sensitive than end detection by gel, raising the question of whether real-time PCR is necessarily more sensitive than conventional PCR with gel detection. Therefore, it is essential during the validation of any real-time
assay to compare its performance to something in addition to culture, preferably another well-optimized amplification assay. The presence of an SNP beneath a probe lowers the probe
Tmrelative to the consensus sequence (2, 15). However, when using hybridization probes to detect known sequence polymor-phisms within the target, the potential exists for loss of sensi-tivity due to compromised annealing to mismatched targets. The presence of unexpected SNPs presents an additional chal-lenge to maintaining desired sensitivity. We developed a mul-tiplexed, real-time assay for the detection of HSV-1 and -2, using a novel type of hybridization probe termed the Eclipse probe (Epoch Biosciences) (1, 9). As a further assay improve-ment, we introduced an internal control into the sample ex-traction, allowing us to monitor nucleic acid extraction and detect inhibition of the PCR. In this report we describe the assay and its clinical validation. Furthermore, we present data from both our Eclipse probe assay and a Roche LightCycler assay that illustrate potential loss of sensitivity encountered when developing assays that attempt to distinguish sequence variants by melting analysis. This report is the first to demon-strate that sequence polymorphisms under the probe can neg-atively affect sensitivity in a real-time PCR assay. Our findings have general implications for this form of real-time testing.
MATERIALS AND METHODS
Specimens.During the clinical validation of this assay, we tested 323 samples (amniotic fluids, spinal fluids, plasma samples, serum samples, bronchioalveolar lavage fluids, ocular fluids, swab samples, and tissues). Due to the infrequent number of positive samples obtained for ocular fluids, amniotic fluids, bron-chioalveolar fluids, and tissues, most or all of the positive samples for these sample types were spiked. In these cases, positive control material was diluted into the appropriate HSV-negative sample type, at a ratio of 1:1. We obtained all unspiked positive samples from the clinical lab. These samples had previously been identified as HSV positive using the current PCR assay (gel detection). Positive control material consisted of cell culture material (mixture of HSV-1 and HSV-2 obtained from the ARUP Virology Lab; approximate concentration of 5,000 copies per ml) diluted to have a crossing threshold of approximately 35. A negative control of extracted water was included in each run.
* Corresponding author. Mailing address: ARUP Institute for Clin-ical and Experimental Pathology, 500 Chipeta Way, Salt Lake City, UT 84108. Phone: (801) 583-2787, ext. 2809. Fax: (801) 584-5109. E-mail: [email protected].
2391
on May 16, 2020 by guest
http://jcm.asm.org/
Internal control.The internal control for this assay is a plasmid containing a transcriptional fusion of green fluorescent protein (GFP) coding sequence
down-stream of aCaenorhabditis eleganspromoter. The forward primer is within theC.
eleganssequence with the reverse primer in the GFP gene, creating an amplicon that spans the breakpoint between the two regions.
Extractions.With the exception of the tissue samples that were extracted with the Puregene tissue extraction kit, all samples were extracted using the QIAGEN
96-well blood kit, with a few minor modifications. Protease (25l), patient
sample (200l), and prewarmed lysis buffer AVL (200l) were added to each
well of the round well block in that order. For quality control of the extraction, the internal control was added to the lysis buffer at a concentration of 50,000 copies per ml (10,000 copies per extraction). The block was then shaken for 15 seconds and spun down briefly at 3,000 rpm. The block was incubated at 70°C for
10 min and spun down as before. A 200-l volume of ethanol was added to each
extraction, and the block was shaken for 15 seconds and spun down again briefly at 3,000 rpm. Samples were transferred to the filter plate, covered with airpore tape, and spun for 4 min at 6,000 rpm to apply the samples to the filter. The
samples were washed with 500l of buffer AW1 (spun for 2 min at 6,000 rpm)
and 500l of buffer AW2 (spun for 3 min at 6,000 rpm). The filter block was
incubated for 10 min at 70°C. The filter plate was placed over the collection
tubes, and 50l of prewarmed elution buffer (buffer AE; 70°C) was added. The
plate was incubated at 70°C for 5 min and spun for 4 min at 6,000 rpm. An
additional 50l of elution buffer was added to each sample well, and the plate
spun another 4 min at 6,000 rpm.
PCR assay with gel detection.The PCR assay amplifies a 179-bp region from the HSV DNA polymerase gene (5, 10, 12). Samples were extracted as described
above. Ten microliters of extracted patient sample was added to 40l of master
mix. The master mix contained primers (forward, ATCAACTTCGACTGGCC CTT; reverse, CCGTACATGTCGATGTTCAC) at 500 nM, deoxynucleoside
triphosphates (dNTPs) at 250M with UTP at 500M, MgCl2at 2.75 mM, 0.5
U of UNG, AmpliTaq LD, and TaqStart antibody in Tris-EDTA (TE) buffer.
The PCRs were run using the following cycling parameters: 10 min at 50°C followed by 45 cycles of 94°C for 5 seconds, 64°C for 5 seconds, and 72°C for 20 seconds. These were followed by a 72°C hold until samples could be retrieved.
Following amplification, 10l of each product was analyzed by gel
electrophore-sis.
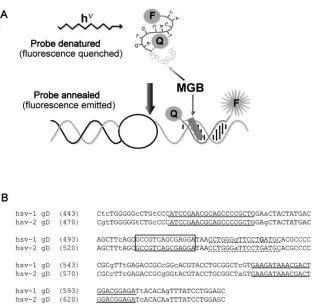
Eclipse probes.Eclipse probes are similar to TaqMan probes, both being dual labeled with a fluorescent dye and a quenching molecule, but differing in the orientation of the probe and quencher (Fig. 1a). Eclipse probes have the
fluo-rescent dye attached to their 3⬘end, with a nonfluorescent, dark quencher on the
5⬘end, while TaqMan probes have the opposite orientation. Another key feature
of the Eclipse probe is the incorporation of a minor groove-binding molecule
(MGB) at the 5⬘end, adjacent to the quencher. This minor groove binder, which
is structurally similar to many naturally occurring antibiotics, serves a dual function. It stabilizes the binding between the probe and target molecule, allow-ing shorter probes to be used, and blocks probe hydrolysis that occurs when the
advancingTaqpolymerase encounters a TaqMan probe. Consequently, rather
than being cleaved and consumed during the reaction, Eclipse probes remain available to be used in a dissociation analysis. In contrast to TaqMan hydrolysis probes, an Eclipse hybridization probe allows amplified products to be confirmed by their specific melting temperatures, as well as allowing different variants of target sequences (SNPs) to be identified. (Typing of variants can be accom-plished with TaqMan probes, but this requires the use of two probes and two different fluorescent dyes.)
Real-time HSV assay.For the real-time HSV assay, 10l of extracted sample
was added to 40l of reaction master mix. The master mix consisted of 5l
Roche FastStart Master hybridization probes mix that contains dNTPs (with
UTP), MgCl2, buffer, andTaqpolymerase (Roche Diagnostics), HSV upstream
primer at 1.2M, HSV downstream primer at 100 nM, internal control upstream
and downstream primers at 300 nM each, HSV Eclipse probe at 200 nM, internal
control Eclipse probe at 50 nM (Table 1), 5l PCR enhancer (Epicentre), ROX
[image:2.585.137.468.64.370.2]passive reference (Synthegen) at 60 nM, and 0.5 U of UNG (Perkin Elmer). This
FIG. 1. HSV Eclipse probe design. (a) Schematic diagram of an Eclipse hybridization probe. MGB indicates the minor groove-binding moiety. F indicates the fluorescent dye, and Q represents the quenching molecule. (b) Alignment of HSV-1 (gi:330064) and HSV-2 (gi:517467) glycoprotein D (gD) sequences surrounding the amplified fragment. Lowercase letters indicate polymorphisms between HSV-1 and -2. Primer sequences are underlined with solid lines. The dashed underline indicates the original probe sequence. Within this sequence, the bold G indicates the novel polymorphism that was identified. The final probe sequence is boxed.
on May 16, 2020 by guest
http://jcm.asm.org/
master mix was supplemented with 25 mM MgCl2to obtain a final reaction Mg
concentration of 4 mM.
The Applied Biosystems HT7900 apparatus was programmed with the follow-ing amplification protocol: 2 min at 50°C for one cycle, 8 min at 95°C for one cycle, followed by 50 cycles of PCR (15 seconds at 95°C, 30 seconds at 58°C, and 30 seconds at 76°C). The amplification program was followed by a melting curve analysis consisting of 95°C for 15 seconds, 45°C for 15 seconds, and 95°C for 15 seconds. The temperature ramp rate was set to 100% for all steps except the final ramp between 45°C and 95°C, which was set to 5%. Fluorescence signal was acquired at the annealing stage during amplification (58°C) and during the final temperature ramp. The HT7900 amplifies and continuously detects the fluores-cence of each well in the plate in real time. Amplification is detected by the hybridization and resulting fluorescence of a labeled Eclipse probe at the an-nealing step of each cycle. In the Molecular Infectious Disease lab at ARUP, all positive HSV samples are retested. The extracted sample is run again, and the original patient sample is reextracted and run in duplicate.
Roche LSR assay.The Roche LSR experiments were performed on the Light-Cycler according to the package insert. Extractions were done using the QIA-GEN 96-well blood kit protocol described above. Roche competitive internal
control was added prior to extraction at a concentration of 5l per 50-l extract
volume (total of 10l added for each QIAGEN extract).
RESULTS
We initially evaluated a primer and Eclipse probe combina-tion designed by Epoch Biosciences. This original version of the assay amplified a 142-bp segment of the glycoprotein D gene containing a single polymorphism beneath the probe to distinguish between HSV-1 and HSV-2 (Fig. 1b). The probe was a perfect match to the HSV-1 sequence and melted at approximately 63°C. TheTmfor HSV-2 was about 58°C. How-ever, during our preliminary validation of true HSV-positive patient samples from the clinical lab, an unacceptably large number of samples (9/22 on one run) failed to be detected (data not shown). Interestingly, samples that did not display amplification plots occasionally generated distinct dissociation curves. We evaluated theTms of these discrepant samples and found that a majority (6/9) were HSV-2, melting at the anneal-ing and data acquisition temperature for the assay (58°C). A few of these amplification reactions were removed from a 96-well plate and run on a gel to determine whether amplifi-cation had occurred. The gel results suggested that these sam-ples had indeed amplified but failed to generate detectable fluorescence during probe annealing (data not shown). We conclude from these results that amplification occurred nor-mally, but detection of the product by the probe was inefficient. Because fluorescence was being acquired at 58°C during the amplification (Tmfor HSV-2), samples with low HSV titers were generating insufficient signal to be detected. However, during the dissociation analysis, the reaction temperature was lowered to 45°C (below the probeTm), allowing efficient probe
binding to the HSV-2 amplicon and consequently generating a dissociation curve.
One of the discrepants identified above revealed a third class of isolates that display melting temperatures at approximately 55°C, below those predicted for either HSV-1 or HSV-2. We tested a number of HSV-positive samples from the clinical lab and identified three additional examples of this class. Again, these isolates displayed the predicted amplicon size when run on a gel. We sequenced two of these amplicons and deter-mined that both included an additional polymorphism within the region covered by the probe. Each contained a C instead of a G at position 13 of the sequence bound by the probe (Fig. 1b). Examination of the remainder of the amplicon sequence distinguished these isolates as variants of HSV-1 (data not shown). We conclude that, depending upon the design of the amplification reaction and theTmof the probe for each vari-ant, there exists the potential for a loss of sensitivity in assays that distinguish between variants based on sequence polymor-phisms.
We initially tried lowering the annealing temperature of the assay to 56°C, hoping to achieve better probe binding to the HSV-2 target, but saw no improvement. Possibly, the attempt to improve probe binding may have deoptimized primer bind-ing. Based on these observations, we chose to move the probe to a region that lacks known polymorphisms, resulting in a nontyping format.
In the modified version of this assay, we retained the same primers as the original assay but moved the probe just up-stream (Fig. 1b). We also preserved the original PCR cycling conditions. When tested against commercially available DNA (Advanced Biotechnologies), amplification plots from serial dilutions of HSV-1 and HSV-2 were indistinguishable, as were the dissociation curves (data not shown).
We compared this Eclipse probe real-time assay with the PCR assay currently being performed in the Molecular Infec-tions Disease Laboratory at ARUP. This assay uses gel elec-trophoresis as the detection method. Table 2 summarizes the results of this validation. We assayed a total of 323 samples, 171 negatives and 152 positives, comprising eight different sample types (amniotic fluid, spinal fluid, bronchioalveloar la-vage fluid, ocular fluid, serum, plasma, tissue, and swab sam-ples). The real-time assay agreed with the reference method for 319 out of the 323 samples tested (99%). Of the 43 spinal fluid samples tested (21 negatives and 22 positives), there were no discrepants. One patient that generated a weak band on a gel was detected in two out of three replicates on the Eclipse assay. We interpret this to indicate that the sample contained
TABLE 1. Primer and probe sequences
Primer or probe Sequence (5⬘-3⬘)b
HSV MGBaEclipse probe ...TCC TCG CTG ACG GC-FAM
Internal control MGB Eclipse probe ...TGC GGT ACG TGG TC-TET HSV forward primer ...ATC CGA ACG CAG CCC CGC TG HSV reverse primer ...TCT CCG TCC AGT CGT TTA TCT TC Internal control forward primer...CTG CAC GGA CCA GTT ACT TTA CG Internal control reverse primer...CTC ATT TTT TCT ACC GGA GAT CTT GT
aMGB, minor groove binding.
bFAM, carboxyfluorescein; TET, tetrachlorofluorescein.
on May 16, 2020 by guest
http://jcm.asm.org/
a very low titer of virus and detection was likely limited by sampling error. (This sample was not classified as a discrep-ant.) We assayed one serum sample that had been reported as negative in the clinical lab but was reproducibly positive by the real-time assay. There was insufficient sample to repeat anal-ysis by the reference method. The three remaining discrepants were spiked, low-positive bronchioalveolar lavage samples. These were assayed on a run that displayed abnormal baseline drift. Although they generated detectable amplification on the multicomponent and/or amplification plots, the total fluores-cence for these samples at the end of the reaction did not exceed the baseline fluorescence, and technically they had to be classified as negatives.
Limits of detection for the test were determined by assaying serial twofold dilutions of positive control material in each sample type (except tissue). Our results indicated that HSV is detectable down to approximately 150 copies per ml in spinal fluid (equivalent to approximately 3 copies per reaction mix-ture), which is near the theoretical limit imposed by sampling error.
To determine the reproducibility of the assay, we performed both within-run and between-run precision studies. For be-tween-run precision, we ran 10 samples (9 positives, 1 nega-tive) once per day for three consecutive days. The standard deviation (SD) for the crossing thresholds was 1.7, with a coefficient of variation (CV) of 4.7%. The mean crossing thresholds for these samples ranged from 21 to 44. One outlier sample gave atypical replicates of 50, 21, and 36 (SD, 14.5; CV, 40.3%). If this sample is eliminated from the data set, the standard deviation is 0.3 with a CV of 0.7%. For within-run precision, we assayed 10 positive samples in triplicate on the same run. The standard deviation was 1.0 with a CV of 2.8%. The mean crossing thresholds for these samples ranged from 20 to 43.
Samples known to be positive for other infectious agents were run in this assay to determine whether there is any cross-reactivity with other targets. These samples were positive con-trol materials (culture) from other assays currently being run in the clinical lab at ARUP. No cross-reactivity with Epstein-Barr virus, cytomegalovirus, varicella-zoster virus,Borrelia burgdor-feri, enterovirus, parvovirus,Bordetella pertussis/parapertussis,
Toxoplasma gondii, influenza virus A and B,Mycoplasma pneu-moniae, human immunodeficiency virus (HIV), or adenovirus was seen in this assay.
In the course of validating and running this modified assay,
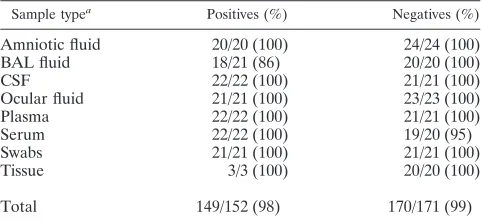
we again identified a small number of HSV-positive samples that either failed to be detected or generated weak amplifica-tion plots. These samples displayed melting curves that indi-cated aTmmuch lower than what was predicted for this se-quence. We sequenced the amplicons for four of these isolates and discovered they all contained a polymorphism within the probe-binding region, which was not predicted from the con-sensus sequence. Figure 2a shows the sequence in the probe-binding region for these four isolates, as well as the consensus sequences for HSV-1 and HSV-2 (the probe sequence is shown at the bottom). The final nucleotide in the sequence (A for HSV-2, G for HSV-1) is a polymorphism that allows HSV-1 and-2 to be differentiated. Clearly, unexpected polymorphisms appear in both HSV-1 and HSV-2 isolates, although at least in the cases we examined, they appeared in different positions. Figure 2b shows the amplification plot for isolate B. Curve 1 is a positive control, curves 2 and 3 are duplicate amplifications of isolate B, and curve 4 is a negative control. This atypical HSV isolate generated one weak amplification plot (2) and one that was indistinguishable from the negative control (3). How-ever, when the dissociation curves were examined (Fig. 2c), it is clear that isolate B was amplified in both replicates (num-bering is the same as in Fig. 2b). Specifically, the dissociation plots for isolate B (melting curves 2 and 3) should be compared with the plot for the negative control (curve 4). Furthermore, it is evident that the Tm for isolate B is significantly lower (approximately 55°C) than for the positive control sample (ap-proximately 62°C). To ensure that we do not miss positive specimens of this type, at ARUP we routinely examine the dissociation curves of all samples that give a negative result on the amplification plot.
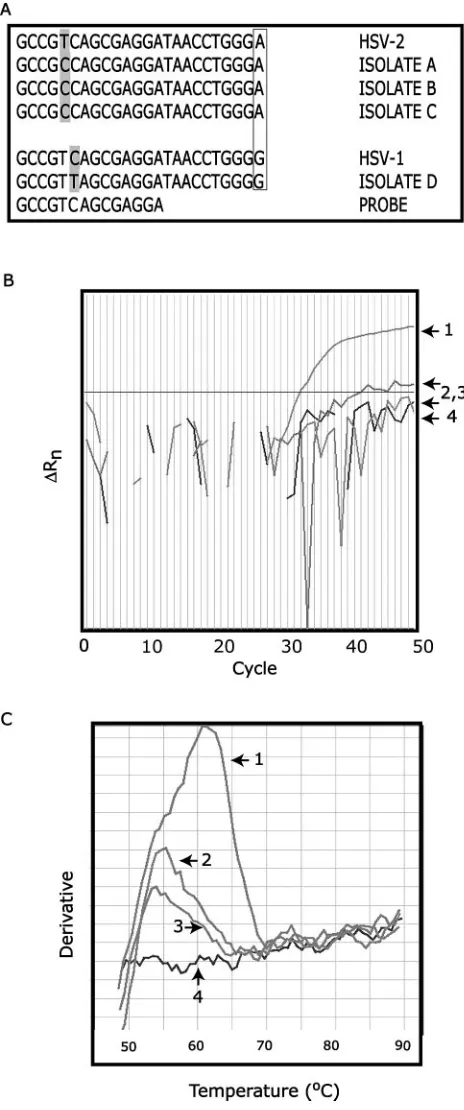
To evaluate the sensitivity of our Eclipse probe assay relative to another real-time test, we compared it with an LSR kit (life science research) distributed by Roche. The reagents in this kit are identical to those contained in Roche’s HSV-1/2 ASR kit (analyte-specific reagent) that is currently available and being used in a number of labs in the United States. With this kit, we assayed serial dilutions of commercially available HSV-1 and HSV-2 DNA (Advanced Biotechnologies, Inc.) on the Light-Cycler. Dilutions ranged from 10⫺2(calculated concentration
of 100 copies per microliter, 500 copies per reaction mixture) down to 10⫺5(0.1 copy per microliter, 0.5 copies per reaction
mixture). Figure 3a shows the LightCycler amplification plots of HSV-1 (each dilution in duplicate) and HSV-2 (each dilu-tion run singly). The amplificadilu-tion plots for the positive con-trols and the dilutions are marked on the right. The corre-sponding dissociation curves are shown in Fig. 3b. Our analysis of the LightCycler amplification plots reveals two interesting observations. First, the amplification curves for HSV-1 at 10⫺3
and HSV-2 at 10⫺4 are nearly identical, suggesting that the
sensitivity for detecting HSV-1 in this assay is reduced approx-imately 10-fold relative to HSV-2. The lower melting temper-ature for HSV-1, as revealed by the dissociation curve, indi-cates that this variant carries at least one polymorphism beneath the probe. This loss of sensitivity is strikingly similar to what we observed with our original HSV Eclipse assay, where we tried identifying HSV-1 and 2 using a type-specific SNP. Our second finding reveals that this LightCycler assay is ap-proximately 10-fold (for HSV-2) to 100-fold (for HSV-1) less sensitive than our reconfigured Eclipse assay, where we
de-TABLE 2. Validation data for the HSV Eclipse assay
Sample typea Positives (%) Negatives (%)
Amniotic fluid 20/20 (100) 24/24 (100)
BAL fluid 18/21 (86) 20/20 (100)
CSF 22/22 (100) 21/21 (100)
Ocular fluid 21/21 (100) 23/23 (100)
Plasma 22/22 (100) 21/21 (100)
Serum 22/22 (100) 19/20 (95)
Swabs 21/21 (100) 21/21 (100)
Tissue 3/3 (100) 20/20 (100)
Total 149/152 (98) 170/171 (99)
aBAL, bronchoalveolar; CSF, cerebrospinal fluid.
on May 16, 2020 by guest
http://jcm.asm.org/
[image:4.585.43.284.81.192.2]tected both variants down to the 10⫺5dilution (Fig. 3c). We
tested only the two most dilute extracted samples (10⫺4and
10⫺5) with our Eclipse probe assay. (Since it is impossible to
reproducibly detect a calculated 0.5 copies per reaction mix-ture, which corresponds to the 10⫺5dilution, we presume that
there is some level of inaccuracy in the quantitation of the commercial standard.)
These differences in sensitivity prompted us to estimate the fraction of HSV-positive samples that would have gone unde-tected in the ARUP clinical lab, had we been using the Roche LightCycler assay. To make a conservative estimate, we de-fined the Roche assay’s limit of detection as 10⫺3for HSV-1
and 10⫺4 for HSV-2 (Fig. 3a), meaning that we would not
detect HSV-1 samples that were less than the 10⫺3 dilution
and HSV-2 samples that were less than the 10⫺4dilution. We
then examined the crossing thresholds for these dilutions on the Eclipse amplification plot (Fig. 3c). We estimated that any HSV-1 samples withCts less than 40 would go undetected and any HSV-2 samples withCts less than 42 would be missed. Examining 2 months of results from the ARUP clinical lab (HSV-positive samples only), the data suggest that between 7% (cutoffCtof 42) and 15% (cutoffCtof 40) of these positives samples would have gone undetected using the Roche assay.
DISCUSSION
There is currently a need for standardized commercially available kits to support HSV molecular testing, forcing labs to develop assays in-house. Designing and optimizing any new PCR assay can be a daunting task, requiring attention to a host of variables. In recent years, real-time PCR technology has been increasingly adopted in the field of clinical infectious disease, providing an attractive option for pathogen detection. Even so, replacing traditional gel detection methods with flu-orescent probes in real-time PCR is no guarantee of improved performance. We observe that either method, when well opti-mized, can perform with good sensitivity. While real-time PCR provides a number of advantages, these must be balanced against any potential disadvantages. Benefits include a closed tube format that minimizes the possibility of amplicon contam-ination, the potential for higher throughput, lower cost, in-creased compatibility with robotics, and dein-creased hands-on time for the technologist. However, our experience in design-ing real-time tests reveals that polymorphisms within the tar-get, both expected and unexpected, can seriously compromise the sensitivity of an assay.
The presence of base pair mismatches between the probe and target will lower theTmof this interaction. For hybridiza-tion probes, if the annealing temperature of a reachybridiza-tion is at or above theTmfor the mismatch, probe binding is reduced and, as a consequence, the fluorescent signal is diminished. This reduction in fluorescence contributes to a lower assay sensitiv-ity. A similar problem can potentially occur with TaqMan hydrolysis probes, which are displaced, rather than cleaved, when positioned over an SNP. Nucleic acid targets with un-known polymorphisms present an even more difficult challenge and may contribute to false-negative reporting.
[image:5.585.43.275.94.649.2]Our experience with three different HSV assays indicates that polymorphisms beneath the probe reduce the ability to detect target that has been properly amplified. In the assay
FIG. 2. SNP detection. (a) Sequences of atypical HSV isolates. Locations of novel polymorphisms are shaded. Boxed nucleotides in-dicate known polymorphism that allows HSV-1 and HSV-2 to be distinguished. (b) Amplification plots for isolate B (2 and 3) with positive (1) and negative (4) controls. (c) Dissociation curves for iso-late B (2 and 3) with positive (1) and negative (4) controls.
on May 16, 2020 by guest
http://jcm.asm.org/
FIG. 3. Comparison of Eclipse and Roche assay sensitivities. (a) Amplification plots for Roche LSR kit. Dilutions are marked on the right. No-template control, 10⫺5dilution for HSV-2 and the two lowest dilutions of HSV-1 all lie in the region marked with a star. (b) Dissociation curves for Roche LSR kit. Positive control contains both HSV-1 and HSV-2. (c) Sensitivity of Eclipse HSV assay, showing 10⫺4and 10⫺5dilutions of HSV-1 and HSV-2.
on May 16, 2020 by guest
http://jcm.asm.org/
described here, we have addressed these difficulties in two ways. First, we chose to avoid known SNPs that distinguish HSV-1 from HSV-2, and we placed our probe in a region of the glycoprotein D gene where the two sequences are identical. Although this assay does not distinguish between these types, it has approximately equal sensitivity for both. Although there are circumstances where typing may be clinically useful, the overriding priority for this assay is extreme sensitivity, partic-ularly with CSF samples. Second, we have chosen to use a hybridization probe that is not hydrolyzed during the reaction, allowing a postamplification dissociation analysis. During this melting phase of the reaction, lowering the temperature well below the predictedTmfor most potential variants will pro-mote efficient probe binding, allowing the detection of PCR products that may be undetectable during the amplification phase. By examining the melting profiles of all samples that are negative on the amplification plot, we are able to detect most unknown sequence variants. In our hands, the comparative sensitivity of target detection using the dissociation curve ver-sus the amplification plot varies among assays.
The HSV assay described in these studies employs the re-cently developed Eclipse probe system from Epoch Bio-sciences. Like molecular beacons, Eclipse probes require only a single-oligonucleotide probe reagent for hybridization-based interrogation of real-time amplification reactions, simplifying design, optimization, and subsequent quality control (QC) of test reagents compared to dual-oligonucleotide FRET probes. In addition, the presence of a 5⬘minor groove-binding group at the 5⬘end allows for the design of significantly shorter probes at a givenTmand affords good protection from exonuclease hydrolysis during PCR cycling. As demonstrated in these stud-ies, the ability to perform high-quality melt analysis following amplification affords another level of interrogation compared to hydrolysis chemistries. Although Eclipse probes are theo-retically compatible with a variety of amplification chemistries and platforms, care should be taken to ensure that the avail-able fluorescent modifiers have spectral properties that are well suited for a given detection instrument.
A final consideration in the design of this HSV assay is the use of an internal control. The addition of an internal control to samples before extraction reveals whether the sample was extracted efficiently and monitors inhibition of the PCR (8). An internal control can be designed as either competitive or noncompetitive, depending on whether it is amplified with the same primer pair as the target. Competitive internal control systems exist that minimally effect target amplification (E. Konnick, S. Williams, E. Ashwood, and D. Hillyard, Abstr. Pan Am. Soc. Clin. Virol., 19th Ann. Clin. Virol. Symp., abstr. M40, 2003). In other assays however, significant competition between the target and internal control has been demonstrated (16). The potential for an internal control to compete with target amplifi-cation may be reduced when using a noncompetitive internal control. This potential competition is of great importance when analyzing samples with low target concentrations, such as HSV in spinal fluid. Another advantage of a heterologous target is that it can serve as a “universal” internal control for a wide variety of different assays. One disadvantage of a noncompetitive internal control is the potential for its amplification efficiency to differ from that of the target. Furthermore, amplification of the internal control may be affected differently by PCR inhibitors. These
po-tential problems can generally be avoided by careful selection and validation of the internal control target. However, the advantages and disadvantages of either type of internal control should always be considered.
The concentration of internal control introduced into the reaction mixture is an important consideration when setting up a multiplex reaction. The copy number must be sufficient to consistently amplify, yet not so high that it significantly affects the sensitivity of the assay. When our internal control was multiplexed with the HSV reaction, no significant effects of on the HSV assay sensitivity were detected.
Here we describe a high-throughput real-time PCR assay for detecting HSV-1 and 2, utilizing the novel Eclipse hybridiza-tion probe system. Our results demonstrate that sequence polymorphisms within the probe-binding region of an ampli-con can adversely effect the sensitivity of real-time PCR assays. We highlight some of the difficulties that SNPs can introduce into real-time assay design, with the goal of helping others become more aware of these issues and avoiding many of these pitfalls.
REFERENCES
1.Afonina, I. A., M. W. Reed, E. Lusby, I. G. Shishkina, and Y. S. Belousov. 2002. Minor groove binder-conjugated DNA probes for quantitative DNA
detection by hybridization-triggered fluorescence. BioTechniques 32:940–
944, 946–949.
2.Anderson, T. P., A. M. Werno, K. A. Beynon, and D. R. Murdoch.2003. Failure to genotype herpes simplex virus by real-time PCR assay and melting curve analysis due to sequence variation within probe binding sites. J. Clin.
Microbiol.41:2135–2137.
3.Aurelius, E., B. Johansson, B. Skoldenberg, A. Staland, and M. Forsgren. 1991. Rapid diagnosis of herpes simplex encephalitis by nested polymerase
chain reaction assay of cerebrospinal fluid. Lancet337:189–192.
4.Burrows, J., A. Nitsche, B. Bayly, E. Walker, G. Higgins, and T. Kok.2002. Detection and subtyping of herpes simplex virus in clinical samples by
Light-Cycler PCR, enzyme immunoassay and cell culture. BMC Microbiol.2:12.
5.Cunningham, E. T., Jr., G. A. Short, A. R. Irvine, J. S. Duker, and T. P. Margolis.1996. Acquired immunodeficiency syndrome-associated herpes simplex virus retinitis. Clinical description and use of a polymerase chain
reaction-based assay as a diagnostic tool. Arch. Ophthalmol.114:834–840.
6.Espy, M. J., T. K. Ross, R. Teo, K. A. Svien, A. D. Wold, J. R. Uhl, and T. F. Smith.2000. Evaluation of LightCycler PCR for implementation of
labora-tory diagnosis of herpes simplex virus infections. J. Clin. Microbiol.38:3116–
3118.
7.Espy, M. J., J. R. Uhl, P. S. Mitchell, J. N. Thorvilson, K. A. Svien, A. D. Wold, and T. F. Smith.2000. Diagnosis of herpes simplex virus infections in
the clinical laboratory by LightCycler PCR. J. Clin. Microbiol.38:795–799.
8.Hoorfar, J., B. Malorny, A. Abdulmawjood, N. Cook, M. Wagner, and P. Fach.2004. Practical considerations in design of internal amplification
con-trols for diagnostic PCR assays. J. Clin. Microbiol.42:1863–1868.
9.Kutyavin, I. V., I. A. Afonina, A. Mills, V. V. Gorn, E. A. Lukhtanov, E. S. Belousov, M. J. Singer, D. K. Walburger, S. G. Lokhov, A. A. Gall, R. Dempcy, M. W. Reed, R. B. Meyer, and J. Hedgpeth.2000. 3⬘-minor groove binder-DNA probes increase sequence specificity at PCR extension
temper-atures. Nucleic Acids Res.28:655–661.
10.Lakeman, F. D., R. J. Whitley, et al.1995. Diagnosis of herpes simplex encephalitis: application of polymerase chain reaction to cerebrospinal fluid from brain-biopsied patients and correlation with disease. J. Infect. Dis.
171:857–863.
11.Loeffelholz, M. J., C. J. Thompson, K. S. Long, and M. J. Gilchrist.1999. Comparison of PCR, culture, and direct fluorescent-antibody testing for
detection ofBordetella pertussis. J. Clin. Microbiol.37:2872–2876.
12.Madhavan, H. N., K. Priya, A. R. Anand, and K. L. Therese.1999. Detection of herpes simplex virus (HSV) genome using polymerase chain reaction (PCR) in clinical samples comparison of PCR with standard laboratory
methods for the detection of HSV. J. Clin. Virol.14:145–151.
13.Mitchell, P. S., M. J. Espy, T. F. Smith, D. R. Toal, P. N. Rys, E. F. Berbari, D. R. Osmon, and D. H. Persing.1997. Laboratory diagnosis of central nervous system infections with herpes simplex virus by PCR performed with
cerebrospinal fluid specimens. J. Clin. Microbiol.35:2873–2877.
14.Nahmias, A. J., R. J. Whitley, A. N. Visintine, Y. Takei, and C. A. Alford, Jr. 1982. Herpes simplex virus encephalitis: laboratory evaluations and their
diagnostic significance. J. Infect. Dis.145:829–836.
15.Schalasta, G., A. Arents, M. Schmid, R. W. Braun, and G. Enders.2000. Fast
on May 16, 2020 by guest
http://jcm.asm.org/
and type-specific analysis of herpes simplex virus types 1 and 2 by rapid PCR
and fluorescence melting-curve-analysis. Infection28:85–91.
16.Stocher, M., and J. Berg.2002. Normalized quantification of human cyto-megalovirus DNA by competitive real-time PCR on the LightCycler
instru-ment. J. Clin. Microbiol.40:4547–4553.
17.Tang, Y. W., P. S. Mitchell, M. J. Espy, T. F. Smith, and D. H. Persing.1999.
Molecular diagnosis of herpes simplex virus infections in the central nervous
system. J. Clin. Microbiol.37:2127–2136.
18.Tilley, P. A., M. V. Kanchana, I. Knight, J. Blondeau, N. Antonishyn, and H. Deneer.2000. Detection of Bordetella pertussis in a clinical laboratory by culture, polymerase chain reaction, and direct fluorescent antibody staining;
accuracy, and cost. Diagn. Microbiol. Infect. Dis.37:17–23.