The Optimization of Surface Roughnessof Al 6061 using
Taguchi Method in Ball Burnishing Process
Deepak Mahajan
*, Ravindra Tajane
***
Production Engineering, Amrutvahini College of Engineering, Sangamner
**
Production Engineering, Amrutvahini College of Engineering, Sangamner
Abstract- Burnishing is a cold-working process in which plasticdeformation occurs by applying a pressure through a very hard and smooth ball or roller on a metallic surface. Improvements in surface finish, surface hardness, wear resistance, fatigue resistance, yield and tensile strength and corrosion resistance can be achieved by the application of this process.
The experimental studies were conducted under varying Burnishing forces, speeds, feeds, and lubricants. The settings of burnishing parameters were determined by using the Taguchi’s experimental design method. The optimum burnishing parameter combination was obtained by using the analysis of signal-to-noise (S/N) ratio. The confirmation tests indicated that it is possible to increase surface hardness and decrease surface roughness significantly by using the Taguchi method. The experimental results confirmed the validity of the used Taguchi method for enhancing the ball burnishing performance and optimizing the process parameters.
Index Terms- Ball burnishing; Surface roughness; Hardness; Taguchi method; Optimization.
I. INTRODUCTION
oensure reliable performance and prolonged service life of modern machinery, its components require to be manufactured not only with high dimensional and geometrical accuracy but also with high surface finish. The surface roughness of engineering parts is a significantdesign specification that is known to have considerableinfluence on properties such as wear resistance and fatigue strength. Perfectly flat surface can never be generated. Surfaces have always irregularities in the form of peaks and valleys. Processes by which surfaces are finished differ in its capabilities concerning finishing action, mechanical and thermal damage, residual stresses and materialsThese processes are divided according to runningin mechanisms into two types: one involves material losssuch as grinding and the other depends on plastic squeezingof the surface where by a redistribution on material is performedwith no material loss (M.H. El-Axir, 2008).
The latter is seenin finishing process such as burnishing which can be achievedby applying a highly polished and hard ball onto metallic surfaceunder pressure as shown in Fig.1.1. This will cause the peaks of the metallicsurface to spread out permanently, when the applied burnishing pressure exceeds the yield strength of the metallicmaterial to fill the valleys and some form of smoothing takesplace. Besides producing a good surface quality, the burnishingprocess has additional advantages over machining
processes, such as securing increased hardness, corrosion resistance and fatigue life as result of the produced compressive residual stress on the surfaces (Hassan and Al-Bsharat, 1996).A literature survey shows that work on burnishing has been conducted by many researches.
Optimization of process parameters is the key step in the Taguchi method to achieving high quality without increasing cost. This is because optimization of process parameters can improve quality and the optimal process parameters obtained from the Taguchi method are insensitive to the variation of environmental conditions and other noise factors. Basically, classical process parameter design is complex and not easy to use.
An advantage of the Taguchi method is that it emphasizes a mean performance characteristic value close to the target value rather than a value within certain specification limits, thus improving the product quality. Additionally, Taguchi's method for experimental design is straightforward and easy to apply to many engineering situations, making it a powerful yet simple tool. It can be used to quickly narrow the scope of a research project or to identify problems in a manufacturing process from data already in existence (Ugur Esme, 2009).
Fig.1.1.Scheme of ball burnishing [9]
II. EXPERIMENTAL WORK A. Workpiece Material and Specimen Preparation:
In this work aluminium (Al 6061) was used as workpiece material with 68 HRB. The chemical composition of the material is as shown in table 8.1.1. This material was selected because of its importance in industry and its susceptibility to degradation when burnished,through surface and subsurface damage. Aluminium alloys are particularly well suited for parts and structures requiring high strength-to-weight ratio and are the probably the best known materials used extensively in aircraft and truck wheels [16].
The material was received in the form of solid bars with diameter 24 and was then cut onto power hack saw with length 120 and was then machined with a finished cut to diameter 23 and length 110.
B. Burnishing Conditions :
The Burnishing process was carried out on Kirloskar Turn master T-40 Lathe. Only four ball burnishing parameters namely Burnishing force, Speed, Feed and Lubricant were investigated in the study. The forces are applied by manual feed to cause spring deflection and were measured through multiplying the spring deflection by spring stiffness (F= kχ). The applied force range was from 17.1 kgf to 42.75 kgf by causing deflections from 2 to 5 mm. The speed ranges were from 280-630 rpm and feed from 0.056-0.125 mm/rev. The burnishing conditions were lubricated using kerosene, SAE 20W 40 oils and with the addition of graphite powder in SAE 20W 40.
[image:2.612.29.311.61.126.2]The selected burnishing process parameters along with their levels are given in Table 2.2. Each parameter had three levels and interactions between the parameters were not considered in the present study. The experimental set up for the same is shown below. At each set of experimental runs the burnishing tool is pressed against the turned aluminium bar and thus a burnishing operation is carried out at 20mm distance.
Table 2.2. Process parameters and their levels
C. Selection of orthogonal array (OA) :
The selection of an appropriate orthogonal array (OA) depends on the total degrees of freedom of process parameters. Degrees of freedom are defined as the number of comparisons between process parameters that need to be made to determine which level is better and specifically how much better it is. In this study, since each parameter has three levels therefore, the total degrees of freedom (DOF) for the parameters are equal to 8. Basically, the degrees of freedom for the OA should be greater than or at least equal to those for the process parameters. The
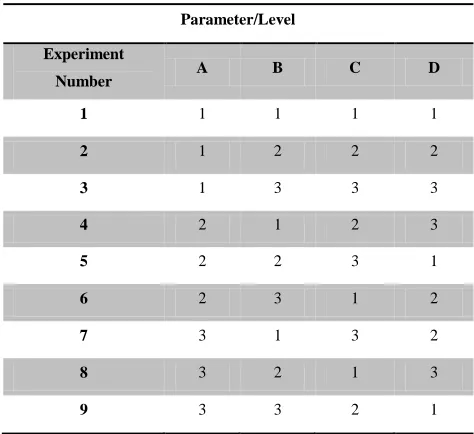
standard L9 orthogonal array has four 3 level columns with 8 DOF. Therefore, an L9 orthogonal array with four columns and nine rows was appropriate and used in this study. The experimental layout for the injection moulding parameters using the L9 OA is shown in Table 2.3. Each row of this table represents an experiment with different combination of parameters and their levels, obtained by using Minitab 16 software.
Fig 2.1. Experimental Set-up
III. RESULTS AND DISCUSSIONS
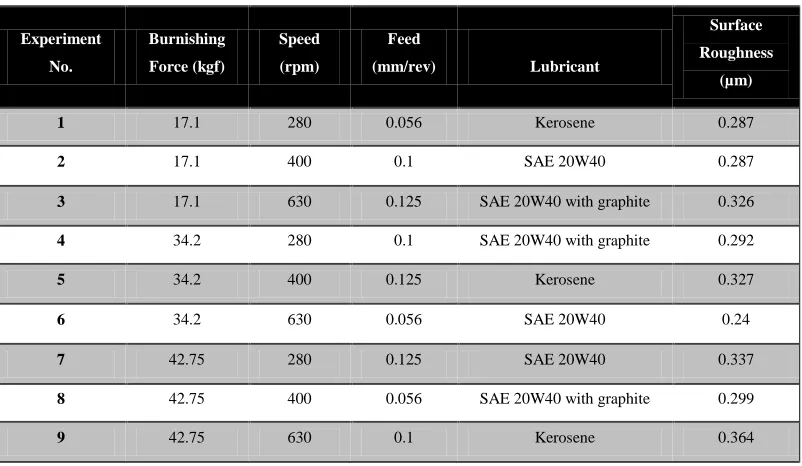
The results, in terms of Surface Roughness were obtained after conducting the burnishing test for all nine specimens. Each test specimen, indeed, represented one experiment in the orthogonal array (Table 2.3). The experimental results for burnishing test under the application of four parameters are summarized in Table 3.1. In the latter, the results were analysed by employing main effects, and the signal-to-noise ratio (S/N) analyses. Finally, a confirmation test was carried out to compare the experimental results with the estimated results.
Table 2.3. Experimental plan using L9 orthogonal array
Parameter/Level
Experiment
Number A B C D
1 1 1 1 1
2 1 2 2 2
3 1 3 3 3
4 2 1 2 3
5 2 2 3 1
6 2 3 1 2
7 3 1 3 2
8 3 2 1 3
[image:2.612.314.515.151.305.2]9 3 3 2 1
Table 2.1. Chemical Composition of Al 6061
% Fe % Si % Cu % Cr % Mg % Mn % Zn % Ti % Al 0.678 0.504 0.104 0.023 1.20 0.194 0.086 0.010 97.6
Symbol Parameter Unit Level 1 Level 2 Level 3
A Burnishing Force
Kgf 17.1 34.2 42.75
B Speed Rpm 280 400 630
C Feed mm/rev 0.056 0.1 0.125
D Lubricant - Kerosene SAE 20W 40
[image:2.612.333.570.517.734.2]Table 3.1. Experimental results for Ball Burnishing
A. Main Effects :
Used in conjunction with an analysis of variance and design of experiments to examine differences among level means for one or more factors. A main effect is present when different levels of a factor affect the response differently.A main effects plot graphs the response mean for each factor level connected by a line. General patterns to look for:
When the line is horizontal (parallel to the x-axis), then
there is no main effect present. Each level of the factor affects the response in the same way, and the response mean is the same across all factor levels.
When the line is not horizontal, then there is a main effect
present. Different levels of the factor affect the response differently. The steeper the slope of the line, the greater the magnitude of the main effect.
The values of surface roughness for each factor i.e. A, B, C and D at each level i.e. level 1, level 2 and level 3 were obtained from Minitab 16 and the results are summarized in Tables 3.2.
Table 3.2. Levels average for Surface Roughness main effects
Figure 3.1 presents the main effect graph for surface roughness characteristics. This graph is based on the surface roughness being formed through Minitab 16. The quality characteristics investigated in this study was “the-smaller-the-better” owing to the fact that smaller surface roughness value represents higher surface finish. It can be seen from Figure 3.1 that the combination of parameters and their levels A2B2C1D2 yield the
optimum quality characteristic for surface roughness.
Fig.10.1.1. Main effects graph for Surface Roughness
B. Signal to Noise Ratio (S/N) :
Taguchi experiments often use a 2-step optimization process. In step 1 use the S/N ratio to identify those control factors that reduce variability. In step 2, identify control factors that bring the mean to target and have little or no effect on the S/N ratio.The
42.75 34.20
17.10 0.34
0.32
0.30
0.28
630 400
280
0.125 0.100
0.056 0.34
0.32
0.30
0.28
SA E 20W 40 w ith graphite SA E 20W 40
Kerosene
Burnishing Force ( kgf )
M
e
a
n
o
f
M
e
a
n
s
Speed (rpm)
Feed (mm/rev) Lubricant
Main Effects Plot for Means
Data Means
Experiment No.
Burnishing Force (kgf)
Speed (rpm)
Feed
(mm/rev) Lubricant
Surface Roughness
(µm)
1 17.1 280 0.056 Kerosene 0.287
2 17.1 400 0.1 SAE 20W40 0.287
3 17.1 630 0.125 SAE 20W40 with graphite 0.326
4 34.2 280 0.1 SAE 20W40 with graphite 0.292
5 34.2 400 0.125 Kerosene 0.327
6 34.2 630 0.056 SAE 20W40 0.24
7 42.75 280 0.125 SAE 20W40 0.337
8 42.75 400 0.056 SAE 20W40 with graphite 0.299
9 42.75 630 0.1 Kerosene 0.364
Symbol Parameters/Factors
Average Surface Roughness (µm) Level 1 Level 2 Level 3 A Burnishing Force 0.3000 0.2863 0.3333
B Speed 0.3053 0.3043 0.3100
C Feed 0.2753 0.3143 0.3300
[image:3.612.107.508.89.322.2] [image:3.612.314.588.454.635.2]signal-to-noise (S/N) ratio measures how the response varies relative to the nominal or target value under different noise conditions. You can choose from different S/N ratios, depending on the goal of your experiment.
As mentioned earlier the quality characteristic used in this study was “the-smaller-the-better” and “the-larger-the-better”, i.e. the smaller surface roughness and the higher hardness of the test specimen results in better finish and consequently better performance. In order to perform S/N ratio analysis, mean square deviation (MSD) for quality characteristics and S/N ratio were calculated from the following equations,
Characteristic smaller the better:
MSD =
1/n ∑ yi
²S / N = −Log (MSD)
Where,
y
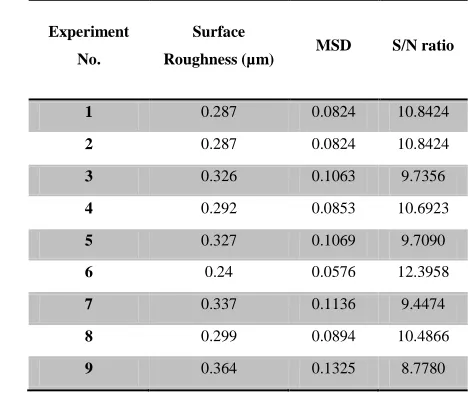
i =is the surface roughness of i th experiment.Using the above two formulae the S/N ratios for the nine experiments were calculated and the results are presented in Table 3.3. It can be seen from this table that for surface roughness experiment number 6 yields the largest S/N ratio and for this experiment the combination of parameters and their levels is A2B3C1D2 as indicated in Table 2.3.
This result is different from those obtained from main effect analysis and does not represent optimum combination of parameters and their levels. However, it shows that in the present case study the combination of parameters and their levels
A2B3C1D2 for surface roughness yield optimum quality
[image:4.612.50.284.523.720.2]characteristic with minimum variance around the target value.
Table 3.3. S/N ratio responses for surface roughness
Experiment
No.
Surface
Roughness (µm) MSD S/N ratio
1 0.287 0.0824 10.8424
2 0.287 0.0824 10.8424
3 0.326 0.1063 9.7356
4 0.292 0.0853 10.6923
5 0.327 0.1069 9.7090
6 0.24 0.0576 12.3958
7 0.337 0.1136 9.4474
8 0.299 0.0894 10.4866
9 0.364 0.1325 8.7780
C. Confirmation Test :
The confirmation experiment is the final step in the first iteration of the design of the experiment process. The purpose of the confirmation experiment is to validate the conclusions drawn during the analysis phase. The confirmation experiment is performed by conducting a test with a specific combination of the factors and levels previously evaluated.
Once the optimal combination of process parameters and their levels was obtained, the final step was to verify the estimated result against experimental value. It may be noted that if the optimal combination of parameters and their levels coincidently match with one of the experiments in the OA, then no confirmation test is required. Estimated value of the bending deflection at optimum condition was calculated by adding the average performance to the contribution of each parameter at the optimum level using the following equations,
yopt = m + (mAopt-m) + (mBopt-m) + (mCopt-m) + (mDopt-m)
and m =
𝑇
𝑁
Where,
m: average performance
T: grand total of response for each experiment N: total number of experiments
mAopt : response for parameter A at its optimum level mBopt : response for parameter B at its optimum level mCopt : response for parameter C at its optimum level mDopt : response for parameter D at its optimum level.
Confirmation test was required in the present case study because the optimum combination of parameters and their levels i.e. A2B2C1D2 and A3B2C3D2 did not correspond to any experiment
[image:4.612.326.572.571.721.2]ofthe orthogonal array.
Table 3.4. Results of confirmation test for Surface Roughness
Optimal Condition
Estimation Experiment Difference Difference (%) Level A2B2C1D2 A2B3C1D2 - - Surface
Roughness
Achieved
(µm )
The values of surface roughness and hardness obtained from the experiment were then compared with the estimated value as shown in Table 3.4.It can be seen that the difference between experimental result and the estimated result is only 0.0059 µm. This indicates that the experimental value of Surface Roughness is very close to the estimated value. This verifies that the experimental result is strongly correlated with the estimated result, as the error is only 0.59%.
III. CONCLUSIONS
Results obtained from the present case study following can be concluded:
1. Favourable and optimum conditions could be predicted for
different requirements of finish, hardness and economy of process. Database developed from the experimental analysis could be very useful for the selection of best possible process parameters and conditions for finishing various machine components, economically.
2. Surface roughness up to 0.24 µm could be achieved by this
process.
3. An optimum parameter combination for the minimum
surface finish and maximum surface hardness was obtained by using the analysis of signal-to-noise (S/N) ratio. The combination of parameters and their levels for optimum
surface roughness is A2B3C1D2 ( i.e. Burnishing force- 34.2
kgf, speed- 630 rpm, feed-0.056 mm/rev, lubricant- SAE 20W 40).
4. The experimental results confirmed the validity of the used
Taguchi method for enhancing the burnishing performance and optimizing the ball burnishing parameters.
REFERENCES
[1] U M Shirsat and B B Ahuja,”Parametric analysis of combined turning and ball burnishing process”, Indian Journal of Engineering and material sciences, Vol.11, October (2004), pp.391-396.
[2] Adel Mahmood Hassan and Amer M.S. Momani,“Further improvements in some properties of shot peened components using the burnishing process”, International Journal of Machine Tools & Manufacture Vol.40 (2000) pp.1775–1786.
[3] Adel Mahmood Hassan and Ayman Mohammad Maqableh, “The effects of initial burnishing parameters on non-ferrous components”, Journal of Materials Processing Technology, Vol.102 (2000), pp.115-121.
[4] Fang-Jung Shiou and Chien-Hua Chen,“Freeform surface finish of plastic injection mold by using ball-burnishing process”, Journal of Materials Processing Technology,Vol.140 (2003),pp. 248–254.
[5] Hudayim Basak and H. Haldun Goktas,”Burnishing process on al-alloy and optimization of surface roughness and surface hardness by fuzzy logic”, Materials and Design ,Vol. 30 (2009),pp.1275–1281.
[6] M.H. El-Axir, O.M. Othman and A.M. Abodiena,” “Improvements in out-of-roundness and micro hardness of inner surfaces by internal ball burnishing process”, Journal of materials processing technology 196 (2008) 120–128.
[7] L.N. Lo´pez de Lacalle et.al. ,“Quality improvement of ball-end milled sculptured surfaces by ball burnishing”, International Journal of Machine Tools & Manufacture 45 (2005) 1659–1668.
[8] Liviu Luca, Sorin Neagu-Ventzel and Ioan Marinescu, “Effects of working parameters on surface finish in ball-burnishing of hardened steels”, Precision Engineering 29 (2005) 253–256.
[9] A.A. Ibrahim et.al., “Center rest balls burnishing parameters adaptation of steel components using fuzzy logic”, Journal of materials processing technology 209 (2009) 2428–2435.
[10] Aysun Sagbas, “Analysis and optimization of surface roughness in the ball burnishing process using response surface methodology and desirability function”,Advances in Engineering Software 42 (2011) 992–998. [11] Feng Lei Li et.al.,“Analytical prediction and experimental verification of
surface roughness during the burnishing process” , International Journal of Machine Tools & Manufacture 62 (2012) 67–75.
[12] K.O. Low and K.J.Wong, “Influence of ball burnishing on surface quality and tribological characteristics of polymers under dry sliding conditions”, Tribology International 44 (2011) 144–153.
[13] Wit Grzesik and Krzysztof Zak, “Modification of surface finish produced by hard turning using superfinishing and burnishing operations”, Journal of Materials Processing Technology 212 (2012) 315–322.
[14] Dabeer P.S. and Purohit G.K.,”Effect of ball burnishing parameters on surface roughness using surface roughness methodology ”,Advances in Production Engineering and Management 5(2010)2,pp.111-116.
[15] Ugur Esme, “Use of grey based Taguchi method in ball burnishing process for the optimization of surface roughness and microhardness of AA7075 aluminum alloy”, mtaec9, 44(3)129(2010).
[16] M.M. El-Khabeery & M.H. El-Axir, “Experimental techniques for studying the effects of milling roller-burnishing parameters on surface integrity”, International Journal of Machine Tools & Manufacture 41 (2001) 1705– 1719.
[17] M.H. El-Axir, “An investigation into roller burnishing”, International Journal of Machine Tools & Manufacture 40 (2000) 1603–1617.
[18] C. S. Jawalar & R. S. Walia,“Study of roller burnishing process on En-8 specimens using design of experiments”,Journal of Mechanical Engineering Research Vol. 1(1) pp. 038-045, November, 2009.
[19] Yinggang Tian & Yung C. Shin, “Laser-assisted burnishing of metals”,International Journal of Machine Tools & Manufacture 47 (2007) 14–22.
[20] N.S.M. El-Tayeb , K.O. Low & P.V. Brevern, “Influence of roller burnishing contact width and burnishing orientation on surface quality and tribological behaviour of Aluminium 6061”,Journal of Materials Processing Technology 186 (2007) 272–278.
[21] S. Thamizhmanii, B. Saparudin & S. Hasan ,“A study of multi-roller burnishing on non-ferrous metals”,Journal of Achievements in Materialsand Manufacturing Engineeringvolume 22 issue 2 June (2007).
[22] Binu C. Yeldose, B. Ramamoorthy,“An investigation into the high performance of TiN-coated rollers in burnishing process”, journal of materials processing technology 207 (2008) 350–355.
[23] S. Thamizhmnaii et.al.,“Surface roughness investigation and hardness by burnishing on titanium alloy”,Journal of Achievements in Materialsand Manufacturing Engineeringvolume 28 issue 2 June (2008).
[24] Tomasz Dyl, “The burnishing strengthen shafts neck of centrifugal pumps”, Journal of KONES Powertrain and Transport, Vol.18, No. 2 (2011). [25] J. Naga Malleswara Rao, A. Chenna Kesava Reddy and P.V. Rama Rao,
“Design and fabrication of new type of dynamometer to measure radial component of cutting force and experimental investigation of optimum burnishing force in roller burnishing process”, Indian Journal of Science and Technology Vol. 3 No. 7 (July 2010).
[26] Khalid. S. Rababa and Mayas Mohammad Al-mahasne,“Effect of Roller Burnishing on the Mechanical Behavior and Surface Quality of O1 Alloy Steel”, Research Journal of Applied Sciences, Engineering and Technology 3(3): 227-233, (2011).
[27] Malleswara Rao J. N. , Chenna Kesava Reddy A. & Rama Rao P. V.,“The effect of roller burnishing on surface hardness and surface roughness on mild steel specimens”, International Journal Of Applied Engineering Research, Dindigul Volume 1, No 4, (2011).
AUTHORS
First Author – Deepak Mahajan, ME (CAD/CAM) pursuing,
Amrutvahini College of Engineering, Sangamner, Ahmednagar, Maharashtra,India,[email protected]
Second Author – Ravindra Tajane, ME
(Mechanical),Amrutvahini College of Engineering, Sangamner, Ahmednagar, Maharashtra,India,[email protected]
Correspondence Author – Deepak Mahajan ,