www.ijsrp.org
Analysis of Object Oriented Metrics
Priyanka Yadav
1, Khalid Hussain
2, Ashima Gambhir
31
M.Tech Student of Computer Science Department, Amity University Haryana
2
Faculty of Computer Science Department, Amity University Haryana
3
Faculty of Computer Science Department, Amity University Haryana
Abstract: Object oriented design, is becoming very popular in software development environment. Object oriented design metrics is an essential part of software environment. Object oriented measurements are used to measure quality of software. The metrics for object oriented design focus on measurements that are applied to the classand design characteristics. These measurements permit designers to access the softwareearly in process, making changes that will reduce complexity and improve the continuingcapability of the design.
This paper summarizes the existing metrics, which will guide the designers to support their design. We have categorized metrics and discussed in such a way that novicedesigners can apply metrics in their design as needed.
Index Terms: Software metrics, Object-oriented metrics, CK metric suite
I. INTRODUCTION
oftware metrics are the quantitative measurement of the complexity of the software or its design; therefore, they are good candidates for guiding the selection of testing techniques. Object-oriented metrics have been studied and proposed as good predictors for fault-prone modules/classes, for program maintainability and for software productivity [1]. Object-oriented programming has many useful features, such as information
hiding, encapsulation, inheritance, polymorphism and
dynamicbinding. These object-oriented features facilitate software reuse and component-based development. However, they might cause some typesof faults that are difficult to detect using traditional testing techniques.
Object oriented metrics are used to measure properties of object oriented designs. Object-oriented software metrics provide such quantitative view about the implementation of object-oriented constructs in software design for the improvement of the software quality. The necessary features of the preferred object oriented metrics are recognized as capability of covering all quality and design related features, capability of representing
diverse system aspects that are measured, capability of obtaining measurement values for a given system at different time, capability to have an experimental validation and capability of reliable operation. [7]
In this paper, we basically analyze CK metrics and their impact on object oriented software.
Next section describes the prior work in the field of object oriented software metrics. Since the third section of this paper describes impact of metrics on software. Fourth section is result and analysis. Finally last section presents some conclusions and future work.
II. LITERATUREREVIEW
A significant number of object oriented metrics have been developed. For example, metrics proposed by Abreu [2], CK metrics [3], Li and Henry [4] metrics, MOOD metrics [5], Lorenz and Kidd [6] metrics etc.
One of the most widely referenced sets of Object Oriented software metrics has been proposed by Chidamber and Kemerer (CK). The authors have proposed six class-based design metrics for Object. The CK metrics suite defines class-oriented software metrics that focus on the class and the class hierarchy. Chidamber and Kemerer worked in collaboration with experienced software engineers and collected data from two different commercial projects. They made some interesting and
practically useful observations on when analyzing their results
.
2.1 Weighted Method per Class (WMC)
This is defined as the sum of the complexity of all the methods defined in a class. If all the Methodcomplexities are reduced to unity, then WMC becomes equal to the number of methods. WMC = sum of cyclomatic complexities of all the methods [8].
Let C be a set of classes each with the number of methods Mi . . .
. Mn. Let Ci . . ., Cn be the complexity (weights) of the classes.
WMC = 𝐶𝑛𝑖 𝑖
www.ijsrp.org
The number of methods and the complexity of methods involved is a predictor of how much time and effort is required to develop and maintain the class. Classes with large number of methods are likely to be more application specific, limiting the possibility of reuse. [13]
High value of WMC indicates the class is more complex than that of low values. So class with less WMC is better. As WMC is complexity measurement metric, we can get an idea of required effort to maintain a particular class.
2.2.Response for a Class (RFC)
The RFC is defined as the total number of methods that can be executed in response to a message to a class. This count includes all the methods available in the whole class hierarchy. If a class is capable of producing a vast number of outcomes in response to a message, it makes testing more difficult for all the possible outcomes. [8]
Definition: RFC = | RS | where RS is the response set for the class.
Theoretical basis: The response set for the class can be expressed as:
RS = { M } ∪ all i {Ri} where { Ri } = set of methods called by
method i and { M } = set of all methods in the class The response
set of a class is a set of methods that can potentially be executed in response to a message received by an object of that class. The cardinality of this set is a measure of the attributes of objects in the class. Since it specifically includes methods called from outside the class, it is also a measure of the potential communication between the class and other classes [13].
Pressman [10] States, since RFC increases, the effort required for testing also increases because the test sequence grows. If RFC increases, the overall design complexity of the class increases and becomes hard to understand. On the other hand lower values indicate greater polymorphism. Some cases the higher value can be 100- it depends on project to project.
It is the union of all methods in the class and all methods called by methods in the class. It is only counted on one level of call.
RFC = |RS| This metric is calculated for each class.
If a large number of methods can be invoked in response to a message, the testing and debugging of the class becomes more complicated since it requires a greater level of understanding required on the part of the tester. The larger the number of methods that can be invoked from a class, the greater the complexity of the class. A worst case value for possible responses will assist inappropriate allocation of testing time.
2.3. Coupling between objects (CBO)
In object oriented software, we can define coupling as the use of methods or attributes in another class. Two classes will be
considered coupled when methods declared in one class use methods or instance variables defined by the other class.Coupling is symmetric. If class A is coupled to class B, then B is coupled to A. The coupling betweenobject classes (CBO) metric will be the count of the number of other classes to which it is coupled. This metric is calculated for each class. [9] The idea of this metrics is that an object is coupled to another object if two object act upon each other. A class is coupled with another if the methods of one class use then methods or attributes of the other class.CBO counts the number of classes to which a
particular class is coupled
.
2.4.Lack of Cohesion in Methods (LCOM)
A module (or class) is cohesive if everything is closely related. The lack of cohesion in methods metric tries to measure the lack
of cohesiveness.This metric uses the notion of degree of
similarity of methods. LCOM measures the amount of cohesiveness present, how well a system has been designed and how complex a class is [15]. LCOM is a count of the number of method pairs whose similarity is zero, minus the count of method pairs whose similarity is not zero.
Raymond discussed for example, a class C with 3 methods M1, M2, and M3. Let I1={a, b, c, d, e}, I2= {a, b, e}, and I3= {x, y, z}, where I1 is the set of instance variables used by method M1. So two disjoint set can be found: I1 intersection I2 (= {a, b, e}). I2intersection I3 is null and I3 intersection I1 is also null. Here, one pair of methods who share at least one instance variable (I1 and I2). So LCOM = 2-1 =1.
2.5.Depth of Inheritance Tree (DIT)
The depth of a class within the inheritance hierarchy is the maximum number of steps from the class node to the root of the tree and is measured by the number of ancestor classes. In cases involving multiple inheritances, the DIT will be the maximum length from the node to the root of the tree[14]. Inheritance can add to complexity of software. This metric is calculated for each class. [9]
If DIT increases, it means that more methods are to be expected to be inherited, which makes it more difficult to calculate a class’s behavior. Thus it can be hard to understand a system with many inheritance layers. Deeper trees constitute greater design complexity, since more methods and classes are involved. On the other hand, a large DIT valueindicates that many methods might
be reused
.
2.6. Number of Children (NOC)
www.ijsrp.org
Greater the number of children, greater the reuse, since
inheritance is a form of reuse.
Greater the number of children, the greater the
likelihood of improper abstraction of the parent class. If a class has a large number of children, it may be a case of misuse of sub-classing.
The number of children gives an idea of the potential
influence a class has on the design. If a class has a large number of children, it may require more testing of the methods in that class. [13]
III. IMPACTOFOBJECTORIENTEDMETRICSON
OBJECTORIENTEDSOFTWARE
Table 1: Interpretation Guidelines
METRIC OBJECTIVE
Cyclometic Complexity Low
Lines of Code Low
Comment Percentage 20-30%
Weighted Method per Class Low
Response For a Class Low
Lack of Cohesion High
Coupling Between Objects Low
Depth of Inheritance Low(Tradeoff)
Number of Children Low(Trade off)
WMC-High value of WMC indicates the class is more complex
than that of low values. So class with less WMC is better.
CBO-High CBO is undesirable. An increase of CBO indicates
the reusability of a class will decrease. CBO values for each class should be kept as low as possible.
LCOM-LCOM measures how well a system has been designed
and how complex it is. Great values of LCOM increases complexity. So it should be kept as low as possible.
DIT-High values of DIT means more classes are inherited, which
makes it more difficult to calculate a class behavior. Which makes it more difficult to calculate a class’s behavior. On other hand,a large DIT value indicates that many methods might be reused.
NOC- High value of NOC means reuse increases. On the other
hand, as NOC increases, the amount of testing will also increase.
IV. ANALYSISOFRESULT
Metrics have a number of interesting characteristics for providing development support. Some of them are simple, precise, general and scalable to large size software systems. In this paper, we analyzed some metrics by using semi automated tool. In our analysis we use two java packages tomeasure object oriented metrics. Project1 contains 12 classes, and the total line of code (LOC) is 2223. Project2 contains 14 classes and LOC is 900. The main reason to choose those packages is both of the packages have around 2000 line of code and it is faster to execute. In this
paper, we focused mainly WMC, RFC, DIT, NOC and CBO, LCOM metrics.
Descriptive Statistics
[image:3.612.356.576.499.690.2]Within each case study, the distribution (mean, median) and variance (standard deviation) of each measure is examined. Low variance measures do not differentiate classes very well and therefore are not likely to be useful. Analyzing and presenting the distribution of measures is important for the comparison of different case studies.
Table 2: Descriptive Statistics Report of Project1
Descriptive statistics
Metrics N Min Max Mean Std. Dev
LCOM 12 50.00 50.00 50.0000 .00000
DIT 13 2.00 2.00 2.0000 .00000
CBO 12 3.00 12.00 6.2500 3.49350
NOC 12 .00 .00 .0000 .00000
RFC 12 14.00 14.00 14.0000 .00000
WMC 13 2.00 2.00 2.0000 .00000
Valid N
(listwise) 12
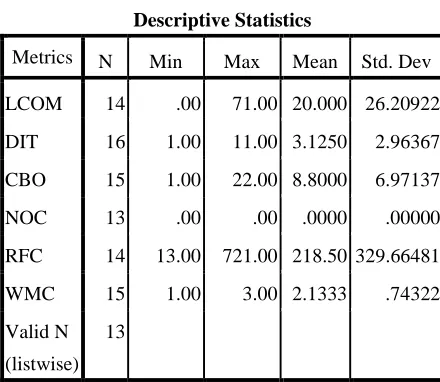
A statistics report is generated using a tool. Minimum, maximum, mean, std. deviation values are generated for all classes for value of each metrics(LCOM, DIT, CBO, NOC,RFC, WMC) as shown in table 2 and 3.
Table 3: Descriptive Statistics Report of Project2
Descriptive Statistics
Metrics N Min Max Mean Std. Dev
LCOM 14 .00 71.00 20.000 26.20922
DIT 16 1.00 11.00 3.1250 2.96367
CBO 15 1.00 22.00 8.8000 6.97137
NOC 13 .00 .00 .0000 .00000
RFC 14 13.00 721.00 218.50 329.66481
WMC 15 1.00 3.00 2.1333 .74322
Valid N
www.ijsrp.org
Following are the observations made from applying these metrics on projects.
There are only 12.5% of the total classes that have high
coupling metric values. There are 4.1% of classes with deep hierarchy. Since earlier empirical studies suggest that classes with more coupling and deep hierarchy are fault prone, the identified classes (16.6 %) must be thoroughly checked during testing.
The maximum value of RFC is high for all the projects
as it also counts the method invocations. RFC measures the complexity of the software by counting the number of methods in the class and also captures the information about the coupling of the class to other classes.
The values for WMC are same as method complexities
are generally considered to be unity. Values of WMC are not too much high for both projects. It means projects are not too much complex.
CBO value is generally less in sample data, hence
classes are easy to understand, reuse and maintain.
LCOM value is 50 for project1 and 71 for project2.
Because the number of pairs of methods having access to common attributes is less than the number of pairs of methods having no common attributes. It implies that the classes are less cohesive.
The DIT values are medium in all the projects; this
shows that inheritance is used in most of the classes to optimum level. Depth inheritance tree values are not too much high for both projects. So it conclude that both projects are not too much complex .But it limits the concepts of reusability.
NOC metric measures the number of direct subclass of a
class. Since more children in a class have more responsibility, thus it is harder to modify the class and requires more testing. So NOC with less value is better and more NOC may indicate a misuse of sub classing. In our analysis, both project1 and projecct2 have 0 and 0 NOC respectively. So it means there is no direct subclass for any parent class or super class in both project1 and project2.
V. CONCLUSIONANDFUTUREWORK
Theoretical analysis of these metrics suggest that out of many OO metrics, 6 metrics (WMC, DIT, CBO RFC, DAC, LCOM, and NOC) provide sufficient information for usage and other metrics are either subset of these metrics or are providing same information in different format. This simplysupports the conclusions drawn from theoretical analysis i.e. many of the metrics proposed are based on comparable ideas and therefore provide somewhat redundant information.
The measures could not be evaluated over a large data set but this is a problem that has plagued much of empirical software engineering research. We plan to replicate our study on large data set and industrial object-oriented software system.The most obvious extension of this work is to analyze the degree to which these metrics correlate with managerial performance indicators such as testing, maintenance effort and quality. Another future prospect would be to have the data set as project withidentical requirements done in different object oriented languages.
REFERENCES
[1]: Mei-Huei Tang, Ming-Hung Kao And Mei-Hwa Chen.Computer Science DepartmentSUNY at Albany.Albany, NY 12222, “An Empirical Study On Object-Oriented Metrics”.
[2]: Abreu, Fernando B., Carapuca, Rogerio: “Candidate Metrics for Object Oriented Software within a Taxonomy Framework.”, Journal of System software 26, 1(July 1994).
[3]: Chidamber, Shyam, Kemerer, Chris F. “A Metric suite for Object oriented Design.” M.I.T. Sloan School of Management E53-315, 1993.
[4]: Li, Wei, Henry, Salley: “Maintenance Metrics for the Object Oriented Paradigm”, First International Software Metrics Symposium. Baltimore, Maryland, May 21-22. 1993. Loss Alamitos, California: IEEE Computer Society press, 1993.
[5]: Abreu, Fernando B: “The MOOD Metrics Set”, proc. ECOOP’ 95 Workshop on Metrics, 1995.
[6]: Lorenz, Mark and Kidd, Jeff, Object Oriented Software metrics, Prentice Hall Publishing, 1994.
[7]:Aman Kumar Sharma, Arvind Kalia, Hardeep Singh. “Empirical Analysis of Object Oriented Quality Suites.” International Journal of Engineering and Advanced Technology (IJEAT) ISSN: 2249 – 8958, Volume-1, Issue-4, April 2012.
[8]:Amjan Shaik, C. R. K. Reddy, Bala Manda, Prakashini. C, Deepthi. K, “Metricsfor Object Oriented Design Software Systems: A Survey”, Journal of Emerging Trends in Engineering and Applied Sciences (JETEAS) 1 (2): 190-198,Scholarlink
Research Institute Journals, 2010 (ISSN: 2141-7016)
jeteas.scholarlinkresearch.org.
[9] David A. Gustafson, “Software Engineering”,Schaum’s Outline Series Mcgraw-HILL
Copyright © 2002 by The McGraw-Hill Companies,Inc.
www.ijsrp.org
[11]: [LI98] Li W., “Another metric Suite for Object Oriented Programming”, The Journal of System and Software, Vol. 44, Issue 2, December 1998.
[12]: S.R.Chidamber and Kemerer, “A Metrics Suite for Object Oriented Design”, IEEE Transactions on Software Engineering, Vol.20, No 1, Jan, 1994.
[13]:Seyyed Mohsen Jamali , “Object Oriented Metrics(A Survey Approach)”
[14]:K.K.Aggarwal, Yogesh Singh, Arvinder Kaur, Ruchika Malhotra , “Empirical Study of Object-Oriented Metrics”, Vol. 5, No. 8, November-December 2006