Psychology Dissertations Department of Psychology
8-12-2016
Intergenerational Transmission of Violence:
Parent-Child Profiles and Dating Violence in Latino
Adolescents
Rebecca Rodriguez
Follow this and additional works at:https://scholarworks.gsu.edu/psych_diss
This Thesis is brought to you for free and open access by the Department of Psychology at ScholarWorks @ Georgia State University. It has been accepted for inclusion in Psychology Dissertations by an authorized administrator of ScholarWorks @ Georgia State University. For more information, please [email protected].
Recommended Citation
Rodriguez, Rebecca, "Intergenerational Transmission of Violence: Parent-Child Profiles and Dating Violence in Latino Adolescents." Thesis, Georgia State University, 2016.
PROFILES AND DATING VIOLENCE IN LATINO ADOLESCENTS
by
REBECCA RODRIGUEZ
Under the Direction of Kevin Swartout, PhD and Julia Perilla, PhD
ABSTRACT
Intimate partner violence (IPV) is a critical public health problem that has a broad range of negative consequences on not only the individuals in the relationship but also on their
violence in their own relationships, not all do. This dissertation moves research on ITV beyond a deficit focus by using a resilience framework to investigate parenting relationships as protective factors for dating violence. A subsample of data Latino adolescents and their mothers’ were analyzed from a larger Welfare, Children, and Families (WCF) study. This study extends previous cross-sectional research by using longitudinal data to assess risk and protective factors when youth were 10-14 years old and its relationship to their own use of violence seven years later. Latent class analysis was conducted to understand the contextual and cultural factors related to the development of adolescent dating violence: acculturation, gender, and positive parent-child relationships were examined as influencing ITV. Three classes emerged that indicate unique combinations of risk and resilience. Two of these classes predicted differential associations with adolescent dating violence. A class indicating moderate-risk/low-protection and mothers with high acculturation was significantly related to increased odds of adolescents experiencing dating violence, both as victims and as perpetrators. A class indicating
low-risk/high-protection and mothers with low acculturation significantly predicted increased odds of perpetrating dating violence but no significant relationship was found with victimization.
Findings suggest that holistic family based approach to dating violence and adult domestic violence may be most effective for Latino adolescents and their IPV exposed mothers.
AND DATING VIOLENCE IN LATINO ADOLESCENTS
by
REBECCA RODRIGUEZ
A Dissertation Submitted in Partial Fulfillment of the Requirements for the Degree of Doctor of Philosophy
in the College of Arts and Sciences Georgia State University
Copyright by Rebecca Rodriguez
AND DATING VIOLENCE IN LATINO ADOLESCENTS
by
REBECCA RODRIGUEZ
Committee Chair: Kevin Swartout Julia Perilla
Committee: Gabriel Kuperminc Christopher Henrich
Electronic Version Approved:
DEDICATION
ACKNOWLEDGEMENTS
Many thanks are in order to multiple people who have influenced my love for psychology and supported my long journey to the PhD. First, I would like to thank my partner, Sam, for supporting our family while helping me push through the toughest parts of this journey. Many thanks to my mother who provided me with the experiences that would shape my understanding of strengths within Latino families.
Thank you to my hermanas in the VRA lab, including Lillie Macias, Josie Serrata, Alvina Rosales, and Carrie Lippy for entertaining my countless requests to “talk through” ideas and for providing a home away from home in those tough first years. Many thanks are in order to my mentor, Julia Perilla, for your unwavering belief in my abilities as a scholar. It is through your mentorship that I learned the importance of identifying strengths and forming partnerships with the communities that we study.
Thank you to my committee, including Gabriel Kuperminc and Chris Henrich, for saying yes to serving on my many committees throughout my graduate career and providing excellent feedback on my studies, including on this dissertation. My sincere and deepest gratitude to my dissertation chair, Kevin Swartout, whose guidance, support, and countless reviews, helped me to complete this dissertation project.
TABLE OF CONTENTS
ACKNOWLEDGEMENTS ... v
LIST OF TABLES ... ix
LIST OF FIGURES ... x
1 INTRODUCTION... 1
Adolescent Dating Violence ... 2
ITV and Resilience ... 9
Parental Domestic Violence ... 10
Parent-child Relationship Quality ... 11
Parental Monitoring ... 12
Theoretical Orientation ... 15
1.6.1 Social theories. ... 17
1.6.2 Resilience. ... 19
1.6.3 Intersectionality. ... 21
Current Study... 23
1.7.1 Approach ... 25
2 METHODS ... 26
Data ... 26
Initial Inclusion Criteria and Recruitment... 27
Subsample Selection for Current Study ... 28
Participants ... 28
Measures ... 30
2.6.1 Demographics... 31
2.6.2 Maternal IPV... 31
2.6.3 Parent-child relationship quality. ... 32
2.6.4 Maternal monitoring. ... 33
2.6.5 Maternal linguistic acculturation. ... 34
2.6.6 Adolescent dating violence... 34
Data Analysis ... 36
3 RESULTS ... 39
Preliminary Data Analyses... 39
Latent class analyses. ... 41
3.2.2 Class Descriptions. ... 47
Distal Outcome Analyses ... 48
4 DISCUSSION ... 51
Latent Class Analysis ... 51
Distal Outcome Analysis of Parent Classes ... 53
Limitations and Future Directions ... 55
Implications for Policy ... 60
Conclusion ... 61
REFERENCES ... 62
APPENDICES ... 89
Appendix A ... 89
LIST OF TABLES
Table 1 Physical Dating Violence Prevalence by Gender ... 5
Table 2 Dating Violence Prevalence by Race/Ethnicity ... 8
Table 3 Youth Demographic Characteristics ... 29
Table 4Mother’s Demographic Characteristics ... 30
Table 5 Psychometric Properties of Major Study Variables ... 40
Table 6 Comparison of Model Fit Indices for Class Solutions ... 41
Table 7 Means and Proportions for 2-Class Model ... 42
Table 8 Means and Proportions for 3-Class Model ... 44
Table 9 Means and Proportions for 4-Class Model ... 46
Table 10 Dating Violence Means for Each Class ... 49
Table 11 Pairwise Comparisons Equality Test of Means ... 49
Table 12 Logistic Regression Analysis... 50
LIST OF FIGURES
Figure 1: Ecological framework: Examples of risk factors for IPV (Dahlberg & Krug, 2002). .. 16
Figure 2: Gender-centered social-ecological model (as cited in White, 2009). ... 17
Figure 3: Standardized Means for 2-class Model... 43
Figure 4: Standardized Means for 3-class Model... 45
Figure 5: Standardized Means for 4-Class Model ... 47
1 INTRODUCTION
ITV for cultural groups such as Latinos. One such approach to strength-based research requires a resilience-based, intersectional examination of ITV protective factors (Martinez-Torteya, Bogat, VonEye, & Levendosky, 2009; Zimmerman, Stoddard, Eisman, Caldwell, Aiyer, & Miller, 2013). This dissertation moves research on ITV beyond a deficit focus by using a resilience framework to investigate protective factors for dating violence. Further, it adds an intersectional lens to aid in understanding resilience to ITV in a cultural specific community. Intersectionality suggests that one’s social identities intersect to create unique experiences that cannot be
explained by simply one social identity (Crenshaw, 1989). It is critical for explaining disparate outcomes in dating violence among adolescents.
Adolescent Dating Violence
researchers examining only one form of violence (Perilla, Lippy, Rosales, & Serrata, 2011). For this reason it is important to investigate dating violence as a whole.
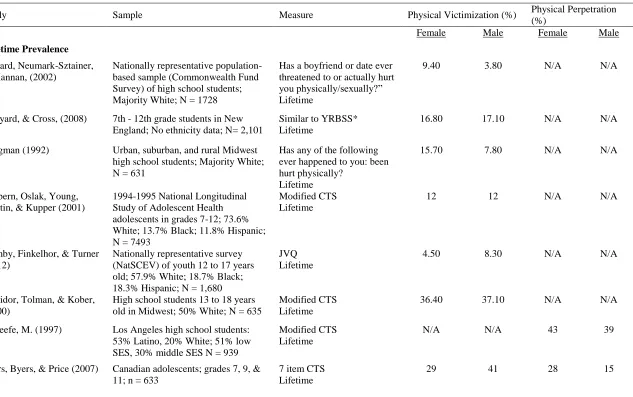
Studies on dating violence typically report both male and female rates of perpetration and victimization. This may be in part because perpetration and victimization of dating violence are highly correlated for adolescent dating violence (Gray & Foshee, 1997; Linder & Collins, 2005, O’Keefe, 1997). Nonetheless, prevalence studies highlight dating violence as a social problem that affects a substantial portion of teens. For instance, a review of multiple studies found that 9% to 23% of high school teens have reported experiencing physical dating violence and 2% to 19% reported experiencing sexual dating violence (Hickman, Jaycox & Aronoff, 2004).
National surveys data of high school students have reported 12-month incidence rates of physical dating violence in 9.9% (Rothman & Xuan, 2014) to 12% (Halpern, Oslak, Young, Martin, & Kupper, 2001) of respondents.
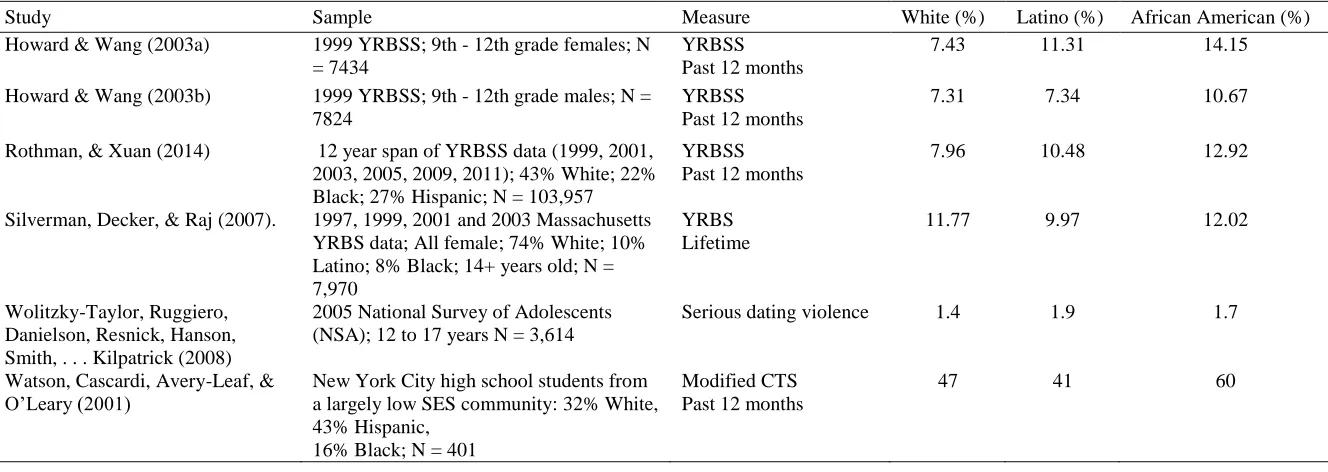
Although the studies cited above have found higher rates of dating violence among Latino adolescents when compared to White adolescents, studies focused on dating violence among Latino adolescents are severely underrepresented, with a wide range of rates. For example, a recent study of over 1,500 mostly heterosexual Latino adolescents found a very high rate (19.5%) of dating violence victimization experienced in the last year (Cuevas, Sabina, & Bell, 2014). A report analyzing the 2013 Youth Risk Behavior Surveillance System (YRBSS; Kann, Kinchen, Shanklin, Flint, Hawkins, Harris, et al., 2013) data found a lower rate of physical (10.4%) and sexual (11.5%) dating violence victimization than the rates reported by Cuevas and colleagues. Further, samples of Latino high school students report physical victimization rates from 7.6% to 9% in the last 12 months (Howard, Beck, Kerr, & Shattuck, 2005; Sanderson, Coker, Roberts, Tortolero, & Reininger, 2004). A study examining lifetime prevalence of dating violence perpetration found very high rate (34%) among Latino adolescents. A study of dating violence among 7,970 Latinos in MA produced rates of combined physical and sexual dating violence that were lower, at 10% (Silverman et al., 2007). In sum, rates of dating violence among adolescents vary by gender, race, and ethnicity. Prevalence rates for dating violence among Latino adolescents are mixed. Whether the true rate of dating violence is 10% or 34% for Latino adolescents, findings point to a substantial group of adolescents who experience
Table 1Physical Dating Violence by Gender
Study Sample Measure Physical Victimization (%) Physical Perpetration
(%)
Female Male Female Male
Lifetime Prevalence
Ackard, Neumark-Sztainer, & Hannan, (2002)
Nationally representative population-based sample (Commonwealth Fund Survey) of high school students; Majority White; N = 1728
Has a boyfriend or date ever threatened to or actually hurt you physically/sexually?” Lifetime
9.40 3.80 N/A N/A
Banyard, & Cross, (2008) 7th - 12th grade students in New England; No ethnicity data; N= 2,101
Similar to YRBSS* Lifetime
16.80 17.10 N/A N/A
Bergman (1992) Urban, suburban, and rural Midwest high school students; Majority White; N = 631
Has any of the following ever happened to you: been hurt physically?
Lifetime
15.70 7.80 N/A N/A
Halpern, Oslak, Young, Martin, & Kupper (2001)
1994-1995 National Longitudinal Study of Adolescent Health adolescents in grades 7-12; 73.6% White; 13.7% Black; 11.8% Hispanic; N = 7493
Modified CTS Lifetime
12 12 N/A N/A
Hamby, Finkelhor, & Turner (2012)
Nationally representative survey (NatSCEV) of youth 12 to 17 years old; 57.9% White; 18.7% Black; 18.3% Hispanic; N = 1,680
JVQ Lifetime
4.50 8.30 N/A N/A
Molidor, Tolman, & Kober, (2000)
High school students 13 to 18 years old in Midwest; 50% White; N = 635
Modified CTS Lifetime
36.40 37.10 N/A N/A
O'Keefe, M. (1997) Los Angeles high school students: 53% Latino, 20% White; 51% low SES, 30% middle SES N = 939
Modified CTS Lifetime
N/A N/A 43 39
Sears, Byers, & Price (2007) Canadian adolescents; grades 7, 9, & 11; n = 633
7 item CTS Lifetime
29 41 28 15
Avery-Leaf, Cascardi, O’Leary, & Cano, (1997)
High school students; 80% White; N = 193
Modified CTS** Past 12 months
38.4 41.4 52.9 21.4
Cuevas, Sabina, & Bell, (2014)
National sample (DAVILAS) of Latino adolescents; N = 1,525
JVQ*** & CTS Past 12 months
1.80 11.80 N/A N/A
DuPont-Reyes, Fry, Rickert, & Davidson, (2014)
Latino high school students in NYC. 43% Male; N = 677
CADRI **** Past 12 months
30 28 45 15
Eaton, Davis, Barrios, Brener,& Noonan, (2007)
2003 YRBS; Nationally representative sample of students ages 14 and older 61.5% White; N= 15,123
YRBSS Past 12 months
8.80 8.60 N/A N/A
Foshee, Linder, Bauman, Langwick, Arriaga, Heath, et al., (1996)
8th-9th grade students in rural North Carolina; N = 1405
Physical dating violence 36.50 39.40 N/A N/A
Foshee, Linder, MacDougall, & Bangdiwala. (2001)
8th and 9th graders in NC; 51.4% female; 77.3% white; N = 1,186
CTS perpetration N/A N/A 25.7 13.9
Grunbaum, Kann, Kinchen, Williams, Ross, Lowry, et al., (2002)
2001 YRBS; Nationally representative sample of high school students; N = 13,601
YRBSS Past 12 months
9.80 9.10 N/A N/A
Haynie, Farhat, Brooks-Russell, Wang, Barbieri, & Iannotti (2013)
Nationally representative sample of 10th grade students (NEXT Generation Health Study); 57% White; 20% Hispanic; 18% Black; N = 2,203
Modified CTS Past 12 months
9.8 11.7 11.4 6.3
Howard & Wang (2003ab) a. 1999 YRBSS; 9th - 12th grade females; N = 7434
b. 1999 YRBSS; 9th - 12th grade boys; N = 7824
YRBSS Past 12 months
9.23 9.13 N/A N/A
Jaycox (2004) Los Angeles 9th graders; 92% Latino; N = 318
Modified CTS Past 6 months
21 25 N/A N/A
Rothman, & Xuan (2014) 12 year span of YRBSS data (1999, 2001, 2003, 2005, 2009, 2011); 43% White; 22% Black; 27% Hispanic; N = 103,957
YRBSS Past 12 months
9.20 9.40 N/A N/A
Sanderson, Coker, Roberts, Tortolero, & Reininger (2004)
Latino high school students in Texas-Mexico border counties; N = 4,525
Similar to YRBSS Past 12 months
Schwartz, O’Leary, & Kendziora (1997)
Mostly White (90%) high school students N = 228
Modified CTS N/A N/A 44 16
Watson, Cascardi, Avery-Leaf, & O’Leary (2001)
New York City high school students from a largely low SES community: 32% White, 43% Hispanic,
16% Black; N = 401
Modified CTS Past 12 months
57 38 N/A N/A
Wolfe, Scott, Wekerle, & Pittman (2001)
High school students in Ontario; 79% White; N = 1,419
CADRI Past 12 months
19 28 28 11
Yan, Howard, Beck, Shattuck, & Hallmark-Kerr (2010)
Youth ages 11 to 13 residing in suburban Washington, D.C. All Latino; N = 322
YRBSS Past 12 months
14.40 12.90 N/A N/A
* Youth Risk Behavior Surveillance System (YRBSS) Single item asks “During the past 12 months, did your boyfriend or girlfriend ever hit, slap, or physically hurt you on purpose?”
** Conflict Tactics Scales (CTS).
***Juvenile Victimization Questionnaire (JVQ)
Table 2 Dating Violence by Race/Ethnicity
Study Sample Measure White (%) Latino (%) African American (%)
Howard & Wang (2003a) 1999 YRBSS; 9th - 12th grade females; N = 7434
YRBSS Past 12 months
7.43 11.31 14.15
Howard & Wang (2003b) 1999 YRBSS; 9th - 12th grade males; N = 7824
YRBSS Past 12 months
7.31 7.34 10.67
Rothman, & Xuan (2014) 12 year span of YRBSS data (1999, 2001, 2003, 2005, 2009, 2011); 43% White; 22% Black; 27% Hispanic; N = 103,957
YRBSS Past 12 months
7.96 10.48 12.92
Silverman, Decker, & Raj (2007). 1997, 1999, 2001 and 2003 Massachusetts YRBS data; All female; 74% White; 10% Latino; 8% Black; 14+ years old; N = 7,970
YRBS Lifetime
11.77 9.97 12.02
Wolitzky-Taylor, Ruggiero, Danielson, Resnick, Hanson, Smith, . . . Kilpatrick (2008)
2005 National Survey of Adolescents (NSA); 12 to 17 years N = 3,614
Serious dating violence 1.4 1.9 1.7
Watson, Cascardi, Avery-Leaf, & O’Leary (2001)
New York City high school students from a largely low SES community: 32% White, 43% Hispanic,
16% Black; N = 401
Modified CTS Past 12 months
ITV and Resilience
While much research has examined the intergenerational transmission of violence (ITV), inconsistencies remain in research linking witnessing parental domestic violence to adolescent dating violence. Some research has not found support for the ITV (Capaldi & Clark, 1998; Hotaling & Sugarman, 1990; MacEwen & Barling, 1988; Simons, Lin, & Gordon, 1998),
suggesting that most exposed children do not go on to experience or perpetrate adolescent dating violence. This suggests there may be subgroups of adolescents who are more or less susceptible to ITV. By only focusing on risk factors in parent-child relationships, research has ignored important social contexts that may help to explain different outcomes among subgroups of the population.
for research that investigates the relationship between parent-child relationships and dating violence in the context of parental IPV.
Parental Domestic Violence
Parent-child Relationship Quality
Family can be a source of strength, providing caring relationships, even when there is violence between adults in the family (Howell, 2011; Ingram, 2007, Martinez-Torteya, et al., 2009). However, research has not directly investigated how positive parent-child relationships may protect against ITV. Findings from research examining direct effects of positive parent-child relationships on dating violence suggest these relationship serve a protective function. For example, higher levels of parental warmth were found to lower the risk of dating violence perpetration among adolescent males (Cleveland, Herrera, & Stuewig, 2003; Simons, Lin, & Gordon, 1998). Maternal warmth is negatively related to dating violence, suggesting a protective function (Furman, Simon, Shaffer, & Bouchey, 2002; Seiffge-Krenke, 2003; Seiffge-Krenke, Shulman & Klessinger, 2001). Studies examining the relationship between positive maternal relationships and dating violence victimization are sparse and provide mixed results. A
longitudinal study found positive parental-child relationships were related to less dating violence victimization for both males and females (Magdol, Moffitt, Caspi, & Silva, 1998). A recent study with Latino adolescents found that parental caring and communication was related to less physical dating violence victimization for both males and females (Kast, Eisenberg, & Sieving, 2016). On the other hand, a longitudinal study with an all-female high school sample found no relationship between positive parental support and dating violence victimization (Richards, Branch, & Ray, 2014).
generally finds that harsh discipline is associated with dating violence perpetration among boys (Lavoie et al., 2002; Simons, Lin, & Gordon, 1998). Examining the relationship between harsh discipline and dating violence victimization has produced mixed results. Cross-sectional research suggests a positive relationship between harsh parenting practices and dating violence
victimization (Chiodo, Crooks, Wolfe, McIsaac, Hughes, & Jaffe, 2012; Gover, Jennings, Tomsich, Park, & Rennison, 2011; Windle & Mrug, 2009); however, a longitudinal study suggests this relationship only for dating violence perpetration, not for victimization (Morris et al., 2015). A related factor in the parent-child relationship, parental monitoring, has received more attention as a protective factor against dating violence.
Parental Monitoring
Parental monitoring is described as parental awareness of children’s activities and whereabouts (Dishion & McMahon, 1998), and negatively predicts adolescent problem
behaviors. Parental monitoring may serve to protect youth from dating violence by limiting the opportunity to engage in violent relationships (Howard, Qiu, & Boekeloo, 2003). Parental
monitoring was related to lower physical violence in a sample of Latino adolescents (Kerr, Beck, Shatuck, Kattar, & Uriburu, 2003). Similarly, low parental monitoring was related to an
increased risk for perpetrating dating violence among low-income adolescent boys (LaVoie et al., 2002). Among a sample of Latino middle school students, higher levels of parental
For Latino families, complex associations emerge when examining parental monitoring along with important social characteristics, such as mothers acculturation and adolescent gender. In general, Latino parents have been found to be stricter in their monitoring of their children than White parents (Bulcroft, Carmody, & Bulcroft, 1996; Mogro-Wilson, 2008; Pong, Hao, Gardner, 2005; Varela, Vernberg, Sanchez-Sosa, Riveros, Mitchell, & Mashunkashey, 2004). Monitoring and rules often vary by child gender, with more controls set for girls than boys (Bacallao & Smokowski, 2007; Mogro-Wilson, 2008). In one study, parents and adolescents agreed that stricter rules are in place for daughters than sons, especially when it comes to limiting freedom and dating (Bacallao & Smokowski, 2007). Interestingly, the authors also found that parents suggested increased rules for their daughters as a means to counter “Americanization” – the belief that they were adopting the host culture and losing their Latino culture. This provides some evidence that acculturation may play a role in parental behaviors. Further, Latinas were more likely than their male siblings to be dissuaded from going on social outings with friends and were encouraged to stay home and commit to domestic chores and caretaking of their siblings. The consequences of differential parenting by gender are unclear, but including gender and parental monitoring in dating violence research would provide the ability to understand how parental IPV affects males and females differently (Champion, Foley, Sigmon-Smith, Sutfin, & DuRant, 2008).
& Qin 2006; Varela et al., 2004). Parental monitoring and expectations around dating behaviors are influenced by traditional gender role expectations, with less acculturated parents having more traditional general expectations (Haglund, Belknap, & Garcia, 2012). Thus the more traditional cultural beliefs that parents held, the more restricted daughters were in dating (Phinney & Flores, 2002). However, it is interesting to note that while young Latinas may have specific rules against dating, most seem to be dating regardless (Haglund et al., 2012). It may be that girls who are prohibited from dating and are dating without their parents’ approval may have less knowledge about unhealthy relationships and less support from parents if they would occur. In this case, increased parental monitoring would limit dating experiences for these girls.
Theoretical Orientation
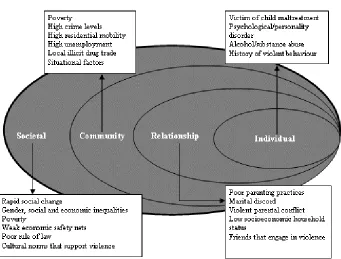
The bio-ecological model (Bronfenbrenner, 1986) emphasizes the need to move beyond the individual level to examine broader contexts in the etiology of dating violence. The World Health Organization (WHO) and the Center for Disease Control and Prevention (CDC) have adapted Bronfrenbenner’s ecological model and developed a framework to understand how risk and protective factors influence violence against women (Figure 1; Dahlberg & Krug, 2002). This model explicates how risks may manifest at different levels to influence an adult woman’s experience of IPV. These levels include the individual, relational, community, and societal levels. At each level there are multiple risk factors that influence violence against women. This model is directly applicable to both domestic violence and dating violence. As mentioned previously, this study is focused on the relational level, as that is where the many
intergenerational processes occur. In fact the WHO model explicates several of these
populations. Further, it allows culture to be a central influencing factor, as violence can impact multiply marginalized groups differently.
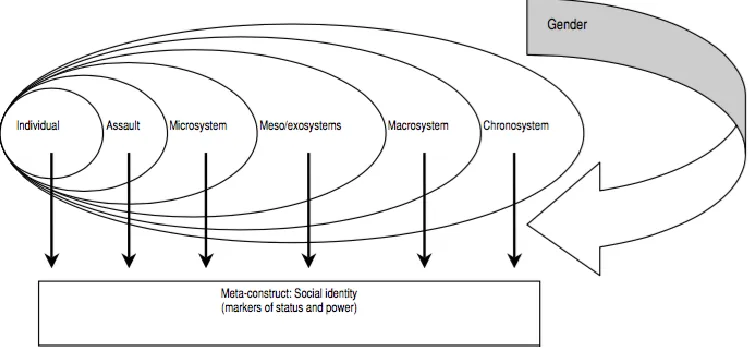
Combined, these models provide a more holistic examination of dating violence within Latino adolescents. The WHO model explicates risks at the relational level, whereas White’s model highlights gender other social identities that are core influencers of adolescent dating violence for Latinos. While both models in conjunction are excellent organizing frameworks, the theory behind how the models work can be explained by various facets of social learning and intersectionality theories.
Figure 1: Ecological framework: Examples of risk factors for IPV (Dahlberg & Krug,
[image:29.612.81.422.308.567.2]Figure 2:Gender-centered social-ecological model (as cited in White, 2009).
1.6.1 Social theories.
Various theories have been proposed on the mechanisms through which intergenerational transmission of violence occurs, from social learning theories of modeling behavior (Bandura, 1973) and personality typologies (Holtzworth-Munroe, & Meehan, 2004) to contextual
intergenerational patterns of victimization. ITV has its origins in social learning theory and in attachment theory.
Social learning theory and attachment theory combined suggest that parental IPV and parent child relationships influence adolescent dating violence. Social learning theory posits that patterns of behavior learned in the family of origin are often reproduced in one’s new
relationships by way of social modeling (Bandura, 1973; O’Leary, 1988). Thus youth exposed to violence in their home may learn aggression as an appropriate and expedient response to conflict and may respond to conflict in other settings with violence (Foshee, Bauman, & Linder, 1999; Mihalic, & Elliott, 1997). Although witnessing parental IPV may have a direct impact on dating violence via modeling aggressive behavior, attachment theory suggests a more indirect effect of parental IPV on adolescent dating violence by way of disrupting parenting schemas
experienced IPV go on to have positive caring relationships with their children. And neither of these theories explains why the majority of adolescents with IPV-exposed caregivers go on to violence-free dating relationships.
1.6.2 Resilience.
Resilience theory helps to understand why the majority of adolescents do not continue in the intergenerational cycle of violence. Indeed, resilience has been described as “ordinary
magic”, a process which occurs more frequently than not (Masten, 2001). Masten (2014) defines resilience broadly as the “capacity of a dynamic system to adapt successfully to disturbances than threaten system function, viability, or development” (p. 10). For this study, focused on individual behavior, resilience is defined as an individual’s capacity for positive adjustment despite exposure to adversity. Thus, two criteria must be met for an individual to be considered resilient: (1) he or she must have experienced adversity or risk, and (2) have maintained positive adjustment under this adversity (Masten, 2001, 2007). One critique of resilience is that it is often ambiguously defined (Luthar, Cicchetti, & Becker, 2000); thus it is important for researchers to clearly conceptualize risk and positive adjustment in studies of resilience.
employment; Masten, 2001). The lack of maladjustment is often operationalized as the lack of the behavior statistically related to the risk under investigation (e.g., psychopathology). The use of the lack of maladjustment as an indication of positive adjustment has been debated in the field (Luthar, Cicchetti, & Becker, 2000); however, maladjustment and adjustment can often be operationalized as two sides of the same coin (Masten, 2012, Kuperminc, Wilkins, Roche, & Alvarez-Jimenez, 2009).
Research on resilience has sought to understand the processes that lead to individual resilience, often by investigating intermediating variables that protect or ameliorate the impact of a risk factor on development (Masten & Tellegan, 2012). These variables are described in the research literature as protective and promotive factors, depending on the way they interact with the risk factor and outcome (Luthar, Cicchetti, & Becker, 2000). Protective factors are defined as variables that have an interactive or buffering effect on the risk factor to lessen the effect of risk on the outcome (Masten & Tellegan, 2012). Promotive factors are defined as variables that have a direct positive effect on the outcome regardless of the level of risk (Narayan, Sapienza, Monn, Lingras, & Masten, 2015). Promotive and protective factors have been operationalized as both individual characteristics (e.g., intellect, temperament, creativity, and, positive coping skills) and external factors (e.g. supportive relationships, environmental resources, and neighborhood safety; Ungar, 2011). The investigation of relationships between specific factors that may buffer risk represents a variable-centered approach.
resilience. For example, persons with high risk (e.g., growing up with interparental violence) may have other more positive aspects of their lives and may not show their own symptoms of maladjustment. Combined, person-centered and variable-centered methods are powerful tools for researchers to understand how naturally-occurring subgroups of individuals may have unique combinations of risk and protective factors that lead to differential outcomes. This approach has important implications for informing interventions by identifying subgroups of adolescents who are more at risk and targeting them in tailored interventions. Person-centered approaches to resilience would capture individual heterogeneity in their constellation of risk and protective factors related to IPV. This is in line with an intersectional and cultural nuanced understanding of resilience. Critiques of resilience theory argue that resilience cannot occur without consideration of social location such as culture, ethnicity, and gender (Arrington, & Wilson, 2000; Kuperminc et al., 2009; Kirmayer, Dandeneau, Marshall, Phillips, & Williamson, 2011). Intersectionality complements resilience theory, and our understanding of dating violence, as it provides a more holistic understanding of resilience among marginalized communities, such as Latino
adolescents.
1.6.3 Intersectionality.
concurrently with multiple marginalized identities such as gender, ethnic minority status, and culture (Perilla, 1999; Sokoloff, 2008). Thus, intersectionality helps to explain how someone’s experience of dating and domestic violence is affected by their unique social location, given their multiple marginalized identities. For example, the contexts surrounding DV for a middle class, White, adolescent male are often quite different than those for a low-income, adolescent Latina. An analysis of dating violence without this contextual knowledge overlooks key social contexts that may help explain the subgroup differences that we see in the research literature.
A growing number of researchers utilize intersectionality theory when examining domestic violence in Latino families (Gonzales-Guarda, Florom-Smith, & Thomas, 2011; Szapocznik & Kurtines, 1993). It is at the heart of Latino specific investigations of DV (Serrata, Hernandez-Martinez, Rodriguez, Macias, & Perilla, 2015), and as Perilla (2014) writes,
“intersectionalities must be part of our understanding and response to domestic violence, rather than ‘controlling for’ or ignoring other important elements in the lives of families and
communities”. Considering intersectionality includes studying how gender, ethnicity, and culture combine to influence ITV. One approach to modeling intersectional variables involves an in-depth, within-group analysis to examine those who are multiply marginalized such as individuals who reflect certain gender and ethnicity combinations (McCall, 2005).
DiLillo, 2008). The importance of culture in investigations of violence is critical to understanding more proximal processes in the ecological model such as parenting (Chan, Hollingsworth, Espelage, & Mitchell, 2016).
In summary, ITV suggests dating violence may be influenced by maternal experiences of domestic violence and parenting behaviors. Ecological theory provides an organizing framework to focus on the relational level of factors influencing ITV, whereas resilience theory ensures that we take more strength-based perspective when examining ITV. Together, intersectionality and resilience theory guide the understanding of ITV among Latino families. Resilience theory suggests that not all children exposed to domestic violence will develop negative outcomes such as dating violence. Incorporating intersectionality into this dissertation provides the ability to understand, in tandem, the social and protective characteristics related to resilience outcomes in Latino adolescents.
Current Study
The current study is informed by empirical research on the antecedents for ITV in combination with the theoretical models of resilience and intersectionality. Specifically this study examines dating violence in adolescence as one outcome of ITV. Although Latino
adolescents experience high rates of dating violence, little research has investigated factors that may prevent dating violence in this culturally-specific group. Aligned with a resilience model, the current study sought to understand how family risk and protective factors in early
other risk and protective factors to predict adolescent violence differently are also examined. According to ITV theory, adolescents with high exposure to maternal IPV should have greater odds to perpetrate or become a victim of dating violence. However, when risk experiences are combined with protective factors, such as high in maternal monitoring or warmth, this risk may be mitigated, as would be suggested by a protective model of resilience. As noted in the literature review, parent-child relationship quality is an important promotive factor for adolescents and is one avenue in which resilience or risk occurs to influence ITV. Further, gender and culture may interact with parenting to influence one’s experience of resilience. Thus in this study I combine resilience and intersectional approaches to investigate how parenting variables, social identities, gender, and culture combine to understand ITV in Latino adolescents. Thus, the overall research question in this study is: Given the complex relationships of risk and protective factors along with differences in social characteristics of Latino adolescents, can subgroups of Latino
adolescents and their mothers be identified that indicate resilience or risk for ITV?
1.7.1 Approach
A mixed model using person-centered and variable-centered approaches was used to understand resilience in ITV for Latino adolescents. The heterogeneity of factors predicting dating violence suggests that a person-centered analysis can be useful in distinguishing between adolescents who experience dating violence from those who do not (Bogat, Levendosky, & von Eye, 2005;
Swartout & Swartout, 2012). A latent class analysis (LCA) was first used to determine if a sample of Latino adolescents could be categorized into homogenous subgroups based on their risk and protective factors and social characteristics. The LCA was conducted to uncover distinct classes comprised of several risk and protective factors including parent-child relationships, maternal monitoring, and maternal acculturation and adolescent gender. These observed
variables were expected to form at least two classes indicating risk or resilience. It was expected that a class with high quality parent-child relationships, high maternal monitoring, and low acculturation may emerge. This class would be considered protective in accordance with the protective nature of these variables as indicated in the literature review. However if two groups emerged both high on maternal IPV, it was expected that they would differ on other facets. Conducting a LCA, rather than traditional moderation approaches, allows for gender and
acculturation to combine with parenting characteristics which is consistent with intersectionality theory (Bauer, 2014; Garnett, Masyn, Austin, Miller, Williams, & Viswanath, 2014). In addition, the LCA may capture unique intersections of social identities and parenting characteristics.
different classes of risk and protective factors and social characteristics were expected to have unique associations with Latino adolescent experiences of victimization and perpetration of dating violence. The regression analyses aided in indicating which classes could be considered resilient dependent on the constellation of risk and protective factors within each class and the classes relationship to dating violence. Each class identified would indicate a unique group of experiences rather than assuming that all Latinos experience risk and resilience in the same manner. Similarly, each class that emerged was expected to be related to different experiences with dating violence victimization and perpetration.
2 METHODS
Data
offers data based on a stratified random sample of families with data collected over three time points. Data was downloaded through the Inter-university Consortium for Political and Social Research website. All data used in this study was obtained de-identified.
Initial Inclusion Criteria and Recruitment
The WCF data contains a stratified random sample of 2,402 low-income households in three metropolitan areas in the United States: Boston, MA; Chicago, IL; and San Antonio, TX. Multi-stage, stratified, area probability sampling was used to obtain a random sample of
households in each city. This procedure is detailed elsewhere (Angel, Curton, Chase-Lansdale, Cherline, & Moffitt, 2009). In sum, households were identified based on clusters of census block groups. Block groups were then chosen by the percentage of families with incomes below the federal poverty line. Within each selected block group, door-to-door screenings of households were conducted to select participants depending on several family characteristics including, racial/ethnic characteristics, income level, welfare receipt, and single or two parent households. Further, families were eligible to participate in the study if they had at least one child between the ages of 0-4 or 10-14 years old at the time of the interview. In the case that parents had multiple children in the target age range, only one child was randomly selected. This sampling procedure resulted in a large sample of low-income families and a high proportion of African American and Latino families. Over 40% of this sample received welfare assistance (Winston et al., 2009).
Assessment and Incentives
In each household, the primary caregiver and selected child completed a survey
Surveys were administered in-person using am automated computer assisted survey interview technique. Sensitive topics, including maternal IPV, dating violence, and parent-child
relationships, were administered via audio computer assisted self-interview. The questionnaire was provided in English or Spanish by respondent’s preference. Please see Appendix A and B for full questionnaires. Participants were randomly selected to receive either $30 or $70 incentive for participating in the study.
Subsample Selection for Current Study
Households were assessed at three time points over 7 years. The first wave of data was collected in 1999, followed by the second wave in 2001, and the third wave was completed in 2006. For these analyses, variables were selected for use from all three time points. Thus three waves of data were merged using SPSS v.18 in order to create one large dataset. After data were merged, a subpopulation of the original sample was selected for analysis. As this study was focused on dating violence among Latino adolescents, only data from youth who reported Latino or Hispanic origin were selected (n = 1158). In addition, because of the study focus on mother’s acculturation, data were selected to include only adolescents with Latino mothers (n = 1137). Lastly, only adolescents who indicated ever having a romantic relationship were included (n
=350). Further, 20 adolescents were lost to attrition in wave 2 of the study, which resulted in a sample of 330 Latino adolescents and their mothers available for the present analyses.
Participants
caregivers are referred to as mothers in this study. Youth participants included 330 Latino
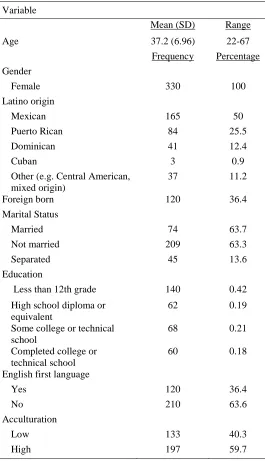
[image:42.612.73.328.265.535.2]adolescents (46% male), ages 15-21 years old. Youth were majority Mexican origin, followed by Puerto Rican, and Dominican origins. A small percentage of adolescents were foreign born (13.3%). Mothers were of various Latino origins; the majority were Mexican (n = 172), followed by Puerto Rican (n = 97), Dominican (n = 46), and other mixed Latino origins. See tables 3 and 4 for additional demographic information.
Table 3 Youth Demographic Characteristics
Demographic
Mean (SD) Range Age
Wave 1 12.01 (1.46) 9-15
Wave 2 13.41 (1.51) 10-16
Wave 3 17.84 (1.5) 15-21
Frequency Percentage Gender
Male 153 46.4
Female 177 53.6
Latino origin
Mexican 159 49.8
Puerto Rican 79 24.8
Dominican 38 11.9
Cuban 3 0.9
Other (e.g. Central American, mixed origin)
40 12.5
Table 4 Mother’s Demographic Characteristics
Variable
Mean (SD) Range
Age 37.2 (6.96) 22-67
Frequency Percentage Gender
Female 330 100
Latino origin
Mexican 165 50
Puerto Rican 84 25.5
Dominican 41 12.4
Cuban 3 0.9
Other (e.g. Central American, mixed origin)
37 11.2
Foreign born 120 36.4
Marital Status
Married 74 63.7
Not married 209 63.3
Separated 45 13.6
Education
Less than 12th grade 140 0.42
High school diploma or equivalent
62 0.19
Some college or technical school
68 0.21
Completed college or technical school
60 0.18
English first language
Yes 120 36.4
No 210 63.6
Acculturation
Low 133 40.3
High 197 59.7
Measures
maternal IPV, dating violence, and parent-child relationships, were administered via audio computer assisted self-interview. Mothers’ measures were all self-reported and include maternal linguistic acculturation and maternal IPV. Adolescents’ measures were all self-reported and include gender, dating violence, parent-child relationship quality, and maternal monitoring.
2.6.1 Demographics.
Basic demographic information was collected as part of the initial interview. For adolescents, the following demographic information was assessed in wave 1 of the study: race, ethnicity, gender, age in years, and birthplace. For caregivers, demographics collected included race, ethnicity, gender, age in years, birthplace, marital status, highest level of education, and primary language. Additionally, information was collected about caregiver’s relationship to the focal child.
2.6.2 Maternal IPV.
of the CTS2 was found to have excellent reliability and construct validity among 1,266 Spanish speaking women (Calverte, Corral, & Estevez, 2007).
The CTS2 can be computed to provide two different scores, one indicating prevalence and the other chronicity (Straus, 2004). The chronicity score measures the frequency in which participants experienced violence. This score is limited in that it should only be computed for the small portion of the sample that experienced violence (Straus, 2004). On the other hand, a
prevalence score can be computed for all respondents and indicates whether or not any of the behaviors occurred in the last year. This allows researchers to examine responses for those who indicated not experiencing any violence. A prevalence score is selected for use in this study, as it is equally important to have a sample that consists of cases in which violence was not
experienced as well as cases in which violence was experienced. Thus a prevalence score was computed by first assigning participants a value of (1) if they had experienced the behavior in the last 12 months and (0) if they had not for each of the 9 items. Together these 9 items had strong reliability (Chronbach’s therefore an average score was computed if 6 out of 9 items were answered. Averaging the items allowed for cases to be retained if 3 or fewer items were missing values and is one of the procedures recommended by the author (Straus, 2004) to deal with missing data. Higher scores reflect higher numbers of IPV experiences in the past year.
2.6.3 Parent-child relationship quality.
warmth in their relationships with their mothers on a 5-point scale from 1 (“never true”) to 5 (“always true”). The IPPA includes two subscales: “warmth and communication” and “anger and alienation”. Example items from the warmth and communication subscale included, “I get a lot of attention from my caregiver” and “I trust my caregiver”. Examples items from the anger and alienation subscale included “I feel angry with my caregiver” and “My caregiver doesn’t understand what I’m going through these days”. In these items, caregiver was substituted for mother or grandmother, as appropriate. For the warmth and communication subscale items, mean scores were only calculated if four of the six items had valid responses. Higher scores
represented higher ratings of positive relationship quality. For the anger and alienation subscale items, means scores were calculated if four of the six items had valid responses. Higher scores represented higher ratings of negative relationship quality. Both the warmth and communication (Chronbach’s = .80) and the anger and alienation (Chronbach’ssubscales had good internal consistency.
2.6.4 Maternal monitoring.
Adolescents answered five items about their perceptions of monitoring by their mother at wave 2 of the study. Items included questions about their mother’s knowledge of their
recommended by the author (Steinberg, 1991). The scale had good internal consistency and reliability (Cronbach’s =.77)Higher scores reflect higher maternal monitoring.
2.6.5 Maternal linguistic acculturation.
Maternal linguistic acculturation was assessed by a measure of English language proficiency as a proxy measure for acculturation. First mothers were asked their primary language. Of those who answered that Spanish was their primary language, three additional questions determined how well mothers could read, write, and speak English with response options ranging from 1 (“not at all”) to 4 (“very well”). First all three questions were averaged so that higher mean scores reflect higher English language proficiency. Next, similar to previous research (Loukas, Suizzo, & Perlow, 2007), a dichotomous variable was created to indicate high and low acculturation groups. The low acculturation group consisted of mothers with mean scores under 3. Mothers with a mean score of 3 or more, indicating a high level of English proficiency, were assigned to the high acculturation group. Additionally, mothers who answered that English was their first language were also assigned to the high acculturation group.
Dichotomizing the variable rather than using the variable as continuous allowed me to include data from Latina women who indicated English as their first language. While this was a measure of only one facet of acculturation, linguistic acculturation is important in the context of IPV as research finds that language access is important for accessing resources for IPV among Latina women (Rizo & Macy, 2011).
2.6.6 Adolescent dating violence.
Yazedjian, 2014). In addition, its cross-cultural construct validity and reliability was found to hold across international samples of college students, including among several US-Mexico border states (Straus, 2004). Similar to the measure of mother’s IPV, the Revised Conflict Tactics Scale (CTS2; Straus et al., 1996) was used to measure adolescents’ dating violence victimization. However, it was different in two notable ways. First, the referent period was lifetime experience of dating violence, secondly the adolescents were not asked about the frequency in which each behavior occurred. In addition to assessing victimization, adolescent also answered a companion scale for perpetration. Adolescents answered 9 items measuring physical, psychological, and sexual dating violence experienced in a romantic relationship over their lifetime using yes (1) or no (0) responses. Similar items were asked to measure
Data Analysis
The primary analysis for this study consisted of a latent class analysis (LCA) using continuous and categorical indicators. LCA is a multivariate statistical model that uses a
probabilistic clustering approach to identify subgroups (classes) of individuals that are similar to each other across a number of different observed variables (indicators) and that are at the same time different from other classes (Vermunt & Magidson, 2002). The LCA technique assigns individuals to various classes based on the patterns of responses of the observed variables and the probability of being assigned to each class. LCA allows for qualitative differences to emerge between groups of individuals, such that individuals may have high scores on one variable and a low score on others.
LCA involves running multiple class models and examining each solution in comparison to other models. The final number of classes was selected based on goodness of fit indices, theoretical meaning, and model stability (Nylund, Asparouhov, & Muthén, 2006). Model fit statistics included examining the Akaike Information Criterion (AIC; Akaike, 1974) and the Bayesian Information Criteria (BIC; Schwartz, 1978) to determine the best fitting model. In general lower values indicate a better fitting model (Hagenaars, & McCutcheon, 2002). The entropy value indicates how well classes can be distinguished (Ramaswamy, DeSarbo, Reibstein, & Robinson, 1993). This value ranges from 0-1 with higher values indicating better fit. The Lo-Mendel-Rubin adjusted likelihood ratio test (aLMR; Lo, Mendell, & Rubin, 2001) was also examined. The aLMR tests for the best fitting model by comparing the number of selected latent classes (k) to k-1 classes. A significant p-value indicates that the model with k classes fits the data better when compared to the model with k-1 classes. The aLMR test is recommended over the standard likelihood ratio test (LRT) as the LRT is more likely to overestimate the number of classes (Nylund, Asparouhov, & Muthén, 2006).
associated with treating class membership as an observed rather than an estimated variable (Clark & Muthén, 2009). Treating class membership as an observed variable is problematic because a LCA assigns class membership based on estimated probabilities. In models with imperfect assignment (entropy < 1.00), each case is assigned a probability of belonging to each class with a certain margin of error. The single-step approach avoids this problem by estimating the LCA and the distal outcome in one step. However the single-step approach has the potential to shift the original latent classes (Clark & Muthén, 2009). The shift can become so flagrant that the original class solutions no longer have the same meaning. Thus alternative methods have been investigated to understand the impact on LCA solutions when adding a distal outcome variable and several approaches have been developed to remedy this issue, including: the pseudo class method (Wang, Brown, Bandeen-Roche, 2005), the classification-error corrected method (DE3STEP; Asparouhov & Muthen, 2014), Lanza’s distal as covariate method (DCON, Lanza, Tan, & Bray, 2013) and the measurement error weighted method (BCH; Bakk & Vermunt, 2014). A discussion of the technical aspects of each procedure is beyond the scope of this study; however, each procedure attempts to take into account the error in assigning posterior class probabilities. The DCON approach was selected because it did not change the classes and it does not assume equal variance across the classes (Asparouhov & Muthen, 2014). Thus DCON was used to calculate and class membership probabilities were extracted for the logistic regression analyses.
comparison tests were conducted first to understand if classes differed across outcomes. The DCON method allowed for an interpretation of mean differences without changing the class assignments and works best when entropy is high (>.60; Asparouhov & Muthen, 2014). A logistic regression was chosen because the focal outcome variable, dating violence, was dichotomous. One of the primary aims of the study was to test adolescent dating violence incidence, i.e. whether or not adolescents experienced dating violence victimization and perpetration dependent on their latent class assignments. To test this research aim, logistic regressions were conducted using the probabilities of class membership as the predictor variable and each dating violence outcome as the dependent variable. Estimated class probabilities rather than most likely class membership were used in the logistic regression because this approach leads to less biased regression coefficients (Clark & Muthen, 2009) Thus two logistic regressions are run for each latent class. The logistic regression provides odds ratios that can be used to predict the odds of experiencing dating violence victimization and perpetration based on latent class assignment.
3 RESULTS
Preliminary Data Analyses
All variables were visually inspected for potential outliers and erroneous values, and all values fell within the expected values for each scale. Data were checked for missingness at the item level, and only a small number of missing data were found (< 1%). LCA employs a full
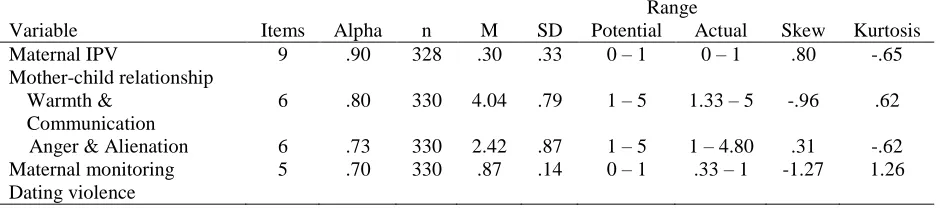
distributions of all continuous indicator variables. All continuous indicator variables had adequate normal distributions with skew and kurtosis falling within acceptable ranges (Table 5, Tabachnick & Fidell, 2007). Overall, 32% of adolescents in this sample endorsed experiencing dating violence and 29% endorsed perpetrating dating violence. The sample as a whole scored high in maternal warmth and communication (M = 4.04, SD = .79), low on anger and alienation (M = 2.42, SD = .87), and high on maternal monitoring (M = .87, SD = .14).
[image:53.612.74.516.346.555.2]Correlations between study variables were calculated to understand the size, direction, and significance of relations (See Table 4). Significant correlations provided evidence for using the parenting and intersectional variables in the subsequent LCA.
Table 4 Correlations of All Study Variables
Variable 1 2 3 4 5 6 7 8
1. Youth gender1 – .03 .05 02 .10 .09 .06 .27**
2. Maternal acculturation level1 – .23** -.09 .08 .04 -.03 .04
3. Maternal IPV – -.06 .04 -.00 .07 .11*
4. Warmth & communication – -.49** .50** -.18** -.13*
5. Anger & alienation – -.42** .06 .12*
6. Maternal monitoring – -.15** -.14*
7. DV perpetration – .52**
8. DV victimization –
[image:53.612.73.545.616.721.2]*p<.05, **p<.01 1 Spearman correlation
Table 5 Psychometric Properties of Major Study Variables
Range
Variable Items Alpha n M SD Potential Actual Skew Kurtosis Maternal IPV 9 .90 328 .30 .33 0 – 1 0 – 1 .80 -.65 Mother-child relationship
Warmth & Communication
6 .80 330 4.04 .79 1 – 5 1.33 – 5 -.96 .62
Victimization 8 .85 330 .11 .21 0 – 1 0 – 1 2.15 4.32 Perpetration 8 .78 330 .09 .16 0 – 1 0 – .75 1.90 2.61
Latent class analyses.
In order to determine the best fitting model, a one-class model was fit along with a series of mixture models, including two-, three-, and four- class models. In addition a five-class model was attempted but had difficulty replicating log-likelihood values, which is indicative of
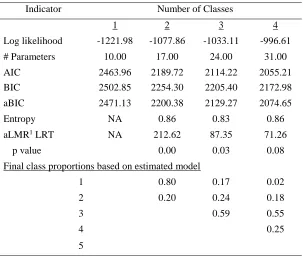
[image:54.612.74.377.382.638.2]decreased model stability (Geiser, 2012). The model fit statistics for each model are provided in Table 6 and were used to compare each class solution. Each class solution is summarized below followed by an interpretation of each of the classes. Overall sample means and class means are used to aid in interpretation of the classes.
Table 6 Comparison of Model Fit Indices for Class Solutions
Indicator Number of Classes
1 2 3 4
Log likelihood -1221.98 -1077.86 -1033.11 -996.61
# Parameters 10.00 17.00 24.00 31.00
AIC 2463.96 2189.72 2114.22 2055.21
BIC 2502.85 2254.30 2205.40 2172.98
aBIC 2471.13 2200.38 2129.27 2074.65
Entropy NA 0.86 0.83 0.86
aLMR1 LRT NA 212.62 87.35 71.26
p value 0.00 0.03 0.08
Final class proportions based on estimated model
1 0.80 0.17 0.02
2 0.20 0.24 0.18
3 0.59 0.55
4 0.25
5
1Lo-Mendell-Rubin adjusted test
3.2.1.1 Two-class solution.
The AIC, BIC, and adjusted BIC values are listed in Table 6 and were used to compare the model fit between the various class solutions. The aLMR test statistic was significantly different from zero, indicating that the two-class model provided a better solution than the one-class model. The posterior probabilities for one-class assignment among the two-one-class solution ranged from 0.92-0.97, indicating high agreement between probable and actual class assignment (Table 7). The entropy value, a statistic of how well the model differentiates the classes, was high (.86).
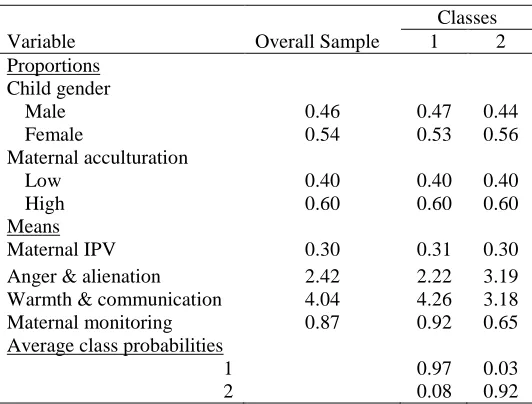
[image:55.612.74.340.509.711.2]Class 1 was the largest class and included 263 adolescents (80%). Class 2 included 66 adolescents (20%). Standardized means for each class are graphed in figure 4 and are provided to aid in interpretation. For the two-class solution, the differences were driven by the parent-child relationship variables (Table 7). Class one had lower anger and alienation, higher warmth and communication, and higher maternal monitoring than class two. The two classes were similar in terms of child gender and maternal acculturation level. There was no apparent difference in the mean score of maternal IPV between the two classes.
Table 7Means and Proportions for 2-Class Model
Classes
Variable Overall Sample 1 2
Proportions Child gender
Male 0.46 0.47 0.44
Female 0.54 0.53 0.56
Maternal acculturation
Low 0.40 0.40 0.40
High 0.60 0.60 0.60
Means
Maternal IPV 0.30 0.31 0.30
Anger & alienation 2.42 2.22 3.19 Warmth & communication 4.04 4.26 3.18 Maternal monitoring 0.87 0.92 0.65 Average class probabilities
1 0.97 0.03
Figure 3: Standardized Means for 2-class Model
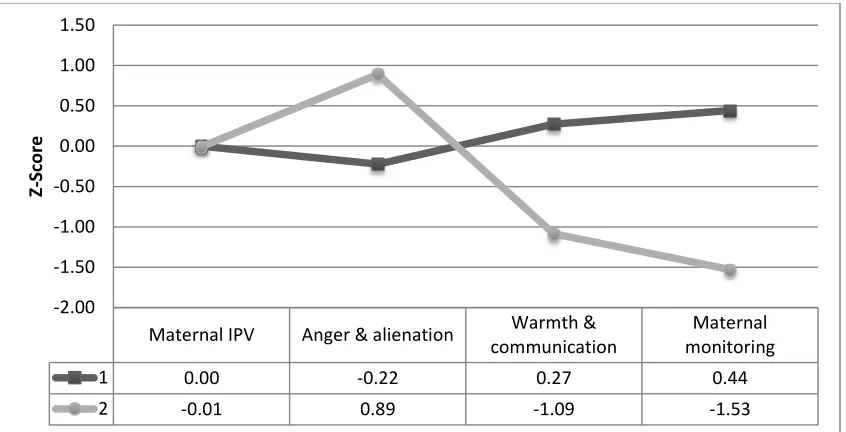
3.2.1.2 Three-class solution.
The BIC and the AIC for the three-class model were lower than those in the two-class model indicating that the three-class model was a better fit (see Table 6). Further, the aLMR was significant (p < .05), providing further support that the three-class model was a better fit to the data than the two-class solution. However, the posterior probabilities were slightly lower (ranged from 0.88-0.94) in the three-class solution compared to the two-class solution. The entropy value for the three-class model was slightly lower than the entropy value for the two-class model (.83 vs. .86) but it indicated good two-class separation.
Class 1 consisted of 56 adolescents (17% of the sample), class 2 included 78 adolescents (24%), and class 3 included 196 adolescents (59%). The classes for the three-class model were markedly different in terms of the degree of maternal IPV experienced (Table 8, Figure 5). Class 1 had a moderate mean score of maternal IPV, high anger and alienation (1 SD above the sample mean), low warmth and communication (1.5 SD below the mean), and low maternal monitoring
Maternal IPV Anger & alienation Warmth & communication
Maternal monitoring
1 0.00 -0.22 0.27 0.44
2 -0.01 0.89 -1.09 -1.53
-2.00 -1.50 -1.00 -0.50 0.00 0.50 1.00 1.50
Z-Sc
o
(over 1 SD below the mean). Class 1 has a high proportion of mothers in the high versus the low acculturation group. It also has a high proportion of female (60%) adolescents than male
adolescents. Class 2 had the highest mean score of maternal IPV (nearly 1.5 SD above the sample mean) but low anger and alienation, high warmth and communication, and high maternal monitoring. Class 2 has the highest proportion of mothers in the high acculturation group (86%) and had more female (57%) than male adolescents. Class 3 had the lowest mean score of
maternal IPV (.5 SD below the mean), low anger and alienation, high warmth and
[image:57.612.73.387.400.618.2]communication, and high maternal monitoring. Class 3 had slightly more mothers in the low acculturation group (52%) than the high acculturation group and about equal proportion of female (51%) and male adolescents
Table 8Means and Proportions for 3-Class Model
Classes
Variable Overall Sample 1 2 3
Proportions Child gender
Male 0.46 0.41 0.43 0.49
Female 0.54 0.60 0.57 0.51
Maternal acculturation
Low 0.40 0.36 0.14 0.52
High 0.60 0.64 0.86 0.48
Means
Maternal IPV 0.30 (.33) 0.27 0.77 0.13 Anger & alienation 2.42 (.87) 3.33 2.30 2.20 Warmth & communication 4.04 (.79) 2.83 4.13 4.35 Maternal monitoring 0.87 (.14) 0.69 0.90 0.90 Average class probabilities
1 0.88 0.04 0.08
2 0.02 0.92 0.06
Figure 4: Standardized Means for 3-class Model
3.2.1.3 Four-class solution.
The BIC and the AIC for the four-class model were lower than those in the three-class model indicating that the four-class model was a better fit to the data (see Table 6). However, the aLMR test statistic was not significantly different from zero (p = .08), indicating that the four-class model did not fit the data significantly better than the three-four-class model. The posterior probabilities for class assignment among the four-class model ranged from 0.88-0.97. The entropy value (.86) for the four-class model was slightly higher than the entropy value for the three-class model (.84).
The four-class solution was characterized by differences in the combination of mothers IPV and mother-child relationship quality. The smallest class (n = 7, 2%), class 1, was
characterized by high maternal DV and poor mother-child relationship quality (as indicated by low warmth and communication and high anger and alienation). Class 1 also had the lowest maternal monitoring of all four classes. In examining their social characteristics, class 1 also had the highest proportion of mothers with low acculturation and all female adolescents. Class 2 (n =
Maternal IPV Anger & alienation
Warmth & communication
Maternal monitoring
1 -0.10 1.05 -1.52 -1.28
2 1.40 -0.13 0.11 0.32
3 -0.53 -0.25 0.39 0.32
-2.00 -1.50 -1.00 -0.50 0.00 0.50 1.00 1.50 2.00
Z sc
o
57, 17%) was characterized by a low mean score of maternal IPV, high anger and alienation, low warmth and communication, and low maternal monitoring. More mothers in this class belonged to the high acculturation group and the adolescents were equal male and female. Class 3, the largest class (n = 182, 55%), was marked by low maternal IPV, low anger and alienation, high warmth and communication and high maternal monitoring. Class 4 (n = 84, 25%; Table 10) was high on maternal IPV but had positive mother-child relationship as indicated by low anger and alienation and high warmth and communication. Class 4 for also had the largest proportion of highly acculturated mothers and slightly more females than males were represented in this group.
Table 9Means and Proportions for 4-Class Model
Classes
Variables Overall Sample 1 2 3 4
Proportions Child gender
Male 0.46 0.00 0.49 0.49 0.44
Female 0.54 1.00 0.51 0.51 0.56
Maternal acculturation
Low 0.40 0.67 0.36 0.53 0.15
High 0.60 0.33 0.64 0.48 0.85
Means
Maternal IPV 0.30 0.78 0.16 0.12 0.76
Anger & alienation 2.42 4.01 3.14 2.16 2.32 Warmth & communication 4.04 2.09 3.07 4.40 4.11 Maternal monitoring 0.87 0.53 0.72 0.91 0.90 Average class probabilities
1 0.97 0.03 0.00 0.00
2 0.00 0.88 0.11 0.02
3 0.00 0.03 0.94 0.03
Figure 5: Standardized Means for 4-Class Model
3.2.2 Class Descriptions.
Overall, the conceptual and statistical evidence suggested that the three- class model had the most accurate and conceptually-significant classification. The three-class model fit
significantly better than the two-class model while the four-class model did not fit the data significantly better than the three-class model. Further, the classes for the three-class model are congruent with research on parenting and maternal IPV. Class 1 consisted of adolescents whose mothers experienced a moderate level of IPV and who reported negative relationships with their mothers and low maternal monitoring. Thus class 1 is described as a
“moderate-risk/low-protective” class. Class 2 consisted of adolescents whose mothers experienced high IPV yet who reported positive parenting relationships and high monitoring. This combination of markers suggests a “high-risk/high-protective” class. Adolescents in this class had mothers with high experiences of IPV, generally positive relationship with their mothers, and high maternal monitoring. Also for this class maternal warmth and the high maternal monitoring could be
Maternal IPV Anger & alienation Warmth & communication
Maternal monitoring
1 1.44 1.82 -2.48 -2.40
2 -0.41 0.83 -1.23 -1.05
3 -0.53 -0.29 0.46 0.38
4 1.38 -0.11 0.08 0.30
considered promotive factors rather than protective factors. Class 3, the largest of the 3 classes, consisted of adolescents with mothers who experienced low IPV, and who reported positive relationships with their mothers along with high maternal monitoring. This class could also be described as the normative class as it was the largest class and had very low risk factors and generally high positive factors. Class 3 is described as the “low-risk/high-protective” class. Examining the gender proportions for each class, we see that there were not big differences in the proportion of males and females between the classes. For maternal acculturation there were apparent differences between the different classes with class 2 having the greatest proportion of high-acculturated mothers (see Figure 6).
Figure 6: Intersectional Variables for 3-Class Model
Distal Outcome Analyses