Predictive Computational Model for Target Marketing
using Social Network Analysis and Artificial Neural
Network
Shweta Gupta
IIT,Roorkee
Mohit Juneja
Bharati Vidyapeeth’s College of Engineering
Devesh Batra
Bharati VidyaPeeth’s College of Engineering
ABSTRACT
This paper proposes a design for development of predictive computational model for target marketing. Computational model comprises of social network analysis and soft computing techniques. Social network analysis uses community structure detection approach to partition the data. Walktrap algorithm is used for community detection because it gives better result concerning running time and quality of obtained community structure. Consequently, soft computing technique such as neural network is implemented to train the system. Finally, NARX model is used for the prediction of the trained system so that any new user can be assigned to his corresponding community. This research is important because it shows how online social networks enable marketers to provide more effective marketing strategies and increase the product acceptance rate.
Index Terms
Target marketing, social network analysis, Clustering,Walktrap algorithm, artificial neural network, NARX model.
1.
INTRODUCTION
Target Marketing involves breaking a market into segments and then concentrating the marketing strategies on one or a few key segments. Such clustering helps the marketers to design specific strategies and techniques to promote a product amongst its target market. A target-based marketing system predicts the content that is relevant to a given person and advertises only this information to that person. With growth in internet traffic and social networking, social network analysis can be used by marketers to develop efficient marketing strategies. A study that looked at the advantages of using social networks found that by creating sub-groups of people based on interaction data, they were able to increase the quality of advertising [4]. Starting with an entire graph of all the users and then partitioning the users into communities enables marketers to target their market more effectively.
2.
SOCIAL NETWORK ANALYSIS
A social network consists of individuals who are connected to other individuals through social links such as friendship, profession or family. Social networks encode how people are connected to each other. With increased access to the internet, people can connect to each other more easily, increasing the diversity of social networks. Although people can have a diverse set of connections, it is usually seen that many of these connections tend to be homophilous [1]. Homophily is
defined to be the tendency for individuals to associate with people of similar interests and demographics such as age, gender, hometown, etc [1]. This property of networks has attracted the marketers because similar people tend to have similar interests and thus have similar purchase pattern. Social network analysis(SNA) is the logical analysis of social networks which interprets social relationships in terms of network theory, consisting of nodes and ties. Nodes are users within the network and ties are the relationships between the individuals. These networks are often represented in a social network diagram, where nodes are depicted as points and ties are depicted as links between two individuals based on one or more types of interdependencies such as friendship, kinship, professional, etc. Social network can provide a better marketing tool as it enables marketers to frame effective marketing strategies.
This project is essentially divided into different sections: Data Acquisition from Facebook, Data Analysis, which entails looking at the data collected, followed by Training and Prediction sections, using neural networks and NARX model respectively.
2.1
Community Detection
Community Detection structure finds dense subgraphs in directed and undirected graphs by optimizing some criteria and usually some heuristics. Membership gives the division of vertices into communitites. In our research, community detection is done using Walktrap algorithm.
2.2
Walktrap Algorithm
2
Algorithm
We start from a partition P1 = {{v}, v ∈ V } of the graph into n communities reduced to a single vertex. We first compute the distances between all adjacent vertices. Then, this partition evolves by repeating the following operations. At each step k:
• choose two communities C1 and C2 in Pk according to a criterion based on the distance between the communities. • merge these two communities into a new community C3 = C1 ∪ C2 and create the new partition: Pk+1 = (Pk \ {C1, C2}) ∪ {C3}.
• update the distances between communities.
•After n − 1 steps, the algorithm finishes and we obtain Pn = {V }.
Each step defines a partition Pk of the graph into communities, which gives a hierarchical structure of communities called dendrogram. This structure is a tree in which the leaves correspond to the vertices and each internal node is associated to a merging of communities in the algorithm: it corresponds to a community composed of the union of the communities corresponding to its children.The key points in this algorithm are the way we choose the communities to merge and the fact that the distances can be updated efficiently.
3.
ARTFICIAL NEURAL NETWORK
“Artificial neural networks” is a computational metaphor inspired by studies of the brain and nervous systems in biological organisms. They are highly idealized mathematical models of the essence of our present understanding of how simple nervous systems work. Neural networks operate on the principle of learning from examples; no model is specified a priority. Neural networks are likened to non-parametric models in the statistical literature. Neural networks are used to solve complex non-linear function approximation problems, difficult linearly inseparable pattern classification problems, speech recognition and control problems, and complex time-series modeling problems though the neural network technology has been applied in various fields. Neural networks can be characterized in terms of the three entities:
1. Model of neurons i.e., characteristics of the processing unit.
2. Models of interconnection structure, i.e., the topology of the architecture and strength of the connections that encode the knowledge.
3. A learning algorithm, i.e., the steps involved in adjusting connection weights of neural network.
3.1
Back Propagation Algorithm
1. For the output layer neurons, compute the difference between the actual and the desired output, i.e., calculate the error in each neuron of the output layer. 2. For the hidden layer neurons, multiply all the weights between the hidden layer neuron and the output layer neurons with the error of the corresponding output layer neurons and add the product.
3. Compute the error derivative of the weights. It is the product of the error of the neuron computed in step 2 and the value of the weight through the incoming connection.
[image:2.595.316.537.166.351.2]4. Adjust the weights of each neuron to minimize the error.
Figure 1: Back Propagation Technique
3.2
NARX Model
The non-linear autoregressive network with exogenous inputs (NARX) is a recurrent dynamic network, with feedback connections enclosing several layers of the network. The NARX model is based on the linear ARX model, which is commonly used in time-series modeling. The defining equation for the NARX model is:
where the next value of the dependent output signal y(t) is regressed on previous values of the output signal and previous values of an independent(exogenous) input signal. Here y is the variable of interest and u is the externally determined variable. In this scheme, information about u helps predict y, as do previous values of y itself. For example, y may be air temperature at noon, and u may be the day of the year (day-number within year). The function F is some nonlinear function, such as a polynomial. F can be a neural network, a wavelet network, a sigmoid network . There are many applications for the NARX network. It can be used as a predictor, to predict the next value of the input signal. It can also be used for nonlinear filtering, in which the target output is a noise-free version of the input signal.
Figure 2: Architectures of NARX Model
4.
IMPLEMENTATION
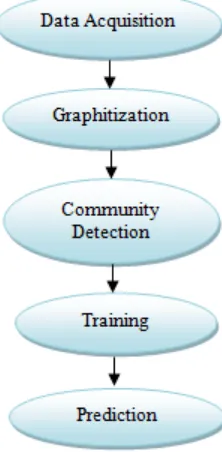
1.Data acquisition: Group membership matrix is prepared which consists of rows as users and columns as various groups. Data used here is from Facebook.
2. Graphitization: This matrix is converted into graph for the visualization where nodes are actors and edges represent the ties between the individuals. Then, the isolated nodes are removed from the graph to construct a completely connected graph so that community detection is possible. Implementation uses „R‟ tool, which is a Programming Environment for Data Analysis and Graphics, and an integrated suite of software facilities for data manipulation, calculation and graphical display.
3. Community detection: We are using Walktrap community detection algorithm here. The output is the dense subgraphs pertaining to different communities.
Figure 3: Implementation steps
4. Training: After detection community, the membership data and the group membership data is fed into neural network for training the system. It is implemented using MATLAB neural network tool.
5.Prediction: Prediction is a kind of dynamic filtering in which past values of one or more time-series are used to predict future values. “Dynamic neural networks” which includes tapped delay lines, are used for non-linear filtering and prediction. It is done using MATLAB system NARX model so that any new user can be allotted to his corresponding community based on his past and current group membership matrix data.
5.
EXPERIMENTAL RESULTS
[image:3.595.317.542.312.480.2]User interaction graph is plotted and isolated users are removed. Completly connected graph is communitized using Walktrap algorithm. Result of communitization is fed into neural network to train the system. Further, the trained system is predicted using NARX Model.
Figure 4: User relationship graph
[image:3.595.113.224.490.716.2] [image:3.595.314.542.526.710.2]4 Three different communities are formed pertaining to
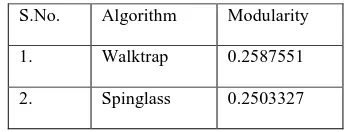
[image:4.595.318.542.71.304.2]different colors. The communities are framed on the basis of homophlily between users and their friends. It will enable marketers to frame better marketing strategies to maximize product acceptance rate. The modularity of a graph with respect to some division(or vertex types) measures how good the division is or how separated are the different vertex types from each other. Modularity of walktrap algorithm is compared with spinglass algorithm.
[image:4.595.54.281.174.351.2]Figure 6: Communitization of users
Table 1: Comparision of community detection algorithm
S.No. Algorithm Modularity 1. Walktrap 0.2587551
2. Spinglass 0.2503327
Results show that walktrap algorithm outperforms spinglass algorithm and hence gave better results.
[image:4.595.315.541.333.565.2]Figure 7: Neural Network Performance Graph
Figure 8: Neural Network performance parameters
Figure 9: Regression Plot with value 0.99976
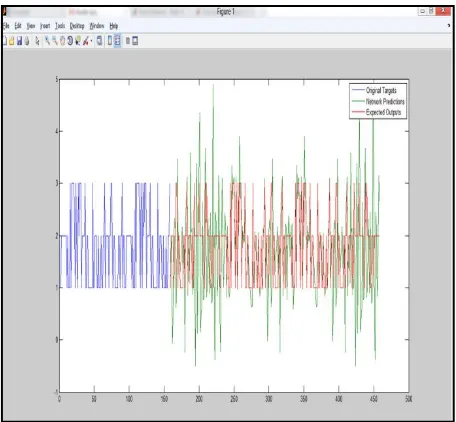
[image:4.595.79.252.395.461.2] [image:4.595.55.280.510.679.2]Figure 10: Network Prediction by NARX model
6.
CONCLUSION
A predictive computational model for target marketing using social network analysis and artificial neural network was successfully designed. On one hand, social network analysis was used to segment the users into various communities based on homophily between users and their friends, whereas, on the other hand, techniques pertaining to soft computing such as neural network were implemented to train the system. Consequently, NARX model was used for prediction so that any new user can be allotted to his corresponding community based on his group membership. Pertaining to each community, several target marketing schemes can be designed.
7.
REFERENCES
[1] Miller McPherson, Lynn Smith-Lovin, and James M Cook. Birds of a feather: Homophily in social networks. Annual Review of Sociology.
[2] Artificial Neural Networks Ajith Abraham Oklahoma State University, Stillwater, OK, USA ,Handbook of Measuring System Design, edited by Peter H. Sydenham and Richard Thorn. 2005 John Wiley & Sons, Ltd. ISBN: 0-470-02143-8
[3] G.Grudnitski and A.Quang “ Important factors in neural networks‟ forecast of gold futures prices,” in Proc. Of the 4th International Conference of Neural networks in the Capital Market, 1996, pp-163-176.
[4] Wan-Shiou Yang et. al. Mining Social Networks for Targeted Advertising. IEEE, 2006. Proceedings of the 39th Hawaii International Conference on System Sciences.
[5] Pedro Domingos. Mining social networks for viral marketing. IEEE Interlligent Systems, 21(1):80{82, 2005.
[6] Influence of Social Networks in Target Marketing Dept. of CIS - Senior Design 2009-2010 Aman Nalavade,Vanditha Srungavarapu,Lyle Ungar,Shawndra Hill ,Univ. of Pennsylvania, Philadelphia, PA
[7] Long-Term Time Series Prediction with the NARX Network: An Empirical Evaluation, Jose Maria P. Junior and Guilherme A. Barreto,2007.
[8] Selection of the Target Group based on Social Network, Przemysław Kazienko, Katarzyna Musiał, and Aleksander Zgrzywa,Institute of Applied Computer Science Wrocław University of Technology.
[9] Hanneman R., Riddle M., 2005, “Introduction to social network methods”, online textbook, available from Internet <http://faculty.ucr.edu/~hanneman/nettext/> (01.04.2006).
[10] Kazienko P. and Musiał K,. 2006, “Recommendation Framework for Online Social Networks”, The 4th Atlantic Web Intelligence Conference, AWIC 2006, Studies in Computational Intelligence, Springer Verlag, 111 – 120.
[11] Wasserman, S., Faust, K., 1994, “Social network analysis: Methods and applications”, Cambridge University Press, New York.
[12] Yang, W.S., Dia, J.B., Cheng, H.Ch., Lin, H.T., 2006, “Mining Social Networks for Targeted Marketing”, 39th