GOR Method for Protein Structure Prediction using
Cluster Analysis
Prof. Rajbir Singh
Associate Prof. & HeadDepartment of IT LLRIET, Moga
Neha Jain
Assistant Prof. (CSE)Department of CSE NWIET, Moga
Dheeraj Pal Kaur
Assistant Prof. (ECE)Department of ECE LLRIET, Moga
ABSTRACT
Protein structure prediction is one of the most important problems in modern computational biology. The emphasis here is on the use of computers because most of the tasks involved in genomic data analysis are highly repetitive or mathematically complex. The problem of this research focus on secondary structure prediction of amino acids. In the present research work, the GOR (Garnier, Osguthorpe, and Robson) Method is implementedso as to deal with amino acid residues to predict the 2D structure using different input formats of sequences. Combination of amino acids results in formation of protein through peptide bond. The practical implementation of protein structure prediction completely depends on the availability of experimental database. The analysis and interpretation of bioinformatics database which includes various types of data such as nucleotide and amino acid sequences, protein domains, and protein structures is an important step to determine and predict protein structure so as to understand the biological and chemical activities of organisms. GOR method uses the information theory to generate the code that relates amino acids sequence and secondary structure of proteins. Three scoring matrices are prepared in GOR method to calculate the probability of each amino acids present in every positions. Cluster analysis is used as data mining model to retrieve the result
General Terms
Hierarchial clustering, GOR algorithm, Genetic computer group, Genbank database, FASTA format,
Keywords
Amino Acid, Protein, Polypeptide, DNA, RNA, DSSP, GOR.
1.
INTRODUCTION
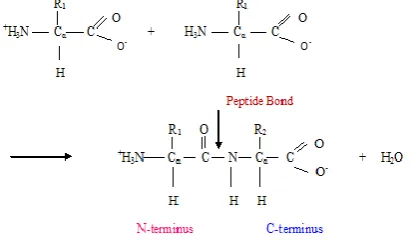
Proteins are the complex organic macromolecules which are essential for the functioning, structure and regulation of body’s cells, tissues and organs. Proteins consist of amino acids joined together by peptide bond to form a polypeptide and it is a protein as in Figure 1. Many proteins function as enzymes or form subunits of enzymes and some of the proteins play structural or mechanical roles. Some proteins used as the storage and transport of various ligands and some function in immune response. Proteins serve as nutrients as well and they provide the organism with the amino acids that are not synthesized by that organism. A chain of such peptide bonds is called polypeptide and is a protein.
An amino acid is any molecule that contains both an amino group and a carboxylic acid group. An amino acid residue is the residuals of an amino acid after it forms a peptide bond and loses a water molecule. Since we are interested in amino acids that form proteins, it is safe to use the terms residue and
[image:1.595.323.529.305.427.2]amino acid interchangeably. There are 20 different amino acids in nature that form proteins. These 20 are encoded by the universal genetic code. Nine standard amino acids are called "essential" for humans because they cannot be created from other compounds by the human body, and so must be taken in as food.
Fig 1: Formation of Peptide
Protein structures are the sequence of amino acids present in a protein chain. Protein structures may be classified into four levels or classes: primary, secondary, tertiary, and quaternary structure.
1. Primary structure of proteins is the sequence of amino acids which are held together by covalent bonds. Sequence direction is important component; it starts from amine (N) to carboxyl (C) terminal.
2. Secondary structure Sequences of primary structures tend to arrange themselves into some spatial arrangement; these units are referred to as secondary structure. Important factors in protein secondary structure are the angles and hydrogen bond patterns between the backbone atoms. A common pattern in protein forms the secondary structure. Secondary structure is further divided into three parts: alpha-helix, beta-sheet, and loop.
3.Tertiary structure is three-dimensional structure of the protein, which is formed from the secondary structures of amino acids. In other words, tertiary structure is the arrangement of all its atoms in spatial arrangement without having its relationship to neighboring atoms.
1.1
Cluster Analysis Technique
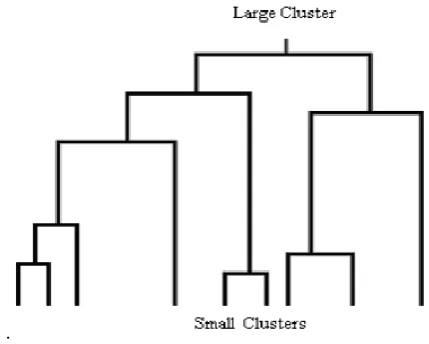
Cluster analyzes the data objects without consulting a class label. The objects are clustered or grouped based on the principle of maximizing the intra-class similarity and minimizing the interclass similarity. Clusters of objects are formed so that objects within a cluster have high similarity in comparison to one another but are very dissimilar to in other clusters. Each cluster that is formed can be viewed as a class of objects from which rules can be derived [13]. Fig. 2 below shows how several clusters might form a hierarchy. When a hierarchy of clusters like this is created the user can determine the right number of clusters that adequately summarizes the data while still providing useful information (at the other extreme, a single cluster containing all the records is a great summarization but does not contain enough specific information to be useful). Clustering analysis has received significant attention in the area of gene expression. It allows the identification of the structure of a data set, i.e. the identification of groups of similar objects in multidimensional space. Clustering procedures yield a data description in terms of clusters or groups of data points that possess strong internal similarities.
Hierarchical Clustering: These methods start with each point being considered a cluster and recursively combine pairs of clusters (subsequently updating the inter-cluster distances) until all points are part of one hierarchically constructed cluster.
.
Fig. 2 Hierarchy of Clusters.
1.2 SECONDARY STRUCTURE
CLASSIFICATION
The DSSP Code: There is one method to classify the secondary structure named- “the Dictionary of Protein Secondary Structure” commonly referred to as DSSP code to define unambiguously secondary structure based on their physical and geometrical properties. Database of Secondary Structure in Proteins (DSSP) is widely used in protein science to define the secondary structure assignment.
Eight elements of secondary structure assignment are there according to the DSSP classification, which are denoted by the letters H (α-helix), E(extended β-strand), G(310 helix), I (α-helix), B(bridge, a single residue β-strand), T(β-turn), S (bend), and C (coil).
Number of elements according to DSSP classification is too many for existing methods of the secondary prediction, instead usually only three states are predicted as in Table 1 helix (H), extended (b-sheet) (E), and coil (C). According to
[image:2.595.62.277.377.549.2]the requirement this eight letter DSSP alphabet translated into the three letter code.
Table 1: Reducing DSSP 8 classes code to 3 Classes
DSSP 8-classes 3-class
α-helix (H) ,3/10 helix (G) Helix(H)
β-sheet (E), β- Bridge(B) Strand(E)
π-helix (I),Turn(T), Bend(S), Coil(C) Coil(C)
1.2.1 Chief elements of secondary structure are:
1. Alpha helix: Alpha helix is most commonly known as 4-turn helix and it’s the commonly occurring type of element in proteins. The helical structure is used to arrange amino acids through 5A wide. Amino acids are translated to next amino acid along helical axis about 1.5A. A canonical α-helix has 3.6 residues per turn, and is built up from a contiguous amino acid segment via hydrogen bond formation between amino acids in positions i and i + 4. 10 amino acids are specifying the average length of alpha helix. Minimum 4 amino acids are required for structure to be classified as alpha helix. The residues taking part in an α-helix have φ angles around −60 and ψ angles around −50. Alpha helix present at the surface of protein cores. These cores provide an interfacing with aqueous environment.
2. β-sheet: The beta sheet is commonly known second type of structure element. Two or more amino acid sequences (beta strands) present in same protein that bond together through hydrogen bond forms the beta sheet. A β-strand is a more extended structure with 2.0 residues per turn. Values for φ and ψ vary, with typical values of −140 and 130. strand interacts via hydrogen bonds with other strands, which may be distant in sequence, to form a β-sheet. These strands can bond with adjacent strand through parallel in and anti-parallel configuration. A β -sheet consists of individual β -strands, each of which is made up of contiguous amino acid residues. The dihedral angle in anti-parallel sheets are φ=-140 and ψ=135 and in parallel sheets are φ=-120 and ψ=115. The Parallel Beta-Sheet is characterized by two peptide strands running in the same direction held together by hydrogen bonding between the strands. The Antiparallel Beta-Sheet is characterized by two peptide strands running in opposite directions held together by hydrogen bonding between the strands.
3. Coils and Loops: Coil or loop regions connect α-helices and β-sheets and have varying lengths and shapes. They do not have even patterns like alpha-helices and beta-sheets and they could be any other part of the protein structure. They are recognized as random coil and not classified as protein secondary structure. These are also known as local structures and have irregular shape. In loop or coil residue located on the surface of the protein structure and tends to be charged and polar. Glycine and proline are the commonly known structures.
2.
LITERATURE REVIEW
alignments with the GOR method. Additional improvement in the predictions is obtained by a simple correction of the results when helices or sheets are too short, or if helices and sheets are direct neighbours along the sequence [14]. The imposition of the requirement that the prediction must be strong enough, i.e. that the difference between the probability of the predicted (most probable) state and the probability of the second most probable state must be larger than a certain minimum value also improves significantly secondary structure predictions.
3.
GOR METHODOLOGY
It is based on information theory and Bayesian statistics. Information theory approaches are popular in secondary structure prediction and these approaches are mathematical probability based. Information theory is a class of the mathematical theory of probability and mathematical statistics that defines the concept of information. Day-to-day increasing amount of information related to protein structural has motivate researchers to develop several approaches that use this information theory for generating new ideas to predict protein structure and function. Most commonly, the secondary structure prediction problem is formulated as follows: Given a protein sequence with amino acids r1 r2 . . . rn, predict
whether each amino acid ri is in an α −helix (H), a β −strand
(E), or neither (C) [18]. Predictions of secondary structure are typically judged via the 3-state accuracy (Q3), which is the
percent of residues for which a predicted secondary structure (H, E, or C) method is correct.
[image:3.595.337.533.116.355.2]
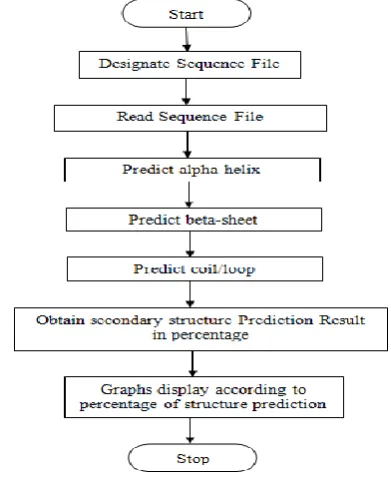
Fig 3: Prediction Scheme
The secondary structure prediction GOR method is one of the first major methods proposed for prediction of structure from sequence. The three alphabets GOR were derived from the first letter of their names (Garnier-Osguthorpe-Robson. In used version of GOR method, database of 267 proteins are used which contains 63,000 residues [11].
In prediction method for secondary structure of protein determines the accuracy in terms of present percentage of helix, sheet and coil. Formation of α-helix, β- sheet and coils are predicted with respect to each amino acid residue present in a sequence of amino acids residues. Result of the prediction of all secondary structure elements are combined to obtain the result of prediction of secondary structure of protein as in fig 4. Rather than considering propensities for a single residue, position-dependent propensities have been calculated for all residue types. GOR method work on various types of sequences formats which uses the information theory to generate the code that relates amino acids sequence and secondary structure of proteins. Three scoring matrices are prepared in GOR method to calculate the probability of each
[image:3.595.86.287.383.530.2]amino acids present in every positions. One matrix corresponds to the central amino acid being found in α helix, the second for the amino acid being in a β strand, the third a coil.
Fig: 4 General Framework for Protein Secondary Structure Prediction Method
GOR method works on window of 17 residues, eight nearest neighboring residues are included in calculations for a given residue. The conformational state among three states will be predicted and depends upon the type of amino acid R as well as neighboring residue along window. Information theory helps to retrieve the information function. GOR method calculates information from residue within sliding window as in fig 5.
To determine the structure for a given amino acid position j, the GOR method looks at a window of 8 amino acids before and 8 after the position of interest . Suppose aj is the amino
acid that we are trying to determine. GOR looks at the residues in Equation
Intuitively, it assigns a structure based on probabilities it has calculated from protein databases. These probabilities are of the form as
Pr[amino acid j is α
| ]
Pr[amino acid j is β
| ]
In GOR method, three scoring matrices, and each column consist the probability of finding each amino acid at one of the 17 positions, are prepared. Information theory forms on the basis of information function I(S, R) which will be fully represented in mathematical notation together with other functions and formula. The information function is described in terms of logarithm ratio of the conditional probability P (S|R) of observing conformation S.
The information available as to the joint occurrence of secondary structural conformation S and amino acid R is given by
I(S; R) = log [P(S/R)/P(S)]
M
E
R
P
Y
A
C
P
…
.
C
C
C
C
E
E
C
C
where P(S | R) is the conditional probability of conformation S given residue R, and P(S) is the probability of conformation S. The information function is defined as the logarithmic ratio of the conditional probability P (S|R). Where S is observed conformation which can be one of three states: helix (H), extended (E), or coil (C)- for residue R, where R is one of the 20 possible amino acids and the probability P(S) of the occurrence of conformation S.
By Bayes’ rule, the probability of conformation S given amino acid R, (S | R) is given by
P(S | R) = P(S, R) / P(R)
where P(S, R) is the joint probability of S and R and P (R) is the probability of R. These probabilities can be predicted from the frequency of each amino acid found in each structure and the frequency of each amino acid in the structural database. Given these frequencies as
I (S; R) = log (fS,R / fS)
Where fS, R is the frequency of amino acid R in conformation
S and fS is the frequency of all amino acid residues found to
be in conformation S.
Fig: 5 Work Flow Diagram of GOR
Advantages of GOR method are:
1. The GOR method identifies all factors that are included in the analysis and calculates probabilities of all three conformational states.
2. GOR algorithm is computationally fast utilizing less CPU memory.
3. It is possible to perform the full jack-knife procedure. In this procedure single protein is removed from the database and the frequencies are recalculated.
4. The GOR method reads a protein sequence and predicts its secondary structure. For each residue along the sequence, the program calculates the probabilities for each confirmation state such as (H, E and C), and on the basis of this probability secondary structure prediction for such states are calculated. Except in very few cases, the state with highest probability corresponds to the predicted conformational state.
4. SEQUENCE FORMATS
Sequences can be read and write in variety of formats. Sequence formats are ASCII TEXT which contains the information like arrangement of characters, symbols and keywords that specify what things such as the sequence, ID name, comments, etc. look like in the sequence entry.
1. FASTA format begins with a single-line description, followed by lines of sequence data. FASTA format is text-based format used for representing nucleotides and peptide sequences, in which single-letter codes are used to represent nucleotide and amino acid. It is default format and contains the header and sequence. The description line is distinguished from the sequence data by a greater-than (">") symbol in the first column. The simple format fasta has the ID name as the first word on its title line. Sequence end indicate when another line starts with “>”; it means next sequence starts. For example the ID name 'xyz' FASTA format sequence represented as below:
>xyz some other comment
ttcctctttctcgactccatcttcgcggtagctgggaccgccgttcagtcgccaatat gcagctctttgtccgcgcccaggagctacacaccttcgaggtgaccggccaggaa acggtcgcccagatcaaggctcatgtagcctcactggagggcatt
2. Genbank database is collection of all publicly available nucleotide sequences and their protein translations. National Center for Biotechnology Information (NCBI) produced and maintained the Genbank database where NCBI as part of the International Nucleotide Sequence Database Collaboration (INSDC). GenBank Format Sequence represented as below:
Eg: LOCUS AAU03518 237 bp DNA PLN 04-FEB-1995
DEFINITION Aspergillus awamori internal transcribed spacer 1 (ITS1) and 18S
rRNA and 5.8S rRNA genes, partial sequence. ACCESSION U03518
BASE COUNT 41 a 77 c 67 g 52 t ORIGIN
1aacctgcgga aggatcatta ccgagtgcgg gtcctttggg cccaacctcc catccgtgtc
61 tattgtaccc tgttgcttcg gcgggcccgc cgcttgtcgg ccgccggggg ggcgcctctg
121ccccccgggc ccgtgcccgc cggagacccc aacacgaaca ctgtctgaaa gcgtgcagtc//
3. GCG (Genetic Computer Group Format) contains:
1. Exactly one sequence 2. Begins with annotation lines
3. Start of the sequence is marked by a line ending with “..” two dot character
4. This line also contains the sequence identifier, the sequence length and a checksum.
5. GCG format sequence used by GCG program suites 6. Sequence editing or check sum changed will no
longer be valid and the sequence file will not work. GCG Format Sequence represented as below:
XX SQ Sequence 237 BP; 41 A; 77 C; 67 G; 52 T; 0 other; AA03518 Length: 237 Check: 4514
1 aacctgcgga aggatcatta ccgagtgcgg gtcctttggg cccaacctcc catccgtgtc
61 tattgtaccc tgttgcttcg gcgggcccgc cgcttgtcgg ccgccggggg ggcgcctctg
121 ccccccgggc ccgtgcccgc cggagacccc aacacgaaca ctgtctgaaa gcgtgcagtc
5.
RESULTS AND DISCUSSION
In present work, we deal with amino acid residues to determine the secondary structure of sequences. GOR method will be used to predict the structure of amino acids. Combination of amino acids results in formation of protein through peptide bond.
GOR method is window structure based experiment. It uses the 17*20 window size. It predicts the percentage of three conformational states according to the presence of it in protein sequence. The DSSP code is used in GOR method that will reduce the 8 classes code to 3 classes. Different types of sequence formats are used in present work as input. Each format has its own format and significance. Classification trees are generated from root node down to leaf node. It will check the values of one predictor or variable. MATLAB platform is used to done the present work. FASTA is fast alignment format and contains the header and sequence. Genbank database is collection of all publicly available nucleotide sequences and their protein translations. GCG contains the sequence that is marked by a line ending with “..” two dot character.
GOR method provides the secondary structure to every protein sequence. Structure is given in the format of percentage corresponding to the presence of conformational states that are helix, sheet and coil. Resulted graph drawn according to their percentage values. User can edit its own sequence to achieve the results.
6.
CONCLUSION & FUTURE WORK
I have studied the GOR method based on information theory and Bayesian Statistics is quite successful in its accuracy of secondary structure prediction. Probabilities of three conformational states are predicted for each residue in the sequence with the help of GOR method and this information can be used for further analysis. These are results are achieved when predictions are made on single sequence.
The developed method is highly stable and consistent when tested against the different DSSP secondary structure reduction methods conducted in this research. Information regarding the secondary structure elements such as helix, sheet and coil that form for a particular sequence of amino acid is distributed across whole window.This information is retrieved from database of 267 proteins. Different types of input formats of sequences are used to determine the accuracy of secondary structure prediction in GOR method.
Various recommendations for further work in the domain of protein secondary structure prediction can be done.
1. Variety of different sequences formats can be introduced for further analysis.
2. Varieties of Bioinformatics tools are available which can be used to incorporate new research in Bioinformatics field.
3. Present GOR method is based on single sequence but in future it can be incorporated to multiple sequence alignment to achieve different results.
4. Since the research in bioinformatics field increasing rapidly. So our requirement to achieve optimal result in less time.
7.
ACKNOWLEDGMENTS
The author wishes to express his sincere gratitude and indebtedness to his Supervisor, Prof. Rajbir Singh (Assoc. Prof. & Head, Department of Information Technology) for his valuable guidance, attention-grabbing views and obliging nature which led to the successful completion of this study. I lack words to express my cordial thanks to the members of
Departmental Research Committee (DRC) for their useful comments and constructive suggestions during all the phases of the present study as well as critically going through the manuscript.
Words fail the author to express his deep sense of gratitude towards his family members for their moral and financial support and encouragement without which the author would not have been able to bring out this thesis.
8.
REFERENCES
[1] An, B., et al (2009) “Accuracy of Protein Secondary Structure Prediction Continues to Rise” International Conference on MASS’ 09, pp.1-4.
[2] Akitomi, J. (2007) “Method for predicting Secondary Structure of RNA, an apparatus for predicting and a predicting program” US Patent 0235155.
[3] Balaban, D.J. and Aggarwal, A. (2005) “Method and apparatus for providing a Bioinformatics Database” US Patent 7215804.
[4] Chang, J. and Zhu, X. (2010) “Bioinformatics Database: Intellectual Property Protection Strategy” Journal of Intellectual property Rights Vol 15, pp.447-454. [5] Chen, X., et al (2011) “The use for classification trees for
bioinformatics”, John Wiley & Sons, Inc. WIREs Data Mining Knowledge Discovery vol. No. 4, pp 55–63. [6] Deris, S.B. et al. (2007) “ Protein Secondary Structure
Prediction From Amino Acid Sequence Using Artificial Intelligence Technique” , Journal of bioinformatics , vol. No. 5, pp. 1-245.
[7] Exarchos, K.P. et al (2007) “Predicting peptide bond conformation using feature selection and the Naive Bayes approach” IEEE EMBS 2007, pp.5009-5012. [8] Fallahi, H. and Yarani, R. (2010) “Positional preferences
by 20 amino acids in beta sheets” IEEE BIBMW, pp.806-807.
[9] Gerhart, J. and Sacan, A. (2011) “BioDB: Integration of biological knowledgebases” IEEE BIBMW 2011, pp. 899.
[10] Greene, L.A. (2011) “Polypeptide Structural Motifs Associated With Cell Signaling Activity” US Patent 0004185.
[11] Garnier, J. et al (1996) “GOR method for predicting Protein Secondary Structure from Amino Acid Sequence” Methods in Enzomology, vol 266, pp. 540-553.
[12] Ismail, W.M. and Chowdhury, S. (2010) “Preference of Amino Acids in Different Protein Structural Classes: A Database Analysis” ICBBE 2010, p. 1-5.
[13] Jiang, D. Tang, C. and Zhang, A. (2004), “Cluster Analysis for Gene Expression Data”, IEEE Transactions on knowledge and data engineering, vol. 11, pp. 1370-1386.
[14] Kumar, B. and Jani, N.N. (2010) “Prediction of Protein Secondary Structure based on GOR Algorithm Integrating with Multiple Sequences Alignment” International Journal of Advanced Engineering and Applications, pp.177-182.
[15] Singh, R., et al (2010) “Chou-Fasman Method for Protein Structure Prediction using Cluster Analysis” World Academy of Science, Engineering and Technology 72 2010, pp. 982-987.
[17] Sen Z.T., et al (2005) “GOR V server for protein secondary structure prediction” vol. 21, no. 11, pp 2787-2788.
[18] Singh, M. (2001) “Predicting Protein Secondary and Super Secondary Structure” CRC Press, pp. 29.1-29.30 .
Singh R is an Associate Professor & Head, Department of Information Technology of Lala Lajpat Rai Institute of Engineering & Technology Moga, India. He received his B.E (Honor) degree in Computer Science and Engineering from MD University, Rothak, Haryana and M-Tech degree in Computer Science and Engineering from Punjab Technical University, Jalandhar Pb. (INDIA). He has authored 03 books on Computer Science. His main field of research interest is Bio-Informatics and Data mining. He works on the Gene Expression, Phylogenetic Trees and Prediction of Protein Sequence & Structure.