Image Classification based on Color and Texture
features using FRBFN network with Artificial Bee Colony
Optimization Algorithm
D. Chandrakala
Associate Professor
Department of Computer Science and Engineering Kumaraguru College of Technology, Coimbatore,
Tamil Nadu, India
S. Sumathi
Associate Professor
Department of Electrical and Electronics Engineering
PSG College of Technology, Coimbatore, Tamil Nadu, India
ABSTRACT
With advances in information technology, there is an explosive growth of image databases which demands effective and efficient tools that allow users to search through this large collection. Conventionally, the way of searching the collections of digital image database is by matching keywords with image caption, descriptions and labels. Keyword based searching method provides very high computational complexity and the user has to remember the exact keywords used in the image database. Even though the computational complexities of the traditional image retrieval systems are high, they produce low classification accuracy. This paper proposes an image classification system based on combined color and texture features of an image to overcome these problems. This system consists of different stages such as image preprocessing, color and texture features extraction and fuzzy c-means radial basis function neural (FRBFN) network based classification/retrieval with Artificial Bee Colony (ABC) optimization algorithm. In this scheme, the color features are derived using Histogram Equalization method in HSV space and the texture features represented by contrast, energy, entropy, correlation and local stationary over the region in an image derived based on co-occurrence matrix. The proposed neural network based Comprehensive Image Classification (CIC) scheme fuses the low level features of the image such as color and texture to improve the systems classification performance and these features are converted as high level features by Radial Basis Function Neural Network(RBFN) with Fuzzy c-means (FCM) to fix the hidden layer neurons. The weight vectors of the network are reasonably assigned by Artificial Bee Colony (ABC) optimization algorithm. The experimental results show that the proposed method is superior to other traditional Content Based Image Retrieval (CBIR) methods in classifying the images with less computational time. The performance of proposed scheme was evaluated with a set of 600 color images taken from COREL benchmark image library and the routines of the proposed system were simulated using MATLAB R2008b.
General Terms
Neural Networks, Image Classification
Keywords
Histogram equalization, CBIR, Co-occurrence matrix, Multi- feature Fusion,FRBFN,ABC optimization.
1. INTRODUCTION
Along with the popularity and development of Internet, multimedia data including videos and images have been dramatically increased in our daily life. Retrieving accurate useful information quickly in mass multimedia becomes a research topic today. Images are rich in content and they facilitate international exchanges without language restrictions. Retrieving images from a vast collection has become one of the interesting challenges and has drawn the attention of researchers towards the development of retrieval approaches based on low level features of image. The traditional Keywords Based Image Retrieval (KBIR) [19] retrieves images by matching keywords with image annotations, labels etc., often returning irrelevant results and consuming more time. In addition, it is clearly partial to describe content rich multimedia information with a small amount of text [3]. The Content Based Image Retrieval (CBIR) system deals with the low-level features to describe the content of the image and it breaks through the limitation of traditional text query techniques. The main focus of image classification system is to analyze image information by low level features of an image [2] which include color, shape, structure and texture of object and to set up feature vectors of an image as its index. The implementation of image classification system based on single feature describes the content of an image from a specific angle that might be suitable for simple images, besides relating an image with a single feature that is incomplete. Representing an image with multi-features from multi-angles is expected to achieve better results since different features reflect the uniqueness of the image. In the proposed method the color and texture features are combined in a suitable way to achieve the intended results.
Automatic assignment of neural weights are done using Artificial Bee Colony optimization algorithm [4] to improve the image classification performance. In recent years, CBIR system has very broad and important application in areas including military affairs, medical science, education, architectural design and agriculture etc. Shahrooz et al. [20] proposed an enhanced RBFN network based on fuzzy c-means algorithm for obtaining relevant feedback to the retrieval system. This proposed experimental idea is extracted from [20] for classifying large image datasets by converting the low-level features of the image to high level. Jun Yue et al. [1] proposed a technique to retrieve images by combining the similarity score between query image and the database image based on color and texture features. The local and global color histogram is used as color feature and texture feature vectors are derived from co-occurrence matrix of the image. The fusion weights of color and texture are assigned equal values. As fusion weights were not optimum, the effectiveness of retrieval performance was inconsistent. B.G. Prasad et al. [5] proposed a technique to retrieve images by region matching using a combined feature index based on color, shape and location within the framework of MPEG-7. Simulation results show that the image retrieval was done only based on dominant regions within each image and hence the retrieval performance was incomplete. Young Deok Chun et al. [6] introduced a CBIR method based on an efficient combination of multi-resolution color and texture features. Auto-correlograms of the hue and saturation component of image in HSV space are considered as color feature and value component from Block Difference of Inverse Probabilities (BDIP)-Block Variation of Local Correlation Coefficients (BVLC) extracted in the wavelet transform domain were considered as texture feature. Experimental results for various image resolutions provided considerable retrieval accuracy only with high dimension feature vectors.
Tai X.Y. et. al. [7] proposed a novel image feature called color-texture correlogram which is the extension of color correlogram and the simulation performance shows that the retrieval of images using spatial correlation of color-texture feature vectors gives good retrieval accuracy. Almost all the related work concentrated on extraction methodologies of a range of low-level features of the image and comprehension of those features to have efficient retrieval routine without considering the optimum fusion weight value. In [17], two dimensional histograms of the CIELab chromaticity coordinates were chosen as color features and variance extracted by discrete wavelet frames analysis were preferred as texture features. The mean and covariance of RGB values and the energies of Discrete Cosine Transform (DCT) coefficients are used as color and texture features in [18]. A number of approaches have been proposed in literature to obtain substantial classification accuracy by combining low-level features. Typical examples of the CBIR systems include QBIC [9], Virage [10], Photobook [11], VisualSEEK [12], Netra[13] and SIMPLIcity [14] etc.Bayesian learning [21] and kernel based learning [22] have been used in CBIR systems, neither of which have been efficient enough to boost the retrieval performance due to lack of attention to the fuzzy logic embedded in the human decision.
The proposed ABC algorithm based fuzzy c-means radial basis function neural network is capable of estimating a high classification accuracy and reasonable retrieval rate with less
computational time by means of optimal initial hidden layer weights. Image classification results are analyzed based on Multi-features using FRBFN with random weights and proposed FRBFN with ABC optimization algorithm. The sections of the paper are organized as follows: Section 2 deals with the details and the scheme of comprehensive image classification model with color and texture features. Section 3 covers the experimental results and performance analysis of the multi-features fusion based image classification method using FRBFN and its hybrid version with ABC algorithm. Section 4 depicts the overall conclusion and the scope of future work.
2.
PROPOSED FRBFN BASED
COMPREHENSIVE IMAGE
CLASSIFICATION SCHEME
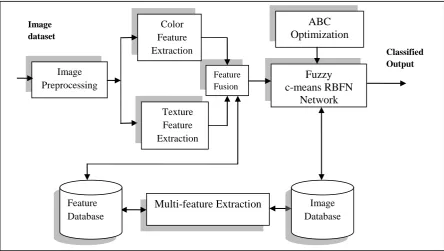
Image Classification deals with categorization of images based on similarity features by utilizing the visual content of an image in large-scale image databases, according to a user’s interest. The CBIR problem is motivated by the need to search the exponentially increasing space of image and video databases efficiently and effectively. In a typical image classification system, features related to visual content such as color, shape, structure or texture are extracted from the test set, the similarity between the set of features of the test images in the data set is computed, and the most similar images are grouped. In the proposed scheme the content of an image is analyzed in terms of combined low-level features such as color and texture extracted from the image and used for classification. The brief description of proposed scheme of implementing the FRBFN network to classify the dataset with simple and complex images is shown in Figure 1. The stages of the proposed schemes are image preprocessing, multi features extraction, FRBFN network for classification, optimization of initial network weights using ABC algorithm are discussed in this section
.
21 Figure 1 FRBFN based Comprehensive Image Classification Scheme
The texture is another widely used feature in image retrieval, which is intended to capture the granularity and repetitive patterns of surfaces within an image [2]. Color and texture feature extraction methods are elaborated.
2.1.1 Color Feature Extraction
The goal of color feature extraction is to obtain compact, perceptually relevant representation of the color content of an image. Color is one of the most widely used visual features and is invariant to image size and orientation [18][19]. The image retrieval problem is motivated by the need to search the exponentially increasing space of image and video databases efficiently and effectively. The visual content of an image is analyzed in terms of low-level features extracted from the image. One of the most important features that facilitates the recognition of images by humans is color. Color is a property that depends on the reflection of light to the eye and the processing of that information in the brain. Colors are defined in three dimensional color spaces such as RGB (Red, Green, and Blue), HSV (Hue, Saturation, and Value) or HSB (Hue, Saturation, and Brightness). In this proposed scheme the color features are extracted using Color Histogram in HSV color space. The steps to find the color feature are:
Step 1: RGB image is transformed to HSV model and the
perceived distance between colors is in proportion to Euclidean distance between corresponding pixels in HSV color model.
Step 2: Quantization in terms of color histograms refers to the
process of reducing the number of bins by taking colors that are very similar to each other and putting them in the same bin. In the HSV space the Hue is quantized into 16 bins and is among [0, 15], Saturation is quantized into 4 bins and is among [0, 3] and Value is quantized into 4 bins and is among [0, 3]. Among these the human cognition about color is mainly based on hue, then saturation and finally value. Thus the quantized results are coded as in Equation (1)
C
16
H
4
S
V
(1)where C is a integer between 0 and 255.
Step 3:The color histogram of an image in HSV color space is
obtained .Color histogram is a representation of the distribution of colors in an image. For digital images, a color histogram represents the number of pixels that have colors in each of a fixed list of color ranges that span the image's color space, the set of all possible colors.
Step 4: The similarity between color feature values of query
image and that of the database image is calculated using Euclidean distance similarity measure given in Equation (2), the closer the distance, the higher the similarity.
2 / 1 1
0
2
)
(
)
,
(
L
i
i i
s
q
s
q
D
(2)where
q
{
q
0,
q
1,...
q
L1}
is the feature vector of query image, ands
{
s
0,
s
1,...
s
L1}
is the feature vector of the database images, L is the number of dimensions of image features.2.1.2 Texture Feature Extraction
Texture is a visual feature that refers to inherent surface properties of an object and their relationship to the surrounding environment. The proposed texture feature representation scheme is based on image co-occurrence matrix. Co-occurrence matrix is widely used to extract texture feature in gray scale image and has been shown to be very efficient. The color image will be converted to a gray scale image by Equation (3) and the number of the gray scale value is 256.
B
114
0
G
589
0
R
29
0
Y
.
.
.
(3)where Y is the gray scale value and R,G, B represent red, green and blue components respectively. The co-occurrence probabilities provide a second-order method for generating texture features [16].
Image Preprocessing
Feature Fusion
Fuzzy
c-means RBFN
Network
ABC
Optimization
Image dataset
Classified Output Color
Feature Extraction
Texture Feature Extraction
Multi-feature Extraction
Image Database FeatureThese probabilities represent the conditional joint probabilities of all pair wise combinations of gray levels in the spatial window of interest given two parameters: inter pixel distance (δ) and orientation (θ). The probability measure can be defined as:
)}
,
(
|
{
)
(
ij
r
x
C
P
(4)where Cij (the co-occurrence probability between gray levels i and j) is defined as:
G
j
i
P
ij
ij
P
ij
C
0
,
(5)
where Pij represents the number of occurrences of gray levels
i and j within the given window, given a certain (δ, θ) pair; and G is the quantized number of gray levels. The sum in the denominator thus represents the total number of gray level pairs (i, j) within the window. Statistics applied to the co-occurrence probabilities to generate the texture features are defined in Equations (6-10)
Contrast =
C
ij(
i
j
)
2 (6)Energy =
2
)
(
C
ij (7)Entropy =
C
ijlog
C
ij (8)Correlation =
y x
ij y
x
j
C
i
)(
)
(
(9)
Local Stationary =
C
ij|
i
j
|
(10)The gray scale quantification is made and the corresponding co-occurrence matrix of size 256 x 256 is obtained. The statistical properties such as contrast, energy, entropy, correlation and local stationary are calculated using Equations (6-10) to describe the image content. The texture features are extracted in the following five steps:
Step 1: The color image is converted to gray scale image and
the image co-occurrence matrix is derived using Equations 4 and 5.
Step 2: The five statistical properties such as contrast, energy,
entropy, correlation and local stationary are calculated using
Equation (6-10) in four orientations such as
0
,45
,90
and135
, so that, totally 20 texture features are obtained.Step 3: Mean and variance of the above five parameters are
the ultimate texture features and are denoted by
)
,
,
,
,
,
,
,
,
,
(
1
2
3
4
5
1
2
3
4
5
T
Step 4:The similarity value between the query image and that
of the database images are calculated using Euclidean distance by Equation (2), the closer the distance, the higher the similarity.
2.2 FRBFN for Image Classification
The features such as color, shape, structure and texture are used to describe the image content from different angles. In image classification, usage of additional features provides more information on the image content than the usage of single feature. Hence, in this paper, the features of image based on color and texture are combined and they are given as input to FRBFN network to classify the dataset. The initial
weight vectors are obtained using an ABC optimization algorithm in order to improve the classification accuracy. The implementation of FRBFN network consists of two phases. In the first phase, the images from training dataset are given as input to the network. The input to the network is low-level descriptors of an image such as color and texture features. During the neural network training, each feature vector Ci is
associated with a target vector Ai whose cardinality is equal to
the number of groups in the training database. The architecture of the FRBFN is composed of an input layer, a Gaussian kernel layer and an output layer. The input layer of this network is a set of n units, which accept the elements of an n-dimensional input feature vector. n elements of the input vector xnis input to the l hidden function, the output of the
hidden function, which is multiplied by the weighting factor wij, is input to the output layer of the network yj(x). For each
RBF unit k, k= 1, 2, ... l, the center is selected using FCMalgorithm for the sample patterns belong to class k. For any class k, the Euclidean distance dk from the cluster center
k
to the farthest sample patternf
k
x
belong to classkis calculated by Equation (2).Only the neurons in the bounded distance of dkin RBF are
activated. The choice of selecting the number of hidden units in a neural network is one of the most challenging tasks, requiring more experimentation. In this paper, a fuzzy c-means clustering approach is adopted to specify the range of
hidden layer neurons in the RBF network. Consider
x
i
be the data patterns in the feature space. Let the number of initial cluster bek
n
/
2
, and test whether a new center should be added based on the performance of the network. The new cluster centerc
k1is added from the remainingsamples
[
c
1,
c
2,
c
3....
c
k]
. The fuzzy membership matrix is then updated with new centers and the process is repeated until the conditionk
n
is satisfied.The algorithm of the FCM is as follows:
Step 1: For the given data set, initialize
k
[
n
/
2
,
n
]
,tolerance
0
, initial cluster centerc
0 , fuzzification constant m, such that1
m
. Ifm
1
, the membership degrees of the data pattern tend to be either 0 or 1 thus approaching the hard means clustering. Ifm
, the membership degrees of the data pattern tend to 1/k, leading to a high level of fuzziness.Step 2: Calculate
u
(
t
)
[
u
ij(
t
)]
, whereu
ij(
t
)
is themembership value of vector
x
ito the cluster centerc
j; withEuclidean distance given in Equation (2) between
x
iandc
j is defined in Equation (11)
k
1 p
1 m
2
pi ji ij
1
t
d
1
t
d
1
t
u
)
(
)
(
)
Step 3: Computethe center
c
(
t
)
using Equation (12), given]
....
,
,
[
c
1c
2c
3c
kc
is the array of clusters for
j,
n1 i
m ji n
1 i
i m ji
j
t
u
x
t
u
t
c
)]
(
[
)]
(
[
)
(
(12)Step 4: Test for stopping condition
c
(
t
)
c
(
t
1
)
.Repeat steps 2-4 until stopping condition is met.
2.2.1 Implementation of FCM based RBFN Network for Image classification
The important aspect of the Radial Basis Function Network is the usage of activation function for computing the output. The major parameters for implementing the RBF network are number of centers in the hidden layer, position of the RBF centers, width of the RBF centers. The choice of number of hidden neurons is determined through the FCM algorithm. The output of the hidden neuron is significant only if the Euclidean distance from the cluster center is within a radius of
i
2
around the cluster center. The width of the RBF centers are set once and the clustering procedure is completed by satisfying the condition that the RBFs should overlap to some extent in order to give a relatively smooth representation of the data. Typically, the width for a given cluster center is set to the average Euclidean distance between the center and the training vectors which belong to that cluster. The application of RBF network consists of two phases, training and testing. The accuracy of RBF network model depends on the proper selection of initial weight vectors for training. The step-by-step procedure involved in the implementation of CIC scheme using FCM based RBF network is elaborated below:Step 1: The dataset is divided into training and testing sets to evaluate the proposed hybrid network performance
Step 2:While stopping condition is false do steps 3 – 10.
Step 3:For each input do steps 4 – 6.
Step 4: Each input unit (xi, i=1,…n) receives input signals to
all units in the layer above.
Step 5: Calculate the radial basis function.
Step 6: Choose the centers for the radial basis functions. The centers are chosen from the set of input vectors using Fuzzy c- means clustering algorithm. Select sufficient number of centers in order to ensure adequate sampling of the input vector space. Initialize suitable values for the range of cluster, initial cluster center, tolerance value for FCM and number of maximum iteration. Compute the membership matrix and update iteratively based on Equation (11). Similarly compute the cluster center using Equation (12).
Step7:The output of im unit is given by
f
i
x
i in the hiddenlayer is calculated using Equation(13).
r
1 j
2 1 2 ji x ji x e
xi
f i /
(13)where, xji is center of the RBF unit for input variables,i is
width of the ith RBF unit and xjiis jth variable of input pattern. Step 8: Initialize the weights in the output layer of the network to some small random value.
Step9: Calculate the output of the neural network by using Equation (14)
H
1
i
wim
f i
x
i
wo
ynet
(14)where, His number of hidden layer nodes (RBF function), ynet
is output value of mth node in output layer for the nth incoming pattern, wim is weight between i
th
RBF unit and the mth output node and wo is biasing term at nth output node.
Step 10:The center model that produces minimum error is selected and the output results are compared based on the testing data.
Along with the input parameters, the test data of the inputs are also provided. While propagating along the hidden layers, the weights are updated and the centers are chosen using random selection method. The network is trained through the algorithm and the error values are computed. If the difference between the target and trained data is below the tolerance value, the algorithm is stopped and the results are displayed, otherwise the process is repeated until the error converges.
2.2.2 Artificial Bee Colony Algorithm based weight optimization for CIC Scheme
In classifying the images by fusing low level features, a key problem is how to assign the initial weights to FRBFN classification network while, it affects directly the performance of the system such as accuracy and computational time. To resolve the problem of obtaining the optimum weight value for FRBFN network and to implement a fast and robust CIC scheme, Artificial Bee Colony (ABC) Algorithm is used. In ABC algorithm, the position of a food source represents a possible solution to the optimization problem and the amount of nectar of a food source corresponds to the quality of the associated solution. The number of employed bees or the onlooker bees is equal to the number of solutions in the population. At the first step, the ABC generates a randomly distributed initial population (P) of SN solutions where SN denotes the size of employed bees or onlooker bees. Each solution xiis a D-dimensional vector
where D is the number of optimization parameters and i=1,2,3,…….SN. After initialization, the population of the positions is subject to repeat Maximum Number of Iterations (MNI) of the search processes of the employed bees, the onlooker bees and the scout bees. An employed bee produces a modification on the position in bee’s memory depending on the local information and tests the amount of nectar. If the amount of nectar of the new one is higher than that of the previous one, the bee memorizes the new position and forgets the old one. Otherwise the bee keeps the position of the previous one in its memory.
The ABC algorithm is shown below:
Step 1: Create a initial population of artificial bees within the
search space xij
Step 2: Evaluate the fitness of the population using sphere
function given in Equation (15)
SN
i
x
i
x
f
1
2
)
(
(15)Step 3: While (stopping criterion not met) where stopping
condition is Maximum Number of Iterations (MNI)
(i) Produce new solutions (food source positions) vij in the
neighborhood of xij for the employed bees using
Equation (16)
)
(
kj
x
ij
x
ij
ij
x
ij
v
(ii) Evaluate the fitness value using Equation (15) and apply the selection process between xij and vij using Equations
(17) and (18).An artificial onlooker bee chooses a food source depending on the new positions, using Equation (17).
))
(
)
(
(
))
(
)
(
(
i i
i
i i
i i
v
f
x
f
if
x
v
f
x
f
if
v
P
(17)
In order to select the better nectar position found by an onlooker, Ob is defined as
n
i
i
P
f
i
P
b
O
arg
min
(
),
1
(18)
where Pi is the best fitness value of the solution i which
is proportional to the nectar amount of the food source in the position i and n is the number of food sources which is equal to the number of employed bees.
(iii) Produce new solutions (new positions) vij for the
onlookers from the solutions xij selected depending on Pi
and evaluate them.
(iv) Determine the abandoned solution (source) xij, if it exists,
and replace it with a new randomly produced solution xij
for the scout bee using Equation (19).
min
[
0
,
1
](
max min)
j j j
j
i
x
rand
x
x
x
(19) where xmin and xmax is the lower and upper limit
respectively of the search scope on each dimension. (v) Memorize the best food source position (solution)
achieved so far
Step 4: End while
The application of this algorithm for assigning fusion weight in multi-feature similarity score fusion method is helped to gain a better image retrieval performance.
3.
EXPERIMENTAL RESULTS AND
PERFORMANCE ANALYSIS
The experimental analysis and simulation determine the efficiency and capability of the work. In this simulation, results for various modules implemented namely, image preprocessing, multi-features extraction and neural network based classification with ABC algorithm are explained to quantify the benefits of image classification based on multi-features. The system is tested on Intel Core 2 Duo (1.66 GHZ, clock speed), 2GB RAM desktop PC using MATLAB R2000b. For testing the validity of the proposed scheme set of 600 images from COREL database library are taken. This dataset was used in various scientific articles for CBIR systems. The database contains 6 image classes with 100 images each. The classes are: Buses, Dinosaurs, Flowers, Elephants, Horses, Food and Mountains. The application of ABC in the CIC scheme creates a significant improvement in the classification accuracy level and reduction in computational time apart from getting consistent results.
3.1 Image Preprocessing and Feature
Extraction
The two features namely color and texture features are derived for all the images. A Feature extracted from an image is generally represented as a vector of finite dimension. The feature vector dimension is one of the most important factors that determine the amount of storage space, the classification accuracy and the computational time [8]. The derivations of color and texture features are elaborated in this section. An image is a spatial representation of an object and represented by a matrix of intensity value. It is sampled at points known
as pixels and represented by color intensity in RGB color model. A basic color image could be described as three layered image with each layer as Red, Green and Blue. All the RGB images in the database are transformed to HSV space model using simple non-linear transformation. The transformed images are used to acquire color histogram, and then quantization is done to reduce the number of bins by taking colors that are very similar to each other and putting them in the same bin. In HSV space the Hue is quantized into 16 bins and is among [0, 15]; Saturation is quantized into 4 bins and is among [0, 3] and Value is quantized into 4 bins and is among [0, 3]. Thus the quantized results using the Equation (1) in section 2 are stored in a text file for further processing. The coded value obtained is an integer between 0 and 255. Texture is another widely used feature in content based image retrieval system. First the color images are converted to gray scale images and a co-occurrence matrix is adopted to extract texture features as it requires less computation and has a faster feature extraction speed. The statistical properties namely contrast, energy, entropy, correlation and local stationary are calculated in all four orientations from co-occurrence matrix. Finally the mean and variance of each parameter are taken as a component of the texture feature. The mean and variance of the statistical properties in all four orientations are tabulated in Table 1 for sample images.
3.2
Standard and Evolutionary based
FRBFN for Image Classification
The individual features cannot express the semantic information of an image sufficiently. Hence, the color and texture features are combined to realize comprehensive image classification process. The structural design of the FRBFN is designed with fifteen input nodes and one output node. The one output node correspond to the label of the derived class and fifteen nodes represents five color features and ten texture features. The number of hidden nodes is determined using fuzzy c-means algorithm and it is found to be six for classification of six classes in the dataset. The FRBFN network was trained with various percentages of training dataset for 10 iterations with network parameters initialized as shown in Table 2. The difference between the target and trained input is computed as the error. The algorithm terminates if the error is less than the tolerance value. More accurate results are produced with proper selection of training data. It should also be ensured that the training data are uniformly distributed, so that the network converges faster with optimal and quality solution. During the training process, the error function is minimized over the given training set by adaptively updating the parameters such as the centers, weights of the centers and hidden layer weights. In this proposed work, the hidden layer weights are obtained from Artificial Bee Colony Algorithm. The training instances are presented to the CIC scheme with initial optimum weights obtained through ABC algorithm. The list of parameters used and its values of ABC optimization algorithm is shown in Table 3.
Table 4 Relationship among the images in the target database and the query image
Classified/ Predicted
Correct Incorrect
Actual
Correct a b
b
a
a
Rate
ecision
Pr
(20)c
a
a
Rate
call
Re
(21)d
c
b
a
d
a
Accuracy
tion
Classifica
(22)The performance is analyzed using Confusion matrix method which contains information about actual and predicted categories of a retrieval system. Table 4 shows the confusion matrix for a CIC scheme with ABC algorithm. The entries in the confusion matrix have the following meaning in the context of our study:
True Positive (a)is the number of correct predictions that an instance is positive.
False Positive (b)is the number of incorrect predictions that an instance is positive,
False Negative (c)is the number of incorrect predictions that an instance is negative, and
True Negative (d)is the number of correct predictions that an instance is negative
The relationship among the images is shown in Table 4. The Precision Rate, Recall rate, Classification Accuracy and Error rate are calculated using the Equations (20-22) for various training and testing samples. The Classification Accuracy is calculated by varying the spread of the RBF function ranging from 0.25 to 0.9 in order to adjust the cluster centers. The accuracy of the standard methods such as RBFN, FRBFN and hybrid FRBFN with ABC algorithm for varying spread value. Figure 2 shows that the variation in accuracy for spread value
)
[image:7.595.314.543.72.221.2](
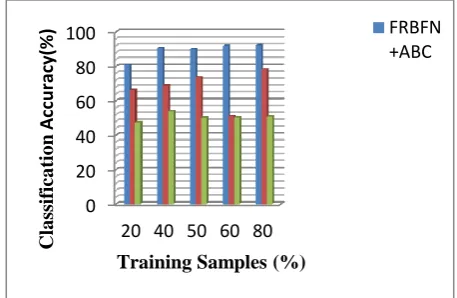
is equal to 0.25 for various training samples. The FRBFN network with ABC achieved an increase of 39.5% and 29% in classification accuracy when compared with standard RBFN and FRBFN respectively for 60% of training samples.Figure 2 Comparison of Classification Accuracy for
25
.
0
Figure 3 Comparison of Classification Accuracy for
0
.
9
Similarly, Figure 3 shows that when
0
.
9
the FRBFN with ABC yields an increase of 45% and 12.5% in comparison with RBFN and FRBFN respectively. Fig. 3 shows the classification accuracy of FRBFN network with ABC for varying spread factor values.The inference from scatter plot in Figure 4 is that the hybrid FRBFN with ABC achieves 11.65% increase in classification accuracy at
0
.
9
when compared with the spread value25
.
0
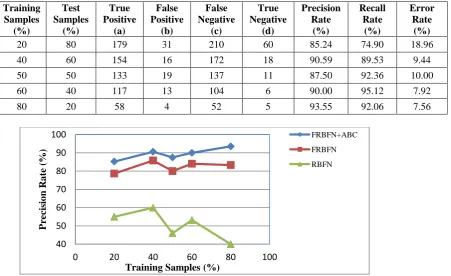
. Hence the optimum spread value which produces maximum accuracy is fixed as 0.9.The true positive, true negative, false positive and false negative values of FRBFN without and with ABC optimization algorithm are tabulated in Tables 5 and 6 respectively. These tables show the precision rate, recall rate and error rate for various training and testing samples. The simulation results show that the proposed ABC based FRBFN classifier yields an increase of 6.6 % in precision rate, 14. 5% in recall rate and reduction of 83.75% in error rate when compared to standard FRBFN classifier for 60% of training samples. The scatter plot in Figure 5 shows that the precision rate of standard RBFN, FRBFN and hybrid FRBFN with ABC for various training samples using multi-features of the image. It is clear from Figure 5 that the highest precision rate is obtained from FRBFN with ABC when compared to standard network such as RBFN, FRBFN.40 60 80
20 40 50 60 80
C
lass
if
icat
ion
A
cc
uracy(
%
)
Training Samples (%)
FRBFN+ABC FRBFN RBFN
0 20 40 60 80 100
20 40 50 60 80
Class
ifica
tio
n
A
cc
u
racy
(%
)
Training Samples (%)
[image:7.595.54.262.77.172.2] [image:7.595.52.281.492.600.2]Figure 4 Comparison of Accuracy of ABC based FRBFN with Multi-features
Table 5 Performance of FRBFN without ABC algorithm with Multi-features for
0
.
9
Training Samples
(%)
Test Samples
(%)
True Positive
(a)
False Positive
(b)
False Negative
(c)
True Negative
(d)
Precision Rate (%)
Recall Rate
(%)
Error Rate (%)
20 80 140 38 159 113 78.65 46.82 33.56
40 60 133 22 115 90 85.81 53.63 31.11
50 50 116 29 105 50 80.00 52.49 26.33
60 40 100 19 23 98 84.03 81.30 48.75
[image:8.595.70.522.436.712.2]80 20 50 10 44 16 83.33 53.19 21.67
Table 6 Performance of FRBFN with ABC algorithm with multi-features for
0
.
9
Training Samples
(%)
Test Samples
(%)
True Positive
(a)
False Positive
(b)
False Negative
(c)
True Negative
(d)
Precision Rate
(%)
Recall Rate
(%)
Error Rate (%)
20 80 179 31 210 60 85.24 74.90 18.96
40 60 154 16 172 18 90.59 89.53 9.44
50 50 133 19 137 11 87.50 92.36 10.00
60 40 117 13 104 6 90.00 95.12 7.92
80 20 58 4 52 5 93.55 92.06 7.56
Figure 5 Comparison of Precision of standard and proposed networks with Multi-features
40 50 60 70 80 90 100
0 20 40 60 80 100
C
lass
if
icat
ion
A
cc
uracy(
%
)
Training Samples (%)
Sigma = 0.9 Sigma =0.75 Sigma = 0.5
40 50 60 70 80 90 100
0 20 40 60 80 100
P
re
cisi
o
n
Ra
te
(%)
Training Samples (%)
Table 7 Comparison of Classification Accuracy and Computational Time of FRBFN with and without ABC Algorithm
T
ra
ini
ng
Sa
m
ples
T
esting
Sa
m
ples
Fuzzy RBFN Network with Random Weights Multi-features with ABC
based Fuzzy RBFN Color Feature Texture Feature Multi-features
Cla
ss
if
ica
tio
n
Acc
ura
cy
T
ra
ini
ng
T
ime
T
esting
T
ime
Cla
ss
if
ica
tio
n
Acc
ura
cy
T
ra
ini
ng
T
ime
T
esting
T
ime
Cla
ss
if
ica
tio
n
Acc
ura
cy
T
ra
ini
ng
T
ime
T
esting
T
ime
Cla
ss
if
ica
tio
n
Acc
ura
cy
T
ra
ini
ng
T
ime
T
esting
T
ime
(%) (%) (%) (s) (s) (%) (s) (s) (%) (s) (s) (%) (s) (s)
20 80 52.29 0.444 0.073 52.50 0.067 0.061 66.44 0.534 0.118 81.04 0.46 0.078
40 60 51.67 0.641 0.076 52.50 0.058 0.045 68.89 0.656 0.063 90.56 0.664 0.064
50 50 53.33 0.582 0.049 51.33 0.106 0.044 73.67 0.786 0.066 90.00 0.824 0.057
60 40 54.17 0.779 0.043 45.00 0.047 0.030 51.25 0.611 0.046 92.08 0.989 0.046
[image:9.595.47.529.349.680.2]80 20 50.83 0.498 0.017 52.50 0.052 0.015 78.33 0.856 0.018 92.44 0.996 0.204
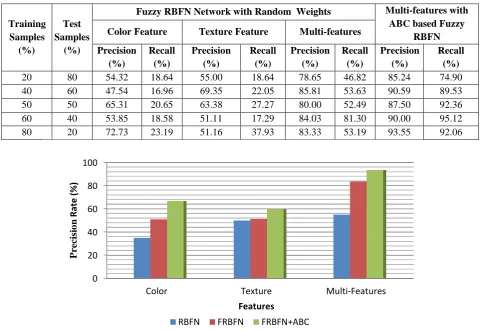
Table 8 Precision and Recall rate of Fuzzy RBFN network with and without ABC
Training Samples
(%)
Test Samples
(%)
Fuzzy RBFN Network with Random Weights Multi-features with ABC based Fuzzy
RBFN Color Feature Texture Feature Multi-features
Precision (%)
Recall (%)
Precision (%)
Recall (%)
Precision (%)
Recall (%)
Precision (%)
Recall (%)
20 80 54.32 18.64 55.00 18.64 78.65 46.82 85.24 74.90
40 60 47.54 16.96 69.35 22.05 85.81 53.63 90.59 89.53
50 50 65.31 20.65 63.38 27.27 80.00 52.49 87.50 92.36
60 40 53.85 18.58 51.11 17.29 84.03 81.30 90.00 95.12
80 20 72.73 23.19 51.16 37.93 83.33 53.19 93.55 92.06
Figure 6 Comparison of Precision of standard and proposed networks
For hybrid FRBFN network there is an increase of 6.6% and 40.9% in precision rate when compared to FRBFN and RBFN respectively for 60% of training images from database. Table
7 shows the comparison results of FRBFN with and without ABC optimization algorithm using color feature, texture feature and multi-features classification. The simulation
0 20 40 60 80 100
Color Texture Multi-Features
P
re
cisi
o
n
R
ate
(
%
)
Features
results show the classification accuracy, training time and testing time of standard FRBFN and hybrid FRBFN with ABC algorithm for various training and testing samples.
The simulation result shows that the proposed ABC based FRBFN classifier yields an increase of 44.28% in classification accuracy and reduction of 38.2% in training time when compared to standard FRBFN classifier for 60% of training samples. In addition, for the proposed model there is an increase of 41.2%, 51.2% and 44.28% in classification accuracy when compared to standard FRBFN with color, texture and multi-features respectively. The comparison results of the standard FRBFN and hybrid proposed model using color, texture and multi-features classification scheme achieved a high precision and recall rate for all pairs of training and testing samples. From Table 8, it is inferred that the precision and recall rate of standard FRBFN are less compared to hybrid FRBFN with ABC algorithm for various training and testing samples. The simulation result shows that the proposed ABC based FRBFN classifier yields an increase of 6.6% in precision and increase of 14.5% in recall rate when compared to standard FRBFN classifier for 60% of training samples.
Figure 6 shows the overall performance of image classification schemes i.e. Color, Texture and combined features based classification with RBFN, FRBFN and hybrid FRBFN for various image classes. The proposed method provides the precision rate for color feature, texture feature and multi-features to be higher by a factor of 35.7%, 49.2% and 34% when compared with RBFN method. In addition, the precision rate of proposed method with color feature, texture feature and multi-features is higher by a factor of 40.2%, 39.1% and 10% when compared with FRBFN method.
4. CONCLUSION AND FUTURE WORK
Image Data Mining has the potential to provide significant information about the images and extracts the implicit knowledge stored in the image to the users. The content of an image can be expressed in terms of different features such as color, shape and texture. These low-level features are extracted directly from digital representation of the image and do not necessarily match the human perception of visual semantics. In the proposed scheme, combined color and texture features are considered as feature vectors of an image for FRBFN network. Hidden layer weight vectors are initialized using the optimization technique, Artificial Bee Colony Algorithm, which makes the image classification process a unique one. The experimental results demonstrate that the combined color and texture features are useful in retrieving similar images from the dataset with minimum computational time. As per analysis, the proposed scheme achieves high precision rate of 93.55% and high recall rate of 95.12% for various percentages of dataset with simple and complex images. This model can be enhanced in future, by including more low-level features such as shape and spatial location features. In this paper, while evaluating the fitness of an individual, we considered only the occurrence frequencies of an image in retrieval result and not the location of it. So, this factor should be taken into account when evaluating the fitness of an individual in future work.5. REFERENCES
[1] J. Yue, et. al., “Content based image retrieval using color and texture fused features” Mathematical and Computer Modelling, 2010, Elsevier Ltd.
(DOI: 10.1016/j.mcm.2010.11.044)
[2] R. Datta, D. Joshi, J. Li, J.Z. Wang, Image Retrieval: ideas, influences and trends of the new age, ACM Computing Surveys, 40 (2), 2008,1-60.
[3] P. Muneesawang, L. Guan, “An interactive approach for CBIR using a network of radial basis functions”, IEEE Transactions on Multimedia, 6,2004, 703-716.
[4] DervisKaraboga, BahriyeAkay, “A Comparative study of Artificial Bee Colony Algorithm”, Applied Mathematics and Computation, 214, 2009, 108-132.
[5] B.G. Prasad, K.K. Biswas, S.K. Gupta, “ Region based image retrieval using integrated color, shape and location index”, Computer vision and Image Understanding, vol 94, pp 193-233,2004.
[6] Young Deok Chun, Nam Chul Kim, Ick Hoon Jang, “ Content-Based Image Retrieval using Multi-resolution color and texture features”, IEEE Transaction on Multimedia, vol 10, pp. 1073-1084,2008.
[7] Tai X.Y, Wang L.D., “Medical Image Retrieval Based on Color-Texture algorithm and GTI model”, The second International Conference on Image Processing Bioinformatics and Biomedical Engineering, (ICBBE2008), 2008.
[8] Y.D. Chun, S.Y.Seo and N.C. Kim, “Image retrieval using BDIP and BVLC moments”, IEEE Transaction on Circuits System Video Technology, vol 13, pp. 951-957, Sep. 2003.
[9] W.Niblack, R.Barber, W.Equitz, et. al., “The QBIC project: querying images by content using color, texture and shape, SPIE 1908, San Jose, CA, 1993,pp.173-187.
[10] A. Pentland, R.W. Picard, S. Scarloff, “Photbook: tools for content based manipulation of image databases, SPIE 2185, San Jose, CA, 1994, pp 34-47.
[11] S. Mehrotra, Y. Rui, M. Ortega, et al. “Supporting content based queries over images in MARS”, Proceedings of IEEE International conference on Multimedia Computing and Systems ’97, Ottawa,Ontario, Canada, 1997, pp 632-633.
[12] J.R. Bach, C. Fuller, A. Gupta, et al., “Virage image search engine: an Open framework for Image Management”, SPIE 2670, 23, San Jose, CA, 1996, pp.76-87.
[13] J.R. Smith, “Integrated spatial and feature image systems: Retrieval, analysis and compression”, Ph.D. Dissertation, Columbia University, New York City,1997.
[14] JZ.Wang, J.ULi, G. Wiederhold, SIMPLIcity: Semantic- Sensitive Integrated Matching for Picture Libraries”, IEEE Transactions on Pattern Analysis and Machine Intelligence, 23(9),2001, 947-963.
[15] Y. Rui and T.S. Huang, “Image Retrieval: Current Techniques, promising directions and open issues”, Journal of Visual Communications Image Represent, vol 10, pp. 39-62, Oct 1999.
[16] R.M. Haralick, K. Shanmugam, I. Dinstein, “Texture features for image Classification”, IEEE Transactions System Man Cybernetics, Vol. SMC-8, pp.610-621, Nov 1973.
frames”, IEEE Transactions on Multimedia, vol 2, pp. 676-686, Oct 2004.
[18] H. Permuter, J. Francos and I.H. Jermyn, “ Gaussian mixture models of texture and color for image database retrieval”, Proceedings of IEEE International Conference Acoustics, Speech, Signal Processing, Hong Kong, April 2003, vol 3, pp. 569-572.
[19] Y.Gong, H. Zhang, H.Chuant and M.Skauuchi, “An image database system with contents capturing and fast image indexing abilities”, Proceedings of IEEE International Conferences on Multimedia Computing and Systems, Boston, Massachusetts, USA, May 1994, pp 121-130.
[20] ShahroozNematipour, JamshidShanbehzadeh, Reza AskariMoghadam, “Relevance Feedback Optimization in
Content Based Image Retrieval via Enhanced Radial Basis Function Network”, Proceedings of the International Multi-Conference of Engineers and Computer Science (IMECS 2011) March 16-18, 2011, Hong Kong.
[21] Zhang, Ruofei, Zhang, Zhongfei, “BALAS: Empirical Bayesian learning in the relevance feedback for image retrieval”, Image and Vision Computing, Elsevier, 2005, pp. 39-62.