Improving Edge based Color Constancy using Grid
based Sampling
Buta Singh
M Tech. (Final Year) Yadavindra College of EngineeringTalwandi Sabo, Punjab, India
Ashok Kumar Bathla
Assistant Professor Yadavindra College of EngineeringTalwandi Sabo, Punjab, India
ABSTRACT
Color constancy refers to stable psychological tendency in perception even the lighting circumstances changed and it plays an important role in many computer vision applications. Color constancy is the ability to measure the impact of light onto a digital image independent of the color of the light source. Many color constancy algorithms for estimating the color of the light source, are developed so far but all the existing algorithm are based on single light source i.e. they consider that an image is affected by only one light source or single uniform illumination, which is not the case every time, because an image may be affected with more than one illuminations. The illusion of single light source is now violated by multiple sources of light. In this paper, we will discuss a new method which considers that an image is affected by multiple sources of light, without any clue about the color of the light sources. Grid based sampling technique along with Grey Edge algorithm is used to estimate the color of multiple light sources. The use of Bilateral Filter after applying color correction is giving most promising results and it has provided the consistency of this algorithm over different types of images taken from different datasets. Experimental and visual results show that the proposed method achieves much better results than existing methods for color constancy. The qualitative results are tested over some well known parameters i.e. Median Angular Error (MAE), Peak Signal to Noise Ratio (PSNR) etc.
Keywords
Color Constancy, Illumination, Computer Vision, Median Angular Error (MAE) and Peak Signal to Noise Ratio (PSNR).
1.
INTRODUCTION
Color constancy is the ability to recognize colors of objects independent of any clue about the color of the light source [1] [8]. Color can be an important cue for many computer vision applications like human computer interaction, color feature extraction and color appearance models. Changes in illuminations cause the measurement of object colors to be biased towards the color of the light source. Human vision system has the ability to recognize the colors of the light source to some extent but perceive the same color of an object despite large differences in illumination. The color of a light source has a significant influence on object colors in the scene. Therefore the same object, taken by the same camera but under different illuminations, may vary in its measured color values. This color variation may introduce undesirable effects in digital images. Moreover it may negatively affect the performance of computer vision methods for different applications such as object recognition, tracking and surveillance. Hence, color constancy is needed for these types of applications. The aim of color constancy is to estimate the effect of the illumination color, either by computing invariant
features or by transforming the input image such that the effects of the color of the light source are removed.
Various computational color constancy algorithms have been developed for recent overviews. The criteria for color constancy using various computational models focus on following facts:-
- The requirement of training data set. - The accuracy of the estimation.
- The effectiveness of the computational model used. - The computational run time of the method. - Transparency of the approach.
- Number of parametric proofs [6].
2.
RELATED WORK
One of the first color constancy methods is based on the Retinex theory by Land and McCann [20]. Examples of algorithms which are derived from this theory include the White-Patch algorithm, the Grey-World algorithm and more recently, the Shades-of-Gray algorithm and the Grey-Edge algorithm.
One algorithm that uses information in learning phase to obtain knowledge is the gamut mapping algorithm by Forsyth [19]. This algorithm is based on the assumption that in real-world images, for a given illumination, only a limited number of colors can be observed. Using this assumption, the illumination can be estimated by comparing the distribution of colors in the current image to a pre learned distribution of colors (called the canonical gamut).
The Grey World algorithm presented by Gijsenij et al. [14] estimates the color of image under unknown light source by comparing the average value of pixels. Grevers et al. [17] also presented that Grey World algorithm is based on the fact that average reflectance in a scene is achromatic.
The illumination in white patch or Max RGB is processed by detecting the maximum of the responses in each channel so it works in a very similar way to that of the grey world algorithm and we only simply replace the mean value by the maximum value of the sensor responses in each channel as presented in [2].
conditions and different illuminations. This method is further extended to derive color constancy based on the various Minkowski norms and higher order of image derivative i.e. Grey Edge-1 (first Order grey edge) and Grey Edge-2 (second order grey edge) as explained in [2][14].
Gamut Mapping algorithm explained by Weijer et al. in[6]. Gamut Mapping algorithm, a more complex and more accurate algorithm, is based on the assumption that in real-world images, for a given illumination one observes only a limited number of colors. These methods deal with an image as a bag of pixels and the spatial relation between pixels is not considered.
After evaluating the various existing algorithms (as explained above) it was observed that no single algorithm is universal and consistent in different types of data set images. It is not objective to say which algorithm shows overwhelming advantage because every algorithm has its own definition and purpose. In this part, we try to find out a major problem in these algorithms i.e. all the algorithms are conducted under a single light condition.
In this paper, a new methodology is presented [24] that enables color constancy under multiple light sources. The methodology is designed according to the following criteria: 1) it should be able to deal with scenes containing multiple light sources; 2) it should work on a single image; 3) no human intervention is required; and 4) no prior knowledge or restrictions on the spectral distributions of the light sources is required. Although the proposed framework is designed to handle multiple light sources, the focus in this paper is on scenes captured under one or two distinct light sources. Furthermore, not only images recorded under multiple light sources but also images that are recorded under only one light source should be properly processed. Hence, the improvement on multiple-light-source scenes should not be obtained at the expense of a decreased performance on single light-source scenes.
3.
COLOR CONSTANCY
Color constancy can be achieved by estimating the color of the light source, followed by a transformation of the original image values using the illumination estimation. The image values f for a Lambertian surface depends on the color of the light source e(λ), the surface reflectance S(x,λ) and the camera sensitivity function C(λ) [21].
λ)dλ
)S(x,
C(
)
e(
(x)
F
w
... (1)Where w is the visible spectrum, λ is the wavelength of the light and x is the spatial coordinate. Since, both e(λ)and C(λ) are in general unknown. This is an under constrained problem. Therefore, color constancy is needed to solve this problem using further assumptions [21].
3.1.
Illumination Estimation under One
Light Source
Many color constancy algorithms are developed so far during research study in color constancy but they all are based on estimation of single uniform source of light onto a digital image. Algorithm like white patch algorithm, Grey World algorithm and gamut mapping based algorithm are based on the assumption of single uniform source of light. Recent research comes into existence regarding estimation multiple sources of light as discussed in [21].
3.2.
Illumination Estimation under Multiple
Light Sources
The majority of color constancy algorithm is based on one light source i.e. they are based on the assumption of spectrally uniform lighting. However, in real world, an image may be affected by different multiple sources of light. The Grey edge algorithm and Physics based algorithms are based on estimation of color of multiple sources of light. Hence, much better results can be produced by using grid based sampling along with grey edge and bilateral filter for multiple sources of light as a color constancy mechanism.
3.3.
Image Correction Model:
The main goal of color constancy algorithms is to estimate the impact of the color from different light sources onto a digital image. After light estimation, image correction mechanism is applied to obtain standard output image. Diagonal Model called Von Kries Model [6] is used to correct the image as discussed in recent research study. After the color of the light source is estimated, the input image is transformed, taken under an unknown light source, into colors as if they appear under a canonical light source. Usually, this is done using the diagonal model or Von Kries model. The diagonal model for color correction that is used, is given by [6].
u t u
t
D
f
f
, ... (2)Where, fu is the image taken under an unknown light source, ft
is the same image transformed so it appears as if it was taken under the canonical illumination, and Du,t is a diagonal matrix
which maps colors that are taken under an unknown light source u to their corresponding colors under the canonical illumination c:
u u u c c cB
G
R
d
d
d
B
G
R
3
0
0
0
2
0
0
0
1
... (3)Even though this model is merely an approximation of illumination change and might not be accurately able to model photometric changes due to disturbing effects like highlights and inter reflections, it is widely accepted as color correction model and underpins many color constancy algorithms [21].
4.
PROPOSED FRAMEWORK
Fig1. Proposed Algorithm Flow Chart
4.1.
Input Image
The input image taken in this dissertation is a color image i.e. an image composed of three primary colors – R (red), G (green), B (blue). Each color uses maximum of 255 values having different intensities i.e. 255 for red color, 255 for green color and 255 for blue color. Color constancy can be achieved by estimating the color of the light source, followed by a transformation of the original image values using the illumination estimation.
4.2.
Grid Based Sampling
The first step is sampling of image patches. Sampling of image patches is to sample P patches from the image. For each patch, estimation is computed of the light source valid for that patch. It is assumed that the color of the light source is uniform over each patch, which is a reasonable assumption in practice. Therefore, the patch size should be limited but of sufficient size to extract enough image properties to accurately estimate the light source. Grid-based sampling has an advantage that the patches can contain varied amount of information. Hence, grid based sampling is widely accepted, since it covers the entire image by splitting the image into different patches, such that, combinations of all these patches results in the formation of an entire image [24].
4.3.
Illumination Estimation and
Combination
Patch-based illumination estimation is done in the second step. As the illumination for each patch is assumed to be spectrally uniform, traditional color constancy methods are applied on every patch to estimate the local illumination. Grey Edge algorithm for estimating the color along with grid based sampling is very efficient approach. So, we will also use grey edge algorithm for estimating the color of light. Higher order grey edge algorithm is beneficial for improving edge details. Since our main focus is to improve the edge based color constancy, hence Grey edge algorithm works well for this requirement. In the gray-edge assumption, the light source color can be computed from the average color derivative in the image given by [14].
)
4
...(
)
(
Ke
dx
dx
x
f
Where │fx(x) │ = (│Rx(x), │Gx(x)│,│Bx(x)│)T. The gray
edge algorithm originates from the observation that the color derivative distribution of images forms a relatively regular, ellipsoid-like shape, of which the long axis coincides with the light source color as given in [14].
The gray-edge algorithm can be adapted to incorporate the Minkowski norm using the equation [14].
, , /
1
n n
x
(x)
f
npp p
ke
dx
…. (5)Color constancy based on this equation assumes that the pth
Minkowski norm of the derivative of the reflectance in a scene is achromatic. This framework produces different estimations for the illumination color based on three variables i.e. n, p, σ [14].
1) The order n of the image structure is the parameter determining if the method is a gray-world or a gray-edge algorithm. The gray-world methods are based on the RGB values, whereas the gray-edge methods are based on the spatial derivatives of order. In this dissertation, we will investigate higher order-based color constancy up to order 2. 2) The Minkowski norm p which determines the relative weights of the multiple measurements from which the final illuminant color is estimated. A high Minkowski norm emphasizes larger measurements whereas a low Minkowski norm equally distributes weights among the measurements. 3) The scale of the local measurements as denoted by σ. For first- or higher order estimation, this local scale is combined with the differentiation operation computed with the Gaussian derivative. For zero-order gray-world methods, this local scale is imposed by a Gaussian smoothing operation.
Grid Based Sampling
Apply Bilateral Filter
Color Correction
Back Projection
Illumination Estimation and
Combination
Input Image
TABLE1.Overview of the different illumination estimations methods together with their hypothesis [14]
Name of Algorithm
Symbol Hypothesis
Grey -World e0,1,0 The average reflectance in a scene is achromatic
White Patch e0,∞,0 The maximum reflectance in a scene is achromatic
Grey Edge-1 e1,p,σ The pth minkowski norm of the image derivative in a scene is achromatic
Grey Edge-2 e2,p,σ The pth minkowski norm of the second order image derivative in a scene is achromatic
After, illumination estimation at every patch, combination is done by using any clustering algorithm. This is an optional step, since we can process each patch individually for next step.
4.4.
Back Projection
After the different estimates are grouped together, the result can be back-projected onto the original image to identify the locations in the image that are illuminated by each of the estimated light sources. This results in an illumination classification, where every pixel is assigned to one of the estimated light sources. After back-projection, a pixel wise illumination estimate is obtained [24].
4.5.
Color Correction
After using the pixel wise estimates, the output image is constructed. Transforming the input image so that it appears to be taken under a white light source is an instantiation of chromatic adaptation. The diagonal model for color correction used, is given by [6] [14]. The color correction process is already explained in section 2.3.
4.6.
Applying Bilateral Filter
The use of bilateral filter [22] gains a widespread acceptance during our research study regarding color constancy. Bilateral Filter is beneficial in color constancy because whenever an image is modified or altered from its originality, then definitely there occurs a noise into the image. Besides removing the noise from an image, bilateral filter has also gained popularity in sharpening the edges of an image which is our main point of research i.e. to present improved edge based color constancy. Bilateral filter provides much better results with second order grey edge algorithm used along with grid based sampling and is consistent over large sets of real world and natural images. In case of bilateral filter, every pixel of the image is replaced by the weighted sum of its neighbours. The Weights depend on two parameters [22] – 1)
Proximity of the neighbours to the current pixel (Closeness function) and 2) Similarity of the neighbours to the neighbours to the current pixel (Similarity function). The closer and the similar pixels are given higher weights. These two parameters can be combined to describe the bilateral filter.
4.7.
Output Color Corrected Image
Finally, the results of bilateral filter produce the last step of proposed algorithm i.e. output image as a color corrected image. Color corrected image produced results in an image which is free from any light impact. Multiple light effects are removed by proposed algorithm and final output image is obtained. Since, the output image provides qualitative result. Hence, output image is tested on some well known parameters in order to obtain the quantitative result as discussed in next section.
5.
EXPERIMENTS
This section presents the experimental validation of the proposed method. First, the influence of several parameters on the performance of the proposed method is studied. Then the proposed method is applied on various images taken from different data sets. In this paper, we show only various data set images i.e. data set of real images, SFU grey ball set image and natural images.
(A) Performance Measurement
Many performance measures are used in this paper. All these parameters are discussed below. But, our focus is on two main parameters i.e. Median Angular Error (MAE) and Peak Signal to Noise Ratio (PSNR).
1.
Median Angular Error (MAE)
For all images in the data set, the correct color of the light source is known a priori. To measure how close the estimated illumination resembles the true color of the light source, the angular error is used. Given a pixel in an image, Lt(x) is the ground truth of the light source illuminating it, whereas Le(x) is the corresponding estimation; then, the angular error is [21].
)
(
),
(
cos
)
(
1x
L
x
L
x
t e
... (6)Where, the hat indicates the normalized vector. As scenes are illuminated by varying illuminations, the angular error is computed pixel by pixel throughout the image. Then, the average angular error across the scene is considered as the measurement. To measure the performance of an algorithm on a data set, the median angular error is reported as summarizing statistic, as this is considered to be the most appropriate measure.
2.
Mean Square Error (MSE)
MSE measures the square of the error. The MSE represents the cumulative squared error between the output and the original image. The MSE can be evaluated using [23] the following equation:
)
7
(
...
*
)
,
(
)
,
(
2 , 2 1N
M
n
m
I
n
m
I
MSE
MN
In the previous equation, M and N are the number of rows and columns in the input images, respectively. The lower the value of MSE, lower will be the error.
3.
Peak Signal-to-Noise Ratio (PSNR)
Another parameter is to maximize the quality of an image is Peak Signal to Noise Ratio (PSNR). The PSNR block computes the peak signal-to-noise ratio, in decibels, between two images. This ratio is often used as a quality measurement between the original and an output image. The higher PSNR value better will be the quality of the reconstructed image. The block computes the PSNR using the following equation [23]:
MSE
R
PSNR
2 10
log
10
... (8)R is the maximum fluctuation in the input image data type. For example, if the input image has a double-precision floating-point data type, then R is 1. If it has an 8-bit unsigned integer data type, R is 255, etc.
4.
Normalized Correlation (NC)
A measure of the strength of linear association between two variables. Correlation will always between -1.0 and +1.0. If the correlation is positive, we have a positive relationship. If it is negative, the relationship is negative. If the value is zero, then there will be a perfect relationship between two images or variables. Normalized correlation can calculated as given below.
M j
N k
k j M
j N
k jk jk
x x
x
NK
1 1 , 2 1 1 , ,
' .
... (9)
5.
Structural Content (SC)
The loss in perceived image quality is often determined by the nature and level of an artifact along with the context in which it appears [23].
Mj N k
k j M
j N k jk
x
x
SC
1 1
2 ,
1 1 ,
'
2
... (10)
6.
Average Difference (AD)
The difference in visual properties that makes an object (or its representation in an image) distinguishable from other objects and the background. Average difference can be calculated as [23],
x
x
MN
AD
M
j N
k
k j k j
1 1
,
,
'
... (11)(B) Real Images
Real images can be obtained from a digital camera or can be taken from real world data set. Our method is tested on both types of images. All images are of different sizes and the algorithm is tested on color images. Some real images processed by proposed algorithm are given below.
(a) Apples Image
Fig2 (a) Real image (Apples image) affected by two different light sources
Fig2 (b) Output (Apples image) color corrected image
Fig3 (a) Input image (Author’s image) and (b)
Output color corrected image
(c) Dog Image
Fig4 (a) Input Image (Dog image) and (b) Output color corrected image
(d) SFU Ball Set Image
Fig5 (a) Input Image (SFU Ball Set image) and (b) Output color corrected image
(e) Natural Image
Fig6 (a) Input Image (Natural image) and (b) Output color corrected image
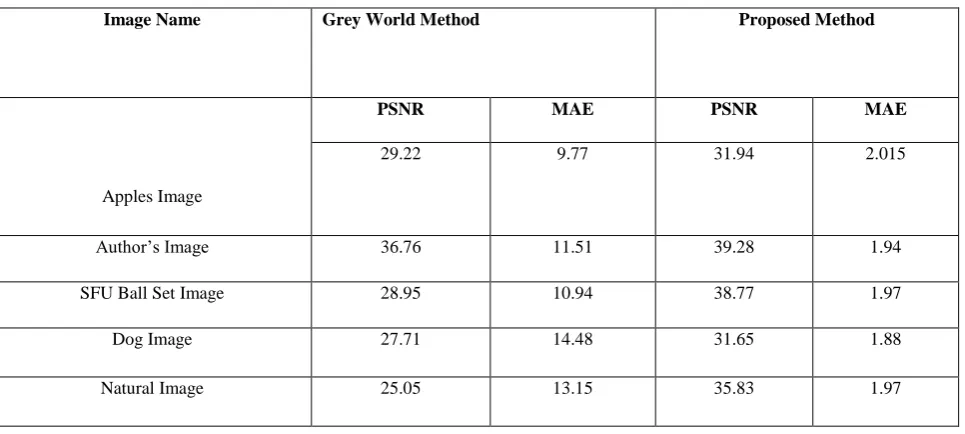
Image Name Grey World Method Proposed Method
Apples Image
PSNR MAE PSNR MAE
29.22 9.77 31.94 2.015
Author’s Image 36.76 11.51 39.28 1.94
SFU Ball Set Image 28.95 10.94 38.77 1.97
Dog Image 27.71 14.48 31.65 1.88
[image:7.595.52.535.511.728.2]Natural Image 25.05 13.15 35.83 1.97
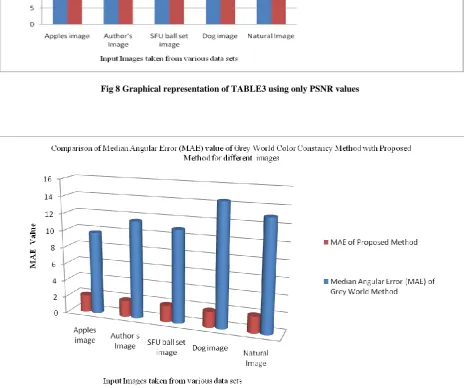
Fig 7 Graphical representation of performance analysis of real image (author’s image) using various parameters
6.
DISCUSSION AND CONCLUSION
Existing algorithms include the grey world and white patch algorithms provide us advantages of simple implementation and fast execution. But these all are based on the fact of single uniform light source. Therefore, in this paper, the grid based sampling criteria is transparent in improving the results of edge based color constancy based on the concept of multiple light sources. Our research study is an extension in various existing algorithms so that accuracy can be improved. Grid based sampling with existing grey edge algorithms provides much better results. The proposed framework for edge based color constancy leads us to the following main conclusions.
Use of grid based sampling technique provides much better estimation of color of light source.
Small size of grid results in small patches of an image and provides much better results of estimation of color of light.
All the existing methods consider an image is affected by only single uniform light source but proposed framework works on multiple sources of light, because a grid has the capability to detect multiple sources of light.
Proposed method is based on low level features of an image and is based on the fact that light source is unknown and doesn't require any training data.
Use of Bilateral filter along with higher order grey edge algorithm provides much better results like lowering the value median angular error (MAE)
Qualitative results are verified on various types of parameters like- median angular error (MAE), peak signal to noise ratio (PSNR), normalized correlation (NC) etc. Quantitative and Qualitative results show that the proposed framework is much better than existing methods.
7.
REFERENCES
[1] Martin Savc, Damjan Zazula, Bozidar Potocnik, “A Novel Color-Constancy Algorithm: A Mixture of Existing Algorithms” (Journal of the Laser and Health Academy Vol. 2012, No. 1).
[2] Arjan Gijsenij and Theo Gevers “Color Constancy Using Natural Image Statistics and Scene Semantics” (IEEE Transactions on Pattern Analysis and Machine Intelligence, Vol. 33, No. 4, April 2011).
[3] Ayan Chakrabarti, Keigo Hirakawa, and Todd Zickler “Color Constancy with Spatio-Spectral Statistics” (IEEE Transactions on Pattern Analysis and Machine Intelligence, 2011).
[4] David H. Foster “Color Constancy” (Vision Research, 51, 674-700 (2011)).
[5] Michael Bleier, Christian Riess, Shida Beigpour, Eva Eibenberger, Elli Angelopoulou, Tobias Troger, Andr´e Kaup “Color Constancy and Non-Uniform Illumination: Can Existing Algorithms Work?”,(IEEE Workshop on Color and Photometry in Computer Vision 2011). [6] Arjan Gijsenij, Theo Gevers, Joost van de Weijer
“Computational Color Constancy: Survey and Experiments”(IEEE Transactions on Image Processing, Vol. X, No. X, Month 2010).
[7] Arjan Gijsenij • Theo Gevers • Joost van deWeijer “Generalized Gamut Mapping using Image Derivative Structures for Color Constancy” (Springer, Int J Comput .Vis (2010)).
[8] Anustup Choudhury and Ge´rard Medioni “Color Constancy Using Standard Deviation of Color Channels” (IEEE International Conference on Pattern Recognition 2010).
[9] S. Bianco,G.Ciocca,C.Cusano∗, R.Schettini “Automatic color constancy algorithm selection and combination” (Elsevier, Pattern Recognition 43 (2010)).
[10]Javier Vazquez, C. Alejandro Párraga, Maria Vanrell and Ramon Baldrich, “Color Constancy Algorithms: Psychophysical Evaluation on a New Dataset” (Society for Imaging Science and Technology May-June 2009). [11]Marc Ebner “Color Constancy Based on Local Space
Average Color” (Machine Vision and Applications Vol. 11, No. 5, pp. 283-301, July, 2009).
[12]Arjan Gijsenij, Theo Gevers, and Marcel P. Lucassen “Perceptual Analysis of Distance Measures for Color Constancy Algorithms” (Optical Society of America, Vol. 26, No. 10/October 2009).
[13]Joost van de Weijer, Cordelia Schmid, Jakob Verbeek, Diane Larlus. “Learning Color Names for Real- World Applications” (IEEE TRANSACTIONS ON IMAGE PROCESSING, VOL. XX, NO. Y,(2009)).
[14]Joost van de Weijer, Theo Gevers, and Arjan Gijsenij,“Edge-Based Color Constancy” (IEEE TRANSACTIONS ON IMAGE PROCESSING, VOL. 16, NO. 9, SEPTEMBER 2007).
[15]Vivek Agarwal, Besma R. Abidi, Andreas Koschan Mongi A. Abidi “An Overview of Color Constancy Algorithms” (Journal of Pattern Recognition Research 1 (2006).
[16]G.Finlayson and Elisabetta Trezzi, "Shades of gray and colour constancy." (2004).
[17]J. van de Weijer Th. Gevers, “Color Constancy based on the Grey-Edge Hypothesis” (IEEE 2005).
[18]Kobus Barnard, Vlad Cardei, and Brian Funt “A Comparison of Computational Color Constancy Algorithms—Part I: Methodology and Experiments With Synthesized Data” (IEEE Transactions on Image Processing Vol. 11, No. 9, September 2002).
[19]D.A. Forsyth “A Novel Algorithm for Color Constancy” (International Journal of Computer Vision, 1990). [20] Edwin H. Land, “The Retinex Theory of Color Vision”
(December 1977).
[21]Arjan Gijsenij, Rui Lu, and Theo Gevers “Color Constancy for Multiple Light Sources” (IEEE TRANSACTIONS ON IMAGE PROCESSING, VOL. 21, NO. 2, FEBRUARY 2012).
[22]Anustup Choudhury and Gérard Medioni, “Color Constancy using Denoising Methods and Cepstral Analysis” (University of Southern California).
[23]Deepak Kumar Dewangan and Yogesh Rathore, “Image Quality Costing of Compressed Image Using Full Reference Method”, Int. J. Tech. Vol. 1, Issue 2, 2011. [24]Arjan Gijsenij, Rui Lu, and Theo Gevers, “Color