Parallel Data Processing in the Cloud using Nephele
Mayura D. Tapkire
PG Student M B E Society’s College of
Engineering, Ambajogai Maharastra, India
B. M. Patil
Professor
M B E Society’s College of Engineering, Ambajogai
Maharastra, India
V. M. Chandode
Associate Professor M B E Society’s College of
Engineering, Ambajogai Maharastra, India
ABSTRACT
In recent years, Infrastructure-as-a-Service (IaaS) clouds have become increasingly popular as a flexible and inexpensive platform for ad-hoc parallel data processing. Major players in cloud computing have started to integrate frameworks for parallel data processing in their product portfolio, making it easy for customers to access these services and to deploy their programs. However, currently used processing frameworks have been designed for static, homogeneous cluster systems and do not support the new features which distinguish the cloud platform. In this paper discussion is being done on the research project Nephele. Nephele is the first data processing framework to explicitly exploit the dynamic resource allocation offered by today‟s IaaS clouds for both, task scheduling and execution. First performance results of Nephele are presented and its efficiency is compared with one of the well-known software, MapReduce. MapReduce is chosen for comparison since it is open source software and currently enjoys high popularity in the data processing community.
Keywords
Cloud computing, parallel data processing, Nephele, MapReduce
1.
INTRODUCTION
Now-a-days large number of companies have to process abundant data in a cost efficient way. Internet search engines, like Microsoft, Google, and Yahoo are some companies which represent this trend. [1]. On-demand resource provisioning is one of the key features of IaaS cloud. The cost of acquiring and maintaining a large IT infrastructure has often been expensive for companies that only have to process huge amount of data occasionally, running their own data center. Parts of the computer science community have tackled this problem with “cloud computing”.
Cloud computing has emerged as a promising approach to rent a large IT infrastructure on a short-term pay-per-usage basis. Operators of so-called Infrastructure-as-a-Service (IaaS) clouds, let their customers allocate, access, and control a set of virtual machines (VMs) which run inside their data centers and only charge them for the period of time the machines are allocated. The cloud‟s virtualized nature helps to enable promising use cases for efficient parallel data processing. However, it also imposes new challenges compared to classic cluster setups. Instead of dynamic resource allocation, current data processing frameworks expect the cloud to imitate the static nature of the cluster environments they were originally designed for. For example, Amazon Elastic MapReduce [2], currently a major product for cloud data processing, does not
support to change the set of allocated VMs for a processing job in the course of its execution, although the job might have completely different demands on the environment. As a result, the rented resources may be inadequate for big parts of the processing job, which may lower the overall processing performance and increase the cost.
2.
RELATED WORK
In recent years a variety of systems to facilitate many tasks computing (MTC) [1] has been developed. Dean and Ghemawat [3] designed MapReduce to run data analysis jobs on a large amount of data, which is expected to be stored across a large set of share-nothing commodity servers. MapReduce is highlighted by its simplicity: Once a user has fit his program into the required map and reduce pattern, the execution framework takes care of splitting the job into subtasks, distributing and executing them. The MapReduce [4] scheme takes a set of input key-value pairs, processes it, and produces a set of output key-value pairs.
The Pegasus framework by Deelman et al. [5] has been designed for mapping complex scientific workflows onto distributed resources such as the Grid. Pegasus which stands for Planning for Execution in grids, lets its users describe their jobs as a DAG (directed acyclic graph) with vertices representing the tasks to be processed and edges representing the dependencies between them. The created workflows remain abstract until Pegasus creates the mapping between the given tasks and the concrete compute resources available at runtime. It deals with unexpected changes in the execution environment and uses DAGMan and Condor-G as its execution engine [6]. As a result, different task can only exchange data via files.
Thao et al. [7] introduced the Swift system to reduce the management issues which occur when a job involving numerous tasks has to be executed on a large, possibly unstructured, set of data. Isard et al. [8] proposed Dryad, which is designed to scale from powerful multi-core single computers, through small clusters of computers, to data centres with thousands of computers. Current data processing frameworks like Google‟s MapReduce or Microsoft‟s Dryad engine have been designed for cluster environments. This is reflected in a number of assumptions they make which are not necessarily valid in cloud environments.
simplifies these tasks, unifying workflow execution over batch queue systems and cloud computing. The drawback of this is it rather aims at batch-driven workflows than the data intensive, pipelined workflows. Borkar et al. [12] proposed Hyracks which is a flexible and extensible foundation for data-intensive computing. Hyracks is a partitioned-parallel dataflow execution platform that runs on shared-nothing clusters of computers. Considering the opportunities and challenges for efficient parallel data processing in clouds Warneke and Kao [1] presented research project Nephele. Nephele is the first data processing framework to explicitly exploit the dynamic resource allocation offered by today‟s IaaS clouds for both, task scheduling and execution.
3.
PROPOSED WORK
3.1
Overview of Nephele
Nephele is a new data processing framework for cloud environment that takes up many ideas of previous processing frameworks but refines them to better match the dynamic and opaque nature of a cloud. Nephele architecture follows a classic master-worker pattern as illustrated in Figure 1.
Before submitting a Nephele compute job, a user must start a VM in the cloud which runs the Job Manager (JM). The JM which receives the client‟s jobs is responsible for scheduling them and coordinates their execution [1, 13]. It is capable of communicating with the interface the cloud operator provides to control the instantiation of VMs. This interface is cloud controller. By means of the cloud controller the JM can allocate or deallocate VMs according to the current job execution phase. We will comply with common cloud computing terminology and refer to these VMs as instances for the remainder of this study [13]. The term instance type will be used to differentiate between VMs with different hardware characteristics.
The actual execution of tasks which a Nephele job consists of is carried out by a set of instances. Each instance runs a so-called Task Manager (TM). A TM receives one or more tasks from the JM at a time, executes them and after that informs the JM about their completion or possible errors. Unless a job is submitted to the JM, we expect the set of instances (and hence the set of TM) to be empty.
job‟s particular tasks, how many and what type of instances the job should be executed on and when the respective instances must be allocated/deallocated to ensure a continuous but cost efficient processing. The newly allocated instances boot up with a previously compiled VM image. The image is configured to automatically start a TM and register it with the JM. Once all the necessary TMs have successfully contacted the JM, it triggers the execution of the scheduled job.
3.2
Structure of a Nephele Schedule
Nephele‟s architecture follows a classic master-worker pattern. Workers can be allocated on demand.
3.2.1
On-Line Non-Preemptive Utility
3.2.1.1
Efficiency Scheduling
The on-line non-preemptive scheduling method is used to maximize the efficiency gain. A task is a sequential activity that uses a set of inputs to produce a set of outputs [13]. Since the execution of a task may gain positive profit or suffer penalty and thus degrade the overall computing performance, judicious decisions must be made with regard to executing a task, dropping or aborting a task and when to drop or abort a task. The rationale of this approach is very intuitive; a task can be accepted and executed only when it is statistically promising to bring positive gain and discarded or aborted otherwise. Before introduction of the details of scheduling approach, first we have to introduce two useful concepts, the expected gain utility and the critical point.
3.2.1.2
The expected gain utility and the critical
point
Since the task execution time is not known deterministically, we do not know if executing the task will lead to positive gain or loss. To solve this problem, we can employ a metric, i.e., the expected gain utility, to help us make the decision. Given a task T with arrival time of ati, let its predicted starting time be ti. Then the potential Gain Pi (ti) to execute T can be represented as the integration of the summation of gain over time ti and the difference of the starting time of the process and the arrival time of the process[13].
) (
max
)
(
))
(
(
max
)
(
i i i t at C
i i i i i
i
t
P
t
t
at
f
t
dt
P
……...(1) [image:2.595.86.525.562.729.2]Similarly, the potential loss (Li (T)) to execute Ti can be represented as[13]:
Figure 1: Nephele architecture [13]
Client
Controller
CLOUD
Private network
Job manager
Task
Manager
Task
Manager
Per
si
st
en
t
st
or
m ax ) ()
(
)
(
)
(
i i i t at Ci i
i
T
L
D
f
t
dt
L
………(2)Therefore, the expected increased efficiency η (T) to execute Ti can be represented as[13]:
)
(
)
(
)
(
T
P
it
i
L
it
i
………(3)A task can be accepted or chosen for execution when η (T)>0, which means that the probability to obtain positive gain is no smaller than that to incur a loss. We can further limit the task acceptance by imposing a threshold (δ) to the expected accrued utility, i.e. a task is accepted or can be chosen for execution if: Pi(T) ≥µ
3.2.1.3 Efficiency threshold (µ)
Furthermore, since the task execution time is not known a prior, we need to decide whether to continue or abort the execution of a task. The longer we execute the task, the closer we are to the completion point of the task. At the same time, however, the longer the task executes the higher penalty the system has to endure if the task cannot meet its deadline. To determine the appropriate time to abort a task, we employ another metric, the critical point. Let Ti starts its execution at t1, then the potential profit Ti > t (i. e., η (T)) can be represented as the integration of the maximum gain and the difference of the task.
The potential loss of a function can be calculated by the integration of its completion time to the max time. Hence, the expected efficiency η is the difference believes the gain of a task and the loss of a task. If we substitute η to be equal to 0, we can see that the gains & loss are found to be equal in executing a task. As time increases, the η decrease and after a critical point at deadline more loss incurs than gain.
3.3
ALGORITHMS
3.3.1
Algorithm 1:Non-Preemptive Scheduling
Consider K accepted task in ready queue and the current time t -Parameters
1. Accepted task in the queue level. Let {t1 , t2 , t3
,……..., tk} Ar be the arrival time AT [T= 1 to K]. 2. Let currently running task may be at T=0. Show the
task with T and the threshold value Th AT = A0. 3. Conditions the current job is in critical, then abort
the execution of T0.
4. Otherwise new task enrolled in the end process. 5. Calculation of efficiency of task and reschedule the
task based on the utility value and load into the ready queue.
6. Start the execution from T1. The utility value is less than the threshold value then removes the process from ready queue else the current process and start its execution.
Description:
This scheduling algorithm works at scheduling points that include: the arrival of a new task, the completion of the current task and the critical point of the current task. In algorithm 1, when the time reaches the critical point of the current task, the current active task is immediately discarded
and the task with the highest expected efficiency is selected to be executed. Upon the finish of the current task, the task with the highest expected efficiency is selected for execution. After the selection of the new task in both of the two cases, the expected efficiency for the rest of the tasks is recalculated. The tasks with the expected efficiency smaller than the threshold value are discarded.
3.3.2
Algorithm 2: Sort the Ready Queue based
on Recalculated Expected Gain
1. Input: Let Tr={ t1 , t2 , ..., tk} be the accepted
tasks in the ready queue, let tri ,
i = 1, ..., k represent their specific arrival times. Let current time be t and T0 be the task currently being executed.
2. Output: The list of tasks in the ready queue is given
as T‟r = {T‟1, T‟2, ..., T‟k} sorted based on their
expected gain.
3. Tstart = expected finishing time of T0 – t. 4. for i=0 to k do.
5. T‟
i
= Tj
where Tj
Tr
is the task with the largest expected gain assuming it starts at Tstart. 6. Remove Tj
from Tr
.7. Tstart = Tstart + expected execution time of T‟
j
. 8. Calculate the following tasks expected utility attime Tstart. 9. end for.
Description:
When a new job comes, it is first inserted at the head of the ready queue, assuming its expected starting time would be the expected finishing time of the current active task. Based on this starting time, we then can compare its expected utility with the rest of the tasks in the queue. If its expected utility is less than that of the one following it, we reinsert this job to the queue according to its new expected utility. We calculate the new expected utility according to Algorithm 2, by estimating its new expected starting time as the sum of the expected executing time of the leading tasks‟ in the ready queue. This procedure continues until the entire ready queue becomes a list ordered according to their expected utilities. We remove the ones with expected utility lower than the threshold. The feasibility check is one more part deserves detail description. In this part, scheduling simulates the real execution sequence for the left tasks in ready queue and check following this sequence, if all of them can satisfy the requirement or not. The thing needs to be discussed is how to determine the sequence of the left tasks. From equation (1), (2) and (3), we can clearly see that the expected utility of running a task depends heavily on variable T, i.e., the time when the task can start. If we know the execution order and thus the expected starting time for tasks in the ready queue, we will be able to quantify the expected utility density of each task more accurately.
4.
PERFORMANCE EVALUATION
4.1
Nephele Simulation
Figure 2: Nephele framework
Five modules are created as: Job_ Manager, Controller, Task_Manager, Task_Reply and FailureSend. In the framework six users (customers) are created to create job_requests. One by one each user sends request to Job_Manager. At the upper part one cloud server is shown. This is the cloud server responsible for processing all user jobs.
All requests are forwarded to Task_Manager through Controller. First user2 sent job_request to Job_Manager. One by one user send request to Job_Manager. Task_Manager sends controller check towards Controller, and then job_requests are forwarded towards Task_Manager. Near to Controller, Task_Reply and FailureSend modules, ready queues are shown. Ready queue length is shown with letter „q‟ .When Jobs will be accumulated in each module, that respective ready queue length will get automatically increase. When the request is forwarded to cloud server, reply will sent back to user through Task_Manager.Task_Manager will sent
that reply to Job_Manager through Task_Reply and then to user. As per nonpreemptive scheduling algorithm, job is accepted or can be chosen for execution if: (Pi (T)
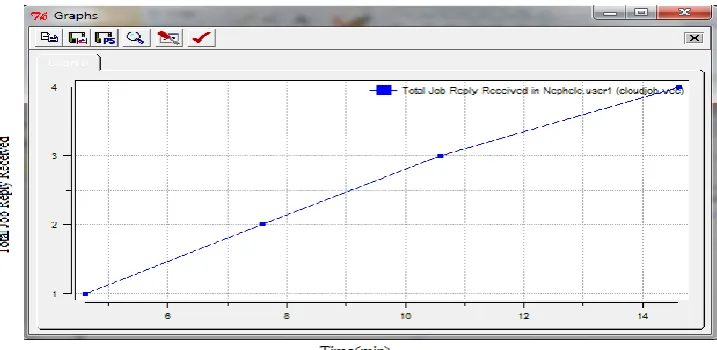
µ) Potential gain is greater than Efficiency threshold. Ready queue is sorted based on the recalculated expected gain. If jobs are processed successfully the result is forwarded to Task_Reply otherwise towards FailureSend module.First we run the simulation up to 15 minutes and analyzed the graphs plotted by plove tool. The graph in Figure 3 shows that the variation between the total job requests sent by user1 and total time required getting reply for that job request.
The graph of Figure 4 shows that total four jobs got reply. Similarly the graph in Figure 5 shows variations between total job request sent in Nephele Job_Manager and total time required to get reply for that job request. The total job reply got is shown in Figure 6.
[image:4.595.133.466.559.754.2]Figure 4: Total job reply received in Nephele user1
Figure 5: Total job reply sent in Nephele Job_Manager
Figure 6: Total job request receivedt in Nephele Job_Manager
4.2
MapReduce Simulation
MapReduce arhitecture is simulated in Figure 7. In this framework near to passive queue server ready queues are shown to store jobs (messages) as like Nephele framework and color changes when queue is holding number of messages.
"leave1" module; the others get into "delay" modules where they each suffer a small constant delay.
After the delay they are queued up in "passiveq" passive queues, served by "qserver". "qserver" serves the three queues in priority order: "passiveq [1]" is only examined when "passiveq [0]" is empty, and "passiveq [2]" is only examined when both "passiveq [0]" and "passiveq [1]" are empty. Examination of the queues is programmed by calling a method in the passive queue module objects (as opposed to message exchange, or integrating all queues and the server
[image:6.595.133.458.180.746.2]queue to obtain a message, it tells the passive queue object to send it (this is also done via a method call.) The processing time in the server is random. After processing, messages are forwarded into "leave2" where they end their life circles. All the statistics are collected about the time messages spent in the system. In Figure 8 statistics about the messages get discarded in the "leave1" module are plotted. In Figure 9 statistics about the time messages spent in the “leave2” of system are plotted.
[image:6.595.137.456.465.745.2]Figure 7: MapReduce framework
Figure 8: Messages get discarded in the "leave1"
5.
ANALYSIS OF RESULTS
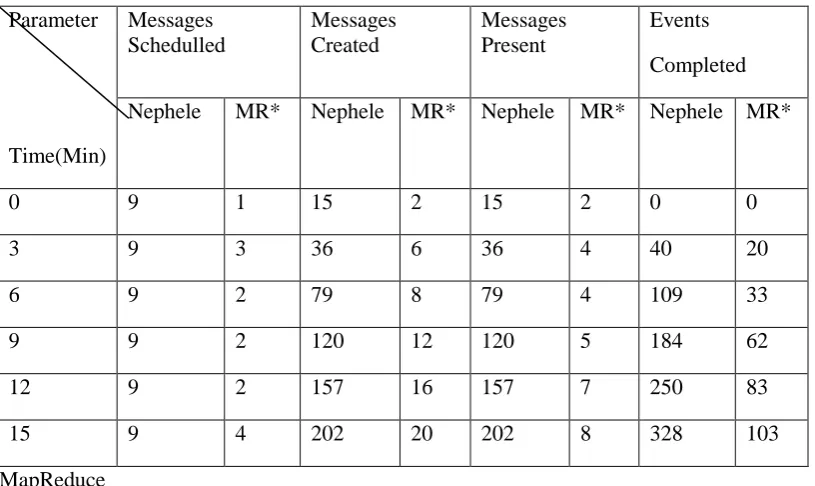
Performance of both the frameworks have been studied and simulated under a variety of parameters and time intervals. In both frameworks simulation time kept same to analyze the results at various intervals. In this analysis four parameters are considered. After setting the specific time interval, framework
[image:7.595.96.504.160.403.2]will schedule the number of messages for processing. While running the simulation we can see variations in each parameter. The simulation results of both frameworks at various intervals of time from 0, 3, 6…15 minutes are recorded and tabulated in the Table 1.
Table 1 Comparative performance analysis of Nephele and MapReduce frameworks
Parameter
Time(Min)
Messages
Schedulled
Messages
Created
Messages
Present
Events
Completed
Nephele
MR*
Nephele
MR*
Nephele
MR* Nephele MR*
0
9
1
15
2
15
2
0
0
3
9
3
36
6
36
4
40
20
6
9
2
79
8
79
4
109
33
9
9
2
120
12
120
5
184
62
12
9
2
157
16
157
7
250
83
15
9
4
202
20
202
8
328
103
*MapReduce
The graph in Figure 10 shows that the variation between time in minutes and messages scheduled in both frameworks. When we started Nephele framework simulation, nine messages got scheduled at the start and remained same at the end of simulation. While in MapReduce number of messages scheduled got varied at each interval of time. From that we can know that the values of messages created will be same corresponding values of time in minutes. This graph shows that, Nephele‟s message creation is having higher total utility than the MapReduce.
The graph in Figure 11 shows that the variation between time in minutes and messages created in both frameworks. Number of messages created and messages present in Nephele are always same. This graph shows that, the number of messages
created in Nephele within respective time is always more than MapReduce. From that we can know, how the values of message creation will increased to the corresponding values of time intervals.
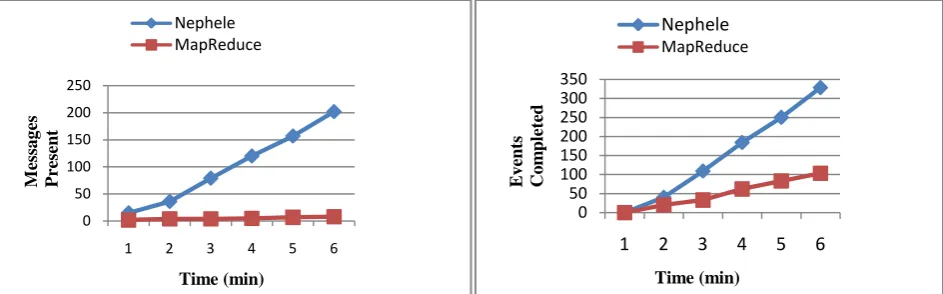
[image:7.595.66.531.572.712.2]The graph in Figure 12 shows that, the variation between time in minutes and messages present in both frameworks. As number of messages created is less so the number of messages presented will be automatically less in case of MapReduce as compared to Nephele. The graph in Figure 13 shows that the variation between time in minutes and events completed in both frameworks. At the end of simulation, we can easily analyze, events completed in Nephele are more than thrice the events completed in Mapreduce. So we can conclude that from each graph, working of Nephele is fast and superior to MapReduce .
Figure 10: Messages scheduled vs. Time (min) in Nephele Figure 11: Messages created vs. Time (min) in Nephele
and MapReduce framework and MapReduce framework
0 2 4 6 8 10
1 2 3 4 5 6
Nephele MapReduce
Time (min)
M
ess
a
g
es
S
ch
ed
u
led
0 50 100 150 200 250
1 2 3 4 5 6
Nephele MapReduce
Time (min)
M
ess
a
g
es
Cr
ea
te
Figure 12: Messages present vs. Time (min) in Nephele Figure 13: Events completed vs. Time (min) in Nephele and MapReduce framework and MapReduce framework
6.
CONCLUSIONS AND FUTURE
SCOPE
In this paper we presented Nephele‟s basic architecture and a performance comparison to the famous data processing framework MapReduce with a conclusion that, working of Nephele is fast and superior to MapReduce. In structure of Nephele schedule, we present non-preemptive scheduling as new approach to Nephele. Performance of Nephele may improve extensively by incorporating preemptive scheduling in future.
7.
REFERENCES
[1] D. Warneke and O. Kao, “Exploiting dynamic resource allocation for efficient parallel data processing in the cloud,” IEEE Transactions on Parallel and Distributed Systems, January 2011.
[2] Amazon web services LLC. Amazon ElasticMapReduce. http://aws.amazon.com/de/elasticmapreduce/, 2011
[3] J. Dean and S. Ghemawat, “MapReduce: simplified data processing on large clusters,” in proceedings of the sixth International Symposium on Operating Systems Design & Implementation, Berkeley, CA,USA, pp.10–10, 2004.
[4] J. Dean and S. Ghemawat, “MapReduce: simplified data processing on large clusters,”Communications of the
ACM, vol. 51, pp.107–113, 2008.
[5] E. Deelman, G. Singh, M. Su, J. Blythe, Y. Gil, C. Kesselman, G. Mehta, K. Vahi, G. B. Berriman, J. Good, A. Laity, J. Jacob, and D. Katz, “Pegasus: A framework for mapping complex scientific workflows onto distributed systems,” Scientific Programming Journal, vol.13(3), pp.219–237, 2005.
[6] J. Frey, T. Tannenbaum, M. Livny, I. Foster and S. Tuecke, “Condor-G: a computation management agent for multi-institutional grids,” journal of Cluster Computing, vol.5 (3), pp.237–246, 2002.
[7] Y. Zhao, M. Hategan, B. Clifford, I. Foster, G. Laszewski, V. Nefedova, I. Raicu, T. Stef-Praun, and M. Wilde, “Swift: fast, reliable, loosely coupled parallel
computation,” in proceedings of the IEEE Congress on Services, pp. 199–206, 2007.
[8] M. Isard, M. Budiu, Y. Yu, A. Birrell, and D. Fetterly, ”Dryad: distributed data parallel programs from sequential building blocks,” in proceedings of the second ACM SIGOPS/EuroSys European Conference on Computer Systems, New York, USA, pp. 59–72, 2007.
[9] I. Raicu, Y. Zhao, C. Dumitrescu, I. Foster, and M. Wilde, “Falkon: a fast and light weight task execution framework,” proceedings of the ACM/IEEE conference on Supercomputing, New York, USA, pp.1–12, 2007. [10]T. Dornemann, E. Juhnke, and B. Freisleben.
“On-Demand Resource Provisioning for BPEL Workflows Using Amazon‟s Elastic Compute Cloud.” In CCGRID ‟09: Proceedings of the 2009 9th IEEE/ACM International Symposium on Cluster Computing and the Grid, pages 140–147, Washington, DC,USA,2009.IEEE Computer Society.
[11]L. Ramakrishnan, C. Koelbel, Y. Kee, R. Wolski, D. Nurmi, D. Gannon, G. Obertelli, A. YarKhan, A. Mandal, T. Huang, K. Thyagaraja, and D. Zagorodnov, “VGrADS: enabling e-Science workflows on grids and clouds with fault tolerance,” in proceedings of the International Conference for High Performance Computing, Networking, Storage and Analysis, New York, USA, pp. 1–12, 2009.
[12]V. Borkar, M. Carey, R. Grover, N. Onose, and R. Vernica, “Hyracks: A flexible and extensible foundation for data-intensive computing,” in proceedings of the twenty seventh IEEE international conference on Data Engineering, Washington, DC, USA, pp. 1151–1162, 2011.
[13]V. Kumar and S. Palaniswami, “A dynamic resource allocation method for parallel data processing in cloud computing,” Journal of Computer Science, pp. 780-788, 2012.
0 50 100 150 200 250
1 2 3 4 5 6
Nephele MapReduce
Time (min)
M
ess
a
g
es
Pre
se
n
t
0 50 100 150 200 250 300 350
1 2 3 4 5 6
Nephele MapReduce
Time (min)
Ev
en
ts
Co
m
p
lete
![Figure 1: Nephele architecture [13]](https://thumb-us.123doks.com/thumbv2/123dok_us/8077870.781433/2.595.86.525.562.729/figure-nephele-architecture.webp)