Technology (IJRASET)
MR Brain Image Segmentation Based on
Self-Organizing Map and Neural Network
E.Dilliraj 1, P.Vadivu 2, A.Anbarasi 3
1,2
Assistant Professor, 3Student Deptt of Electronics and Communication, Prathyusha
Abstract: Image segmentation is an important process to extract information from complex medical images. Segmentation has wide application in medical field. The main objective of image segmentation is to partition an image into mutually exclusive and exhausted regions such that each region of interest is spatially contiguous and the pixels within the region are homogeneous with respect to a predefined criterion. The main objective of our project is to develop various segmentation algorithms such as Self organizing map and Neural Network to detect the various tissues like white matter, gray matter and cerebral spinal fluid for a given magnetic resonance image data set and also provide satisfactory results compared to other algorithm in terms of misclassification rate, specificity, sensitivity and correlation.
Keywords: Self-organizing map, Neural Network
I. INTRODUCTION
Technology (IJRASET)
making it especially useful in neurological (brain), musculoskeletal, cardiovascular, and oncological (cancer) imaging. Unlike CT, MRI uses no ionizing radiation. Rather, it uses a powerful magnetic field to align the nuclear magnetization of (usually) hydrogen atoms in water in the body. Radio frequency (RF) fields are used to systematically alter the alignment of this magnetization. This causes the hydrogen nuclei to produce a rotating magnetic field detectable by the scanner. This signal can be manipulated by additional magnetic fields to build up enough information to construct an image of the body.
II. EXISTING SYSTEM
In the Existing System, the task was to produce a binary segmentation of the (heterogeous) tumor and edema region, with ground truth defined by an expert radiologist. Our data set consisted of 10 patients with brain tumors covering4 different types of tumors. With Edema and MRI combined with the fact that we performed inter-patient testing on makes this a very difficult scenario, where this existing methods proposed to perform this task will perform poorly.To quantify the quality of the segmentations, we used the similarity measure between the ground truth and the segmentation results interms of true positives (tp), false positives (fp), and false negative (fn) pixels of the image but results poor in quality.
III. PROPOSED SYSTEM
In this proposed system brain tumors have been segmented with the help of four methods. The execution time for K-means Clustering and SOM were less compared to the other clustering methods. With calculating the number of tumor pixels, K-means clustering and Hierarchical clustering gave a better result than the other methods. The four clustering algorithms were tested with a database of 100 MRI brain images.K-means and Hierarchical clustering achieved about 95% result. SOM and FCM achieved a result of about 80%. In this system, the axial view of the human brain is taken for tumor detection. The system can be extended to detect tumors on other views of the brain. This system considers the color and luminosity parameters for tumor detection. The texture can be taken as an additional parameter for tumor detection.
A. Related Work
Two ideas struck me as plausible ways to find k, given nothing but a sample, although both of them relied on using standard deviation. The first algorithm sorts the examples in the combined sample and simply iterates over each of them, adding examples to a new working sample if they are within three standard deviations of the current mean, since about 99 percent of the points in a given normal distribution should be within that range. When an example falls outside that range, another working sample is created, and the process continues. When all the examples have been iterated over, the function returns the number of working samples it used. Further, it assumes a minimum of 50 examples in each sample (to calculate the initial mean and standard deviation), and this parameter can be varied depending on knowledge of the data. The Java source code for this function (or the entire experiment) is available upon request.The second algorithm takes the standard deviation of a sample, and recursively calls itself using smaller ones as the standard deviation decreases. Since it is easier to understand a recursive function by viewing it as opposed to reading a description from the source code .At first glance it looks like the function expects an initial standard deviation, but in fact, it is used such that on the first run, that parameter is initialized to -1. Therefore, it will calculate the initial standard deviation based on the entire sample. Within it there is a variable, tolerance, which is used to indicate how close the smaller samples standard deviation should be to the last standard deviation to continue splitting the sample. This value is chosen arbitrarily, and it is likely the experiment results could have been better had I attempted to let the program "learn" a good value to use.
B. Algorithm For Detecting Brain Tumor Input: MRI of brain image.
Output: Tumor portion of the image.
Step1:- Read the input color or grayscale image.
Step2:- Converts input colour image in to grayscale image which is done by forming a weighted sum of each three (RGB) component, eliminating the saturation and hue information while retaining the luminance and the image returns a grayscale colour map.
Step3:- Resize this image in to 200 × 200 image matrix.
Technology (IJRASET)
output elements that exceed the certain range of the integer type is shortened, and fractional values are rounded.
Step5:- Add step2, step4 image and a integer value 45 and pass it in to a median filter to get the resultant enhanced image.
Step6:- Computes a global threshold that can be used to convert an intensity image (Step5) to a binary image with a normalized intensity value which lies in between range 0 and 1.
Step7:- Compute watershed segmentation by matlab command watershed (step6 image).
Step8:-Compute the morphological operation by two matlab command imerode and imdilate and strel with arbitrary shape.
Step9:- Store the size of the step 8 image into var1 and var2 i.e no. Of rows and column in pixels by [var1 var2]=size(step8 image) Step10:- For i=1:1:var1
Step11:- For j=1:1:var2 do Step12:- If step8 image (i,j) == 1do Step13:- step2 image (i,j) = 255 Step14:- Else do
Step15:- step2 image (i,j) = step2 image (i,j) * 0.3 Step16:- End If Step17:- End For
Step18:- End For
Step19:- Convert in to binary image and traces the exterior boundaries of objects, as well as boundaries of holes inside these objects, in the binary image and into an RGB color image for the purpose of visualizing labeled regions.
Step20:- Show only tumor portion of the image by remove the small object area. Step21:- Compute edge detection using sobel edge detection technique.
C. Algorithm For Area Calculation
Input: Tumor portion of the image. Output: Area of the tumor. Step1:- Read the input color or grayscale image.
Step2:- Converts input colour image in to grayscale image which is done by forming a weighted sum of each three (RGB) component, eliminating the saturation and hue information while retaining the luminance and the image returns a grayscale colour map and store it into variable I. Step3:- Compute numbers of rows and column in pixels by [r2 c2] = size (I) Step4:- Initialize a variable a=0
Step4:- For i=1:1:r2 do Step4:- For j=1:1:c2 Do Step4:- If I (i,j)==255 Do Step4:- a=a+0 Step4:- Else do Step4:- a=a+1 Step4:- EndIF Step4:- EndFor
Step4:- End For
Step4:- Display the area
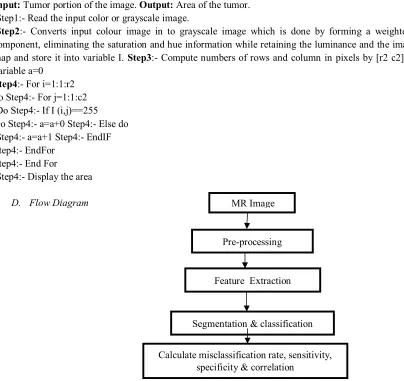
D. Flow Diagram
[image:4.612.47.451.329.710.2]
Fig 1: Flow diagram of the segmentation Pre-processing
Feature Extraction
Segmentation & classification
Calculate misclassification rate, sensitivity, specificity & correlation
Technology (IJRASET)
E. MethodologyThe main objective was to identify the principal stressors affecting biotic integrity in each of the three states evaluated in the present report. Grouping the sites with similar types of stressors and compare these with the biotic integrity in each homogeneous group was important in order to identify those that showed a major influence. The stressor and biological indices data were available in different databases that are explained later in the present report. SOM were the tool used to identify the clusters or homogenous groups of stressors and they are explained in detail in the present report. Basically, SOM are a tool to organize highly dimensional data in homogeneous groups or clusters in which the data belonging to these groups are as similar as possible. The SOM were used in two different ways:
1) SOM followed by multiple range tests within clusters: The SOM were run using all the chemical and physical environmental variables and habitat metrics. A number of optimum clusters was then found. Subsequently, the distributions among clusters of the available indices of biotic integrity (fish for Minnesota and Ohio and benthic for Maryland) were plotted and a multiple range test among clusters was performed to determine if the differences within the clusters were statistically significant. A 95% confidence interval was used. The different statistically significant homogeneous group’s distribution was obtained. The same process was then repeated for each one of the variables used in the clustering process and the distribution of the homogeneous groups was then compared to the distribution of the biotic indices. Those metrics that showed equal or similar distributions were considered to be the most important for biotic integrity.
2) SOM neuron-analysis: In this case we considered the neurons as the minimal, most homogeneous group of environmental values. In a SOM, one neuron groups a few sites with very similar characteristics. The values of each environmental variable and the biotic index in each neuron were averaged. The neuron-based environmental variables were then regressed against the neuron-based biotic index. Those variables with highest correlation were considered the most important for biotic integrity. Subsequently, we analyzed the relationships among different environmental variables, especially the relationships between off-stream and in-off-stream habitat parameters as well as the relationships between physical variables and chemical quality values. This was done by a simple neuron-based regression among the different variables.
F. Methods
1) Pre-processing: According to the need of the next level the pre-processing step convert the image. It performs filtering of noise and other artifacts in the image and sharpening the edges in the image. RGB to grey conversion and Reshaping also takes place here. It includes median filter for noise removal.
2) Segmentation: Segmentation is carried out by advanced K-means and Fuzzy C-means algorithms.
3) Feature extraction and approximate reasoning: The feature extraction is extracting the cluster which shows the predicted tumor at the FCM (Fuzzy C-means) output. The extracted cluster is given to the threshold process. It applies binary mask over the entire image. In the approximate reasoning step the tumor area is calculated using the binarization method.
G. Modeling Techniques
1) K-Means clustering: The corresponding cluster centroid. Thus the purpose of k-means clustering is to cluster the data. A cluster is a collection of objects which are similar between them and are dissimilar to the objects belonging to other clusters. Clustering is an unsupervised learning method which deals with finding a structure in a collection of unlabelled data. A loose definition of clustering could be the process of organizing objects into groups whose members are similar in some way. K-means clustering is an algorithm to group objects based on attributes/features into k number of groups where k is a positive integer. The grouping (clustering) is done by minimizing the Euclidean distance between data set.
H. K-Means Algorithm
Technology (IJRASET)
Algorithm:1) Give the no of cluster value as k.
2) Randomly choose the k cluster centers
3) Calculate mean or center of the cluster
4) Calculate the distance between each pixel to eachcluster center 5) If the distance is near to the center then move tothat cluster.
6) Otherwise move to next cluster.
7) Re-estimate the center.
I. Fuzzy C Means Algorithm
Clustering is an unsupervised classification of objects (data instances) into different groups. In particular we are talking about the partitioning of a dataset into subsets (clusters), so that the data in each subset (ideally) share some common property. This property is usually defined as proximity according to some predefined distance measure. The goal is to divide the dataset in such a way that objects belonging to the same cluster are as similar as possible, whereas objects belonging to different clusters are as dissimilar as possible. The computational task of classifying the data set into k clusters is often referred to as k-clustering. Although estimating the actual number of clusters (k) is an important issue we leave it untouched in this work. Fuzzy clustering in contrast to the usual (crisp) methods does not provide hard clusters, but returns a degree of membership of each object to all the clusters. The interpretation of these degrees is then left to the user that can apply some kind of a thresholding to generate hard clusters or use these soft degrees directly. All the algorithms that we consider here are partitional, deterministic and non-incremental (based on the taxonomy defined in . The property that we want to change using fuzzy methods instead of crisp clustering is exclusiveness, as there are cases in which algorithms constructing overlapping partitions of set of documents perform better than the exclusive algorithms.We devote the majority of space to the hard c-means, fuzzy c-means and possibilities c-means. For the other methods we provide just a short description, as we did not find them appropriate for our needs.All algorithms described here are based on objective functions, which are mathematical criteria that quantify the quality of cluster models.
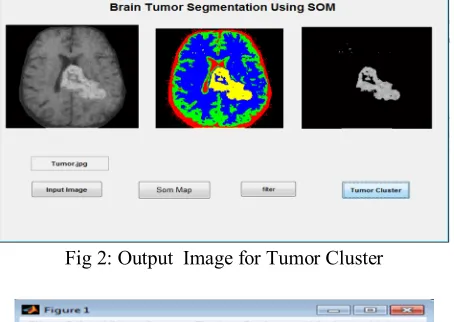
IV. SIMULATION RESULTS
We have mapped the resultant tumor image onto the original grayscale image for presentation purposes.
[image:6.612.203.430.452.613.2]Fig 2: Output Image for Tumor Cluster
Technology (IJRASET)
Fig 4: area calculation output in command window
V. CONCLUSION
We have discussed the performance of the MRI image in terms of weight vector, execution time and tumor pixels detected. We have described several methods in medical image processing and discussed requirements and properties of techniques in brain tumor detection .our project is used to give more information about brain tumor detection and segmentation. The target area is segmented and the evaluation of this tool from the doctor, whom the project is cooperated with, is positive and this tool helps the doctors in diagnosis, the treatment plan making and state of the tumor monitoring. In future, the system should be improved by adapting more segmentation algorithm to suit the different medical image segmentation. Using color based image segmentation; it is possible to reduce the computational cost avoiding feature calculation for every pixel in the image. We have proposed a system for MR image of brain tumor, based on Self-organizing map and fuzzy C-mean Algorithm. Artificial vision aims to replace the human vision in various areas. Image analysis and interpretation represent an essential phase in the chain of the vision process by computer the design of the system depends on the Self-organizing map and fuzzy C mean algorithm to detect brain tumor, the efficiency have been proved by the results obtained from our project.
REFERENCES
[1] Jesna.M,Kumudha Raimond “MR brain image segmentation based on principle component analysis and self-organizing map” International journal for research in applied science and engineering technology vol.2 issue III,march 2014 ISSN:2321-9653.
[2] Vinay Paramshwarappa,Nandish.S “A Segmented Morphological approach to detect Tumor in Brain Images” International Journal of Advanced Research in Computer science and Software Engineering” Volume 4,Issue 1,January 2014 ISSN:2277 128X.
[3] Kanimozhi.M and Hima Bindu.C.H “Brain MR image segmentation using self-organizing map” International Journal of Advanced Research in Computer and Communication Engineering Vol. 2, Issue 10, October 2013.
[4] Sathish kumar.S,Moorthi.M and Madhu.M “An improved method of segmentation using fuzzy-Neuro logic” Second International conference on computer research and development 2010 ISBN 978-0-7695-4043-6.
[5] Tamije selvy.P,Palanisamy.V and Purusothaman.T “performance analysis of clustering algorithms in brain tumor detection of MR images” European journal of scientific research ISSN 1450-216X vol.62 No.3 (2011),pp.321-330.
[6] Ayse Demirhan, Inan Guler, “Combining stationary wavelet transform and self-organizing maps for brain MR image segmentation”,Engineering Applications of Artificial Intelligence, 24, (2011), 358–367.
[7] Juha vesanto and Esa Alhoniemi “Clustering of the self-organizing map” IEEE Transactions on Neural Network,vol.11,No.3,may 2000. [8] John C.Russ “The image processing handbook”,CRC press,2007.
[9] Kohonen.T “Self –organizing map”,third edition.
[10] Kohonen.T,Kaski.S,lagus.K,Salojarvi.J,Honkela, J., Paatero,V., Saarela, A., “Self organization of a massive document collection”. IEEETransactions on Neural Networks 11 (3), (2000), 574–585.
[11] Tian, D., Fan, L., Brain A., “MR images segmentation method based
on SOM neural network”. In: Proceedings of the First International Conference on Bioinformatics and Biomedical Engineering, ICBBE (2007),China, pp. 686–689.