Technology(IJRASET)
Clustering Techniques in Data Mining
S.Jency
1D.Geetha2
1Research Scholar of Computer Science,2Assistant Professor
Department of MCA, Sree Saraswathi Thyagaraja College, Pollachi, Tamil Nadu, India
Abstract—Clustering is a division of data into groups of similar objects. Each group, called cluster, consists of objects that are similar between themselves and dissimilar to objects of other groups. Clustering can be considered the most important unsupervised learning technique so as every other problem of this kind; it deals with finding a structure in a collection of unlabeled data. For example, cluster analysis has been used to group related documents for browsing, to find genes and proteins that have similar functionality, and to provide a grouping of spatial locations prone to earthquakes. In this paper, a survey of several clustering techniques that are being used in Data Mining is presented.
Keywords—clustering, partitioning, data mining, hierarchical clustering, k-means, density-based, grid-based
I. INTRODUCTION
Clustering is a data mining technique of grouping set of data objects into multiple groups or clusters so that objects within the cluster have high similarity, but are very dissimilar to objects in the other clusters. Dissimilarities and similarities are assessed based on the attribute values describing the objects. Clustering algorithms are used to organize data, categorize data, for data compression and model construction, for detection of outliers etc. Common approach for all clustering techniques is to find clusters centre that will represent each cluster. Cluster centre will represent with input vector can tell which cluster this vector belong to by measuring a similarity metric between input vector and all cluster centre and determining which cluster is nearest or most similar one [1]. Many clustering algorithms have been developed and are categorized from several aspects such as partitioning methods, hierarchical methods, density-based methods, and grid-based methods. Further data set can be numeric or categorical. Inherent geometric properties of numeric data can be exploited to naturally define distance function between data points. Whereas categorical data can be derived from either quantitative or qualitative data where observations are directly observed from counts.
II. CLUSTERING APPLICATIONS
Cluster analysis is a major tool in a number of applications in many fields of business and science. The following summarize the basic directions in which clustering are used:
• Data reduction. Cluster analysis can contribute in
compression of the information included in data. In several cases, the amount of available data is very large and its processing becomes very demanding. Clustering can be used to partition data set into a number of “interesting”clusters. Then, instead of processing the data set as an entity, we adopt the representatives of the defined clusters in our process. Thus, data compression is achieved.
• Hypothesis generation. Cluster analysis is used here in
order to infer some hypotheses concerning the data. For instance we may find in a retail database that there are two significant groups of customers based on their age and the time of purchases. Then, we may infer some
hypotheses for the data, that it, “young people go shopping in the evening”, “old people go shopping in the morning”.
• Hypothesis testing. In this case, the cluster analysis is
used for the verification of the validity of a specific hypothesis. For example, we consider the following hypothesis: “Young people go shopping in the evening”. One way to verify whether this is true is to apply cluster analysis to a representative set of stores. Suppose that each store is represented by its customer’s details (age, job etc) and the time of transactions. If, after applying cluster analysis, a cluster that corresponds to “young people buy in the evening” is formed, then the hypothesis is supported by cluster analysis.
• Prediction based on groups. Cluster analysis is applied to
the data set and the resulting clusters are characterized by the features of the patterns that belong to these clusters. Then, unknown patterns can be classified into specified clusters based on their similarity to the clusters’ features. Useful knowledge related to our data can be extracted. Assume, for example, that the cluster analysis is applied to a data set concerning patients infected by the same disease. The result is a number of clusters of patients, according to their reaction to specific drugs. Then for a new patient, we identify the cluster in which he/she can be classified and based on this decision his/her medication can be made.
More specifically, some typical applications of the clustering are in the following fields
• Business. In business, clustering may help marketers
discover significant groups in their customers’ database and characterize them based on purchasing patterns. • Biology. In biology, it can be used to define taxonomies,
categorize genes with similar functionality and gain insights into structures inherent in populations.
•Spatial data analysis. Due to the huge amounts of spatial
• Web mining. In this case, clustering is used to discover
significant groups of documents on the Web huge
collection of semi-structured documents. This
classification of Web documents assists in information discovery.
In general terms, clustering may serve as a pre-processing step for other algorithms, such as classification, which would then operate on the detected clusters.
III. CLUSTERING ALGORITHMS
Clustering is considered as an unsupervised classification process [2]. The clustering problem is to partition a dataset into groups (clusters) so that the data elements within a cluster are more similar to each other than data elements in different clusters by given criteria. A large number of clustering algorithms have been developed for different purposes [4] [2] [3]. Based on the strategy of how data objects are distinguished, clustering techniques can be broadly divided in two classes: hierarchical clustering techniques and partitioning clustering techniques [3]. However there is no clear boundary between these two classes. Some efforts have been done on the combination of different clustering methods for dealing with specific applications. Beyond the two traditional hierarchical and partitioning classes, there are several clustering techniques that are categorized into independent classes, for example, density-based methods, Grid-based methods and Model based clustering methods [5][3]. A short review of these methods is described below.
A. Partitioning Methods
Partitioning clustering algorithms, such as means, K-medoids PAM, CLARA and CLARANS assign objects into k (predefined cluster number) clusters, and iteratively reallocate objects to improve the quality of clustering results. K-means is the most popular and easy-to understand clustering algorithm [6].
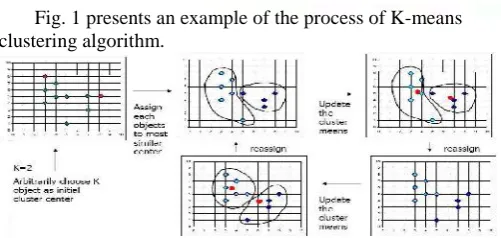
The main idea of K-means is summarized in the following steps:
1. Arbitrarily choose k objects to be the initial cluster centers/centroids;
2. Assign each object to the cluster associated with the closest centroid;
3. Compute the new position of each centroid by the mean value of the objects in a cluster
[image:3.595.41.292.633.752.2]4. Repeat Steps 2 and 3 until the means are fixed.
Fig. 1 presents an example of the process of K-means clustering algorithm.
Fig. 1 An Example of clustering procures of K-means [5].
However, K-means algorithm is very sensitive to the selection of the initial centroids; in other words, the different centroids may produce significant differences of clustering results. Another drawback of K-means is that, there is no general theoretical solution to find the optimal number of clusters for any given data set. A simple solution would be to compare the results of multiple runs with different k numbers and choose the best one according to a given criterion, but when the data size is large, it would be very time consuming to have multiple runs of K-means and the comparison of clustering results after each run.
Instead of using the mean value of data objects in a cluster as the center of the cluster, a variation of means, K-medoids calculates the medoid of the objects in each cluster. The process of medoids algorithm is quite similar as K-means. Whereas, K-medoids clustering algorithm is very sensitive to outliers. Outliers could seriously influence clustering results.
To solve this problem, some efforts have been made based on K-medoids, for example PAM (Partitioning Around Medoids) was proposed by Kaufman and Rousseeuw [7]. PAM inherits the features of K-medoids clustering algorithm. Meanwhile, PAM equips a medoids swap mechanism to produce better clustering results. PAM is more robust than k-means in terms of handling noise and outliers, since the medoids in PAM are less influenced by outliers. With the O(k(n-k)2) computational cost for each iteration of swap (where k is the cluster number, n is the items of the data set), it is clear that PAM only performs well on small-sized datasets, but does not scale well to large datasets.
In practice, PAM is embedded in the statistical analysis systems, such as SAS, R, S+ and etc. to deal with the applications of large sized datasets, i.e., CLARA (Clustering Large Applications) [7]. By applying PAM to multiple sampled subsets of a dataset, for each sample, CLARA can produce the better clustering results than PAM in larger data sets. But the efficiency of CLARA depends on the sample size. On the other hand, a local optimum clustering of samples may not the global optimum of the whole data set. Ng and Han [8] abstracts the medoids searching in PAM or CLARA as searching k sub graphs from n points graph, and based on this understanding, they propose a PAM-like clustering algorithm called CLARANS (Clustering Large Applications based upon Randomized Search). While PAM searches the whole graph and CLARA searches some random sub-graphs, CLARANS randomly samples a set and selects k medoids in climbing sub-graph mountains. CLARANS selects the neighboring objects of medoids as candidates of new medoids. It samples subsets to verify medoids in multiple times to avoid bad samples. Obviously, multiple times sampling of medoids verification is time consuming. This limits CLARANS from clustering very large datasets in an acceptable time period.
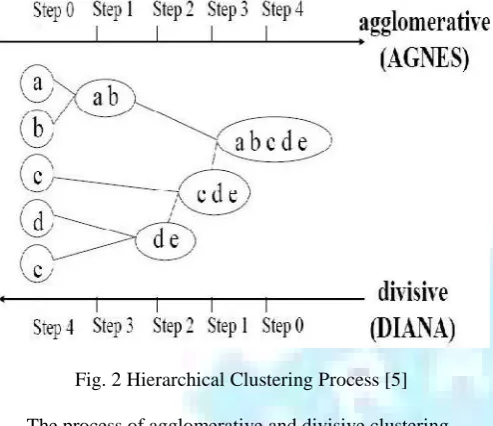
B. Hierarchical methods
according their clustering process: agglomerative and divisive are exhibited in Fig. 2.
Fig. 2 Hierarchical Clustering Process [5]
The process of agglomerative and divisive clustering
Agglomerative: one starts with each of the units in a separate cluster and ends up with a single cluster that contains all units.
Divisive: to start with a single cluster of all units and then form new clusters by dividing those that had been determined at previous stages until one ends up with clusters containing individual units.
AGNES (Agglomerative Nesting) adopts agglomerative strategy to merge clusters. AGNET arranges each object as a cluster at the beginning, then merges them as upper level clusters by given agglomerative criteria step-by-step until all objects form a cluster, as shown in Figure 2. The similarity between two clusters is measured by the similarity function of the closest pair of data points in the two clusters, i.e., single link. DIANA (Divisive Analysis) adopts an opposite merging strategy, it initially puts all objects in one cluster, then splits them into several level clusters until each cluster contains only one object [7].
The merging/splitting decisions are critical in AGNES and DIANA. On the other hand, with O(n2) computational cost, their application is not scalable to very large datasets. Zhang et al [9] proposed an effective hierarchical clustering method to deal with the above problems, BIRCH (Balanced and Iterative Reducing and Clustering using Hierarchies). BIRCH summarizes an entire dataset into a CF-tree and then runs a hierarchical clustering algorithm on a multi-level compression technique, CF-tree, to get the clustering result. Its linear scalability is good at clustering with a single scan and its quality can be further improved by a few additional scans. It is an efficient clustering method on arbitrarily shaped clusters. But BIRCH is sensitive to the input order of data objects, and can also only deal with numeric data. This limits its stability of clustering and scalability in real world applications.
CURE uses a set of representative points to describe the boundary of a cluster in its hierarchical algorithm [12]. But with the increase of the complexity of cluster shapes, the
number of representative points increases dramatically in order to maintain the precision.
CHAMELEON [10] employs a multilevel graph partitioning algorithm on the k-Nearest Neighbor graph, which may produce better results than CURE on complex cluster shapes for spatial datasets. But the high complexity of the algorithm prevents its application on higher dimensional datasets.
C. Density-based methods
The primary idea of density-based methods is that for each point of a cluster the neighborhood of a given unit distance contains at least a minimum number of points, i.e. the density in the neighborhood should reach some threshold [11]. However, this idea is based on the assumption of that the clusters are in the spherical or regular shapes.
DBSCAN (Density-Based Spatial Clustering of
Applications with Noise) was proposed to adopt density-reachability and density connectivity for handling the arbitrarily shaped clusters and noise [11]. But DBSCAN is very sensitive to the parameter Eps (unit distance or radius) and MinPts (threshold density), because before doing cluster exploration, the user is expected to estimate Eps and MinPts.
DENCLUE (Density-based Clustering) is a distribution-based algorithm [13], which performs well on clustering large datasets with high noise. Also, it is significantly faster than existing density-based algorithms, but DENCLUE needs a large number of parameters. OPTICS is good at investigating the arbitrarily shaped clusters, but its non-linear complexity often makes it only applicable to small or medium datasets [14].
D. Grid-based methods
The idea of grid-based clustering methods is based on the clustering oriented query answering in multilevel grid structures. The upper level stores the summary of the information of its next level, thus the grids make cells between the connected levels, as illustrated in Fig. 3.
[image:4.595.303.547.558.756.2]Many grid-based methods have been proposed, such as STING (Statistical Information Grid Approach) [15], CLIQUE [16], and the combination of grid-density based technique Wave-Cluster [17]. The grid-based methods are efficient on clustering data with the complexity of O(N). However the primary issue of grid-based techniques is how to decide the size of grids. This quite depends on the user’s experience.
E. Model-based clustering methods
Model-based clustering methods are based on the assumption that data are generated by a mixture of underlying probability distributions, and they optimize the fit between the data and some mathematical model, for example statistical approach, neural network approach and other AI approaches. When facing an unknown data distribution, choosing a suitable one from the model based candidates is still a major challenge. On the other hand, clustering based on probability suffers from high computational cost, especially when the scale of data is very large.
Based on the above review, we can conclude that, the application of clustering algorithms to detect grouping information in real world applications in data mining is still a challenge, primarily due to the inefficiency of most existing clustering algorithms on coping with arbitrarily shaped distribution of data of extremely large and high dimensional datasets. Extensive survey papers on clustering techniques can be found in the literature [4] [2] [3].
IV. COMPARISON OF CLUSTERING ALGORITHMS
Clustering is broadly recognized as a useful tool in many applications. Researchers of many disciplines have addressed the clustering problem. However, it is a difficult problem, which combines concepts of diverse scientific fields (such as
databases, machine learning, pattern recognition, and statistics).
This section offers an overview of the main characteristics of the clustering algorithms presented in a comparative way. The algorithms categorized in four groups based on their clustering method: partitional, hierarchical,
density-based and grid-based algorithms. Tables 1–4 summarize the main concepts and the characteristics of the most representative algorithms of these clustering categories.
TABLEI
THE MAIN CHARACTERISTICS OF THE PARTITIONAL CLUSTERING ALGORITHMS
Category Partitional
Name Type of data
Complexity
a
Geometr y
Outlier s
Input parameter s
Results Clustering criterion
K-Mean Numerical O(n)
Non-convex shapes
No Number of
clusters
Center of clusters
K-mode Categorica
l
O(n) Non-convex shapes
No Number of
clusters
Modes of clusters
PAM Numerical O(k(n−k)2)
Non-convex shapes
No Number of
clusters
Medoid
s of
clusters
CLARA Numerical O(k(40+k)2
+ k(n−k))
Non-convex shapes
No Number of
clusters
Medoid
s of
clusters
CLARAN S
Numerical O(kn2)
Non-convex shapes
No Number of
clusters, maximum number of neighbors examined
Medoid
s of
clusters
FCM Numerical O(n)
Non-convex shapes
No Number of
clusters
Center of cluster, beliefs
TABLE II
THE MAIN CHARACTERISTICS OF THE HIERARCHICAL CLUSTERING ALGORITHMS
Catego ry
Hierarchical
Name Type of data
Complexitya Geom etry Outl iers Input paramete rs
Results Clustering criterion
BIRCH Numeric
al
O(n) Non-convex shapes
Yes Radius of
clusters, branching factor
CF= (number of
points in the cluster, linear sum of the points in the cluster LS, the square sum
of N data SS)
points.
A point is assigned to closest node (cluster) according to a chosen distance metric. Also, the clusters definition is based on the requirement that the number of points in each cluster must satisfy a threshold.
CURE Numeric al O(n2logn) Arbitra ry shapes Yes Number of clusters, number of cluster representa tives
Assignment of data values to clusters
The clusters with the closest pair of representatives (well scattered points) are merged at each step.
ROCK Categori
cal
O(n2+nmmma+n 2
logn ), O(n2,nmmma)where
mmis the maximum
number of neighbors for a point and ma is
the average number of neighbors for a point. Arbitra ry shapes Yes Number of clusters
Assignment of data values to clusters
an is the number of points in the dataset under consideration.
TABLE III
THE MAIN CHARACTERISTICS OF THE DENSITY-BASED CLUSTERING ALGORITHM
Category Density-Based
Name Type of data Complexi tya Geomet ry Outlier s Input parameter s
Results Clustering criterion
DBSCAN Numeric al O(nlogn) Arbitrar y shapes Yes Cluster radius, minimum number of objects Assignment
of data
values to
clusters
Merge points that are density reachable into one cluster.
DENCLU E Numeric al O(nlogn) Arbitrar y shapes Yes Cluster radiusσ, minimum number of objectsξ Assignment
of data
values to
clusters
an is the number of points in the dataset under consideration
THE MAIN CHARACTERISTICS OF THE GRID-BASED CLUSTERING ALGORITHMS
Category Grid-Based
Name Type of data Complexity a Geomet ry Outlier s Input parameters
Results Clustering criterion
Wave-cluster Special data O(n) Arbitrary shapes
Yes Wavelets, the
number of grid cells for each dimension, the number of application of wavelet transform Clustere d objects
Decompose feature space applying wavelet transformation Average
sub-band→clusters Detail sub-bands→clusters boundaries
STING Special
data
O(K) K is
the number of grid cells at the lowest level
Arbitrary shapes
Yes Number of
objects in a cell
Clustere d objects
Divide the spatial area into rectangle cells and employ a hierarchical structure. Each cell at a high level is partitioned into a number of smaller cells in the next lower level.
a
n is the number of points in the dataset under consideration.
V. CONCLUSION
Clustering lies at the heart of data analysis and data mining applications. The paper has reviewed different types of clustering techniques and the merit of each method is concluded below:
K-mean algorithm has biggest advantage of
clustering large data sets and its performance increases as number of clusters increases. But its use
is limited to numeric values. Therefore
Agglomerative and Divisive Hierarchical algorithm was adopted for categorical data, but due to its complexity a new approach for assigning rank value to each categorical attribute using K- means can be used in which categorical data is first converted into numeric by assigning rank. Hence performance of K-mean algorithm is better than Hierarchical Clustering Algorithm.
Density based methods OPTICS, DBSCAN are
designed to find clusters of arbitrary shape whereas partitioning and hierarchical methods are designed to find the spherical shaped clusters.
Density based methods typically consider exclusive clusters only, and do not consider fuzzy clusters. Moreover, density based methods can be extended from full space to subspace clustering.
STING is a query-independent approach since the statistical information exists independently of queries. It is a summary representation of the data in each grid cell, which can be used to facilitate answering a large class of queries, facilitates parallel processing and incremental updating and hence facilitates fast processing.
Hierarchical methods suffer from the fact that once a step (merge or split) is done, it can never be undone.
DBSCAN does not require one to specify the number of clusters in the data a priori, as opposed to K-Means. Moreover, DBSCAN requires just two parameters and is mostly insensitive to the ordering of points in the database but it cannot cluster data sets well with large difference in densities.
REFERENCES
[1] Manish Verma, Mauly Srivastava, Neha Chack, Atul Kumar Diswar, Nidhi Gupta,” A Comparative Study of Various Clustering Algorithms in Data Mining,”
International Journal of Engineering Reserch and Applications (IJERA), Vol. 2, Issue 3, pp.1379-1384,
2012.
[2] A. Jain, M. N. Murty and P. J. Flynn, “Data Clustering: A Review”,
ACM Computing Surveys, Volume 31(3), 1999, pp.
264-323
[3] P. Berkhin, “A Survey of Clustering Data Mining Techniques” Kogan,
Jacob; Nicholas, Charles; Teboulle, Marc (Eds) Grouping Multidimensional Data, Springer Press (2006) 25-72
[4] A. K. Jain and R. C. Dubes, “Algorithms for Clustering Data”, Prentice Hall, 1988.
[5] J. Han and M. Kamber, “Data Mining: Concepts and Techniques,” Morgan Kaufmann Publishers, 2001. (2002) The IEEE website. [Online]. Available: http://www.ieee.org/
[6] J. McQueen, “Some methods for classification and analysis of multivariate observations”, Proc. of 5th Berkeley Symposium on Mathematics, Statistics and Probability, Volume 1, 1967, pp. 281-298.
[7] KAUFMAN, L. and ROUSSEEUW, P. 1990. Finding
[8] NG, R. and HAN, J. 1994. Efficient and effective clustering methods for spatial data mining. In Proceedings of the 20th Conference on VLDB, 144-155, Santiago, Chile.J. Padhye, V. Firoiu, and D. Towsley, “A stochastic model of TCP Reno congestion avoidance and control,” Univ. of Massachusetts, Amherst, MA, CMPSCI Tech. Rep. 99-02, 1999.
[9] Zhang T., Ramakrishnan R. and Livny M.: BIRCH: An efficient data clustering method for very large databases. In Proc. of SIGMOD96
[10] KARYPIS, G., HAN, E.-H., and KUMAR, V. 1999a. CHAMELEON: A hierarchical clustering algorithm using dynamic modeling, COMPUTER, 32, 68-75. [11] Ester M., Kriegel HP., Sander J., Xu X.: A density-based
algorithm for discovering clusters in large spatial databases with noise. Second International Conference on Knowledge Discovery and Data Mining (1996) [12] Guha S., Rastogi R., Shim K.: CURE: An efficient
clustering algorithm for large databases. Proc. Of ACM SIGMOD Conference (1998)
[13] HINNEBURG, A. and KEIM, D. 1998. An efficient approach to clustering large multimedia databases with noise. In Proceedings of the 4th ACM SIGKDD, 58-65, New York, NY.
[14] M. Ankerst, M.M.Breunig, H.-P. Kriegel, J.Sander, “OPTICS: Ordering points to identify the clustering structure”, inproceedings of ACM SIGMOD Conference,
1999 pp. 49-60.
[15] WANG, W., YANG, J., and MUNTZ, R. 1997. STING: a statistical information grid approach to spatial data mining. In Proceedings of the 23rd Conference on VLDB, 186-195, Athens, Greece.
[16] AGRAWAL, R., GEHRKE, J., GUNOPULOS, D., and RAGHAVAN, P.1998. Automatic subspace clustering of high dimensional data for data mining applications. In Proceedings of the ACM SIGMOD Conference, 94-105, Seattle, WA.
[17] Sheikholeslami G., Chatterjee S., Zhang A.:
Wavecluster: A multi resolution clustering approach for very large spatial databases. Proc. Of Very Large Databases Conference (1998)
AUTHORSBIOGRAPHY
Ms.D.Geetha has around 12 years of teaching experience
in Computer Science and also has worked as Techno-Functional Consultant in IT industry. She has guided the post graduate students to complete real time projects and also guides research scholars in Computer Science. She has published papers in various international journals and presented papers in National and International Conferences. At present, she is working as Assistant Professor in the Department of MCA at Sree Saraswathi Thyagaraja College, Pollachi, TamilNadu, India.
Miss. S. Jency has completed her post graduate in MCA.