Detection of Black Hole Attack in Wireless Sensor
Networks Using Support Vector Machine
Manish Kumar1
1
Research scholarDepartment of computer sciencesJJT University ,Jhunjhun,Rajasthan
Abstract: The research demonstrates simulation of black hole attack in wireless sensor networks in NS2. A node is suspected to be malicious in case there is a large drop of packets by the node and as a result very few or none of the packets are allowed to reach the destination. In the first case a modified AODV protocol is presented for wireless network. The modification allows the creation of black hole node in the network and advanced dynamic routing in the simulating environment. Thereafter detecting the same by making use of random forest confusion table and contingency table generated by the classification model trace file created during simulation.
Keywords: Black hole; Wireless sensor network; AODV, malicious; SVM; Contingency, confusion
I. INTRODUCTION
inother words in the absence of black hole attack. The trace files are generated by monitoring the network behavior during transmission against each case. The analysis of generated trace files for the mentioned cases was carried out using a classification model based on support vector machine and correlation leading to the prediction of a suspected node as a black hole. The features including total packets send, received, forwarded and dropped at each hop were monitored, recorded and provided as an input to the classification model.
II. THEMODEL
In the research a homogeneous WSN environment is considered. Which consist of network nodes with similar hardware and software configuration? The simulating environment is assumed to possess symmetricity in which node can only communicate with another node subject to the condition there exists a bidirectional communication between node Y and X. All the nodes in the network were defined to have the same operating characteristics. Which includes similar transmission power (tx), antenna height (H) and antenna gain (G) throughout the network lifetime. All nodes are assigned a unique identification number better known as node identifier and have fixed geographical position. The geographical position of each node can be obtained using a GPS positioning system. The value of a geographical position of each node as well as it’s identify arisen capsulated in each of the message packet its ends. It is also as summed that message exchanges in the network are en cr ypted in order to pr ovide necessar y security in the n etwork . The radio propagation is further assumed to follow well-defined models including the Free Space Model and the Two- Ray Ground Model [6]. They specify how the values of transmission power, received signal strength and distance between the transmitter and the receiver relate to each other. In this paper a wireless sensor network is supposed to satisfy following:
1) Homogenity1 in which all nodes in the network are having same configuration.
2) Static2 All the nodes in the network are having predefined fixed coordinates and they do not change their position once deployed.
3) Symmetricity3 The simulating environment is assumed to be symmetric in which the node X can only communicate with node Y, in case Y is also able to communicate with X.
Finally, it is assumed that malicious nodes are capable of performing black hole internal attack only. The presence of a malicious node is confirmed in case there is large difference in the number of packets sent by the source and the packets received by the predefined destination node. Under mentioned conditions anode can be classified under the category of suspicious or non suspicious.
III. SIMULATIONMODEL
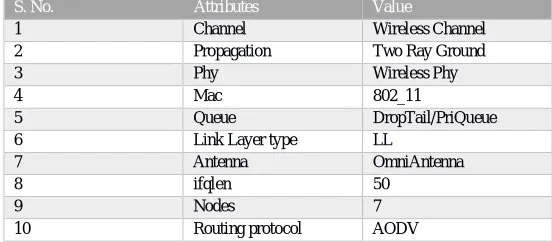
[image:3.612.167.443.603.724.2]The network simulator NS2 is used to simulate the wireless sensor network environment in order to evaluate the data and carry out necessary analysis. The wireless sensor network is created with the properties as described in the table (1) where the channel or the medium for transmission is wireless, the propagation is set to be Two ray ground making an assumption that a signal sent from one node to another does not travel in a straight line or a unique path but eventually also through a reflection in the ground as well, topology used is wireless physical. The address associated with each node is of type MAC in accordance to IEEE standard 802.11. The Improvement of performance at the destination node by applying different types of queues at the routers observed. The drop tail queue with priority is implemented where drop of packets can only take place at the rare end of the queue. The relationship between congestion and the packet drops states that congestion can be reduced at the link node by appropriate selection of queue type at the link node [7].
Table 1. Shows the wireless sensor network configuration
S. No. Attributes Value
1 Channel Wireless Channel
2 Propagation Two Ray Ground
3 Phy Wireless Phy
4 Mac 802_11
5 Queue DropTail/PriQueue
6 Link Layer type LL
7 Antenna OmniAntenna
8 ifqlen 50
9 Nodes 7
All the nodes are located on a grid of 900 X 900 field with well-defined specific x and y coordinates. The nodes are located in such a way that no two nodes share the same coordinates on the grid as shown in fig.(1).
Fig(1). Showing the deployment of seven nodes in the wireless sensor network
The N number of nodes was used in the simulation. Where N = {n_0, n_1, n_2, n_3, n_4, n_5, n_6}. The node n_0 is defined as source node, the node n_5 as malicious black hole attack node and node n_3 is defined as destination node also known as sink node. The traffic is sent by the source node n_0 to the sink node n_3 over multiple hops in the network.
IV. RESULTS
The simulation was run for 100 ms with packet size = 1000, traffic type = CBR (Constant bit rate), traffic rate =0.1Mbs. The AODV (Ad hoc on demand) routing protocol after making necessary modification is used to perform the desired routing of packets from source to sink node and following observations were made.
Fig.2. Showing the random forest plot of nodes in presence of black hole attack.
Fig.3. Showing the random forest plot of nodes in the absence of black hole attack.
[image:5.612.155.464.332.451.2]The three levels as 1,2 and 3 in random forest plot of nodes as shown in fig.2. clearly shows no drop of packet at any level in the tree. It is clear confirmation of absence of black hole in the wireless sensor network
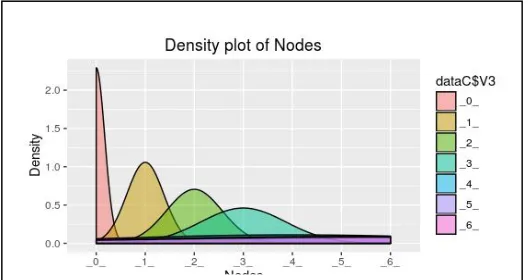
Fig 4: Showing the density plot of nodes in presence of black hole attack.
Fig 5: Showing the density plot of nodes in absence of black hole attack
It can be clearly observed the low density peak in fig(4) at destination node indication of no packets reaching the destination (n_3) as there is black hole
present in network.
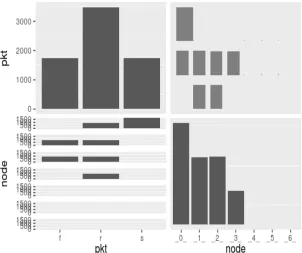
[image:5.612.175.439.483.623.2]Fig.6. Showing the in presence of black hole attack
Fig 7: Showing the in absence of black hole attack
[image:6.612.151.453.391.644.2]Table 2: showing total packets send, received, forwarded, dropped and packet density ratio during different intervals in the presence of black hole attack.
S.no Run time
Send Received Forwarded Dropped Packet density ratio
1 0-10 113 452 228 113 901.769
2 10-20 238 952 478 238 428.151
3 20-30 363 1452 728 363 280.716
4 30-40 488 1952 978 488 208.811
5 40-50 613 2452 1228 613 166.231
6 50-60 738 2952 1478 738 138.075
7 60-70 863 3452 1728 863 118.076 8 70-80 988 3952 1978 988 103.137 9 80-90 1113 4452 2228 1113 91.554 10
90-100
1238 4952 2478 1238 82.310
The increase in the drop of packets was observed in the presence of black hole attack while the simulation was run over period of 100ms.The number of packets dropped were found to be equal to the number of packets being sent by the source node as shown in table (2).
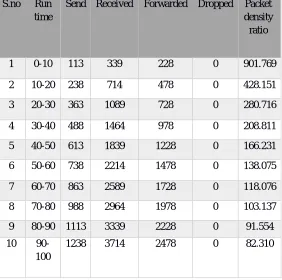
Table 3: Showing total packets send, received, forwarded, dropped and packet density ratio during different intervals in the absence of black hole attack.
S.no Run time
Send Received Forwarded Dropped Packet density ratio
1 0-10 113 339 228 0 901.769
2 10-20 238 714 478 0 428.151
3 20-30 363 1089 728 0 280.716
4 30-40 488 1464 978 0 208.811
5 40-50 613 1839 1228 0 166.231
6 50-60 738 2214 1478 0 138.075
7 60-70 863 2589 1728 0 118.076
8 70-80 988 2964 1978 0 103.137
9 80-90 1113 3339 2228 0 91.554
10 90-100
1238 3714 2478 0 82.310
[image:7.612.167.449.405.685.2]The predicted contingency table in the presence of black hole attack by the SVM model is shown in table (4). It is observed that the total number of packets sent by the source node (n_0) = 1238, the number of packets received by the sink node (n_3) = 0 as there is drop of 1238 packets at the black hole node (n_5).
Table 4: Showing the packets dropped, forwarded, received; send as per the contingency table in presence of black hole attack.
S. No. Nodes D F R S
1 n_0 0 2 1256 1238
2 n_1 0 1238 1857 0
3 n_2 1238 0 1857 0
4 n_3 0 0 0 0
5 n_4 0 0 0 0
6 n_5 0 0 0 0
7 n_6 0 0 0 0
The predicted contingency table was generated without black hole attack by the SVM model as shown in table (5). It is observed that the total number of packets sent by the source node (n_0) = 1238, the number of packets received by the sink node (n_3) =1238 as there was no drop in packets in the absence of black hole attack.
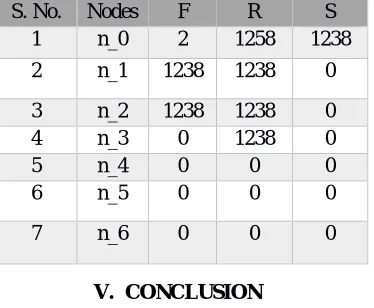
Table 5: Contingency table showing the packets dropped, forwarded, received; send in absence of black hole attack.
S. No. Nodes F R S
1 n_0 2 1258 1238
2 n_1 1238 1238 0
3 n_2 1238 1238 0
4 n_3 0 1238 0
5 n_4 0 0 0
6 n_5 0 0 0
7 n_6 0 0 0
V. CONCLUSION
1) The drop in the density curve can clearly be observed with respect to time while the packets travel from source (n_0) to sink node (n_3) as shown in fig (4). This drop in the density curve is a clear indication of the presence of some malicious activity during the transmission. The low peaks in the density curve for node (n_3), (n_4), (n_5) and (n_6) proves these nodes are either malicious or not present in the route to the destination.
2) There is a no drop in the density curve with respect to time once the packets travel from source (n_0) to sink node (n_3) as shown in fig (4). This no drop condition in the density curve clearly depicts the absence of any malicious activity during the transmission.
3) The plots shown in the fig(2) and fig(6) support the fact that there is a malicious node present in the network as indicated by the drop field presence and fig(6) and fig(7) clearly indicate the absence of drop field in the data in the absence of malicious node.
4) The SVM model was able to predict the malicious node (n_5) from the suspected nodes n_3, n_4, n_6 with great accuracy using the trace file data.
REFERENCES
[1] Berkeley MICA mote. http://webs.cs.berkeley.edu/tos/hardware/hardware.html, 2003.
[2] J. M. Kahn, R. H. Katz, and K. S. J. Pister. Next century challenges: Mobile networking for “smart dust”. In International Conference on Mobile Computing
and Networking (MOBICOM), pages 271–278, 1999.
[3] AbderrahmaneBaadache, Ali Belmehdi “Avoiding-Black-Hole-and-Cooperative-Black-Hole-Attacks-in-Wireless-Ad-hoc-Networks” IJCSIS) International
[4] J. M. Kahn, R. H. Katz, and K. S. J. Pister. Emerging challenges: Mobile networking for “smart dust”. Journal of Communications and Networks, 2(3):188– 196, September 2000.
[5] Y.-C. Hu, A. Perrig, and D. B. Johnson. Packet leashes: A defense against wormhole attacks in wireless ad hoc networks. Proceedings of the 22nd Annual Joint
Conference of the IEEE Computer and Communications Societies (INFOCOM 2003), April 2003.
[6] T. S. Rappaport. Wireless communications: principles and practice. Prentice Hall, 2nd edition, 2002.