A comparison of feature extraction
methods for the classification of dynamic
activities from accelerometer data
Preece, SJ, Goulermas, JY, Kenney, LPJ and Howard, D
Title
A comparison of feature extraction methods for the classification of
dynamic activities from accelerometer data
Authors
Preece, SJ, Goulermas, JY, Kenney, LPJ and Howard, D
Type
Article
URL
This version is available at: http://usir.salford.ac.uk/12578/
Published Date
2009
USIR is a digital collection of the research output of the University of Salford. Where copyright
permits, full text material held in the repository is made freely available online and can be read,
downloaded and copied for noncommercial private study or research purposes. Please check the
manuscript for any further copyright restrictions.
A Comparison of Feature Extraction Methods for the Classification
of Dynamic Activities from Accelerometer Data
S. J. Preece, J. Y. Goulermas, L. P. J. Kenney, D. Howard
Abstract
Driven by the demands on healthcare resulting from the shift towards more sedentary lifestyles considerable effort has been devoted to the monitoring and classification of human activity. In previous work, various classification schemes and feature extraction methods have been used to identify different activities from a range of different datasets. In this paper, we present a comparison of fourteen methods to extract classification features from accelerometer signals. These are based on the wavelet transform and other well-known time- and frequency-domain signal characteristics. To allow an objective comparison between the different features, we used two datasets of activities collected from twenty subjects. The first set comprised three commonly used activities, level walking, stair ascent and descent and the second a total of eight activities. Furthermore, we compared the classification accuracy for each feature set across different combinations of three different accelerometer placements. The classification analysis has been performed with robust subject-based cross-validation methods using a Nearest-Neighbour classifier. The findings show that, although the wavelet transform approach can be used to characterise non-stationary signals, it does not perform as accurately as frequency-based features when classifying dynamic activities performed by healthy subjects. Overall, the best feature sets achieved over 95% inter-subject classification accuracy.
1. Introduction
with the trend towards more sedentary lifestyles there is a growing interest in the link between levels of physical activity and common health problems, such as diabetes, cardiovascular disease and osteoporosis [3]. As self reported measures have been shown to be unreliable [4, 5], systems for activity profiling are beginning to play an important role in large-scale epidemiological studies in this area [6, 7]. Furthermore, such systems can also be used to assess the effectiveness of different interventions aimed at increasing levels of physical activity and for motivating individuals to become more physically active.
The success of a given rehabilitation programme is often judged by not only the levels of activity, but also the type of activity that an individual can return to after treatment. In addition, as fall risk increases with age, so a better understanding of the factors contributing to fall risk becomes more important. Ambulatory monitoring of various activities, including the time spent in sit-stand transitions have shown promise as predictors of fall-risk [8]. Further, both type and intensity of individuals’ activity are of interest to urban designers, and designers, manufacturers and purchasers of certain medical devices (e.g. advanced responsive pacemakers and orthopaedic implants).
In addition to health-related applications, portable systems which can accurately identify the activity of the user have the potential to play a fundamental role in a ubiquitous computing scenario [9, 10]. In this field, computing devices use information from a variety of sensors to determine the context of a situation. Different devices can then use the context information to deliver an appropriate service. For example, a mobile phone may detect when a person is driving a vehicle and automatically divert a call.
different activities. Previous studies have shown machine learning or artificial intelligence approaches to be effective for identifying a range of different activities from body-fixed sensor data [11-14]. These techniques typically operate via a two-stage process [15]. Firstly, features are derived from windows of accelerometer data. A classifier is then used to identify the activity corresponding to each separate window of data. A range of different approaches has been used to obtain features from accelerometer data, with some researchers deriving features directly from the time-varying acceleration signal [12, 16-18] and others from a frequency analysis [11, 13, 19, 20]. More recently wavelet analysis has been used to derive so-called time-frequency features [14, 21-24].
With wavelet analysis the original signal is decomposed into a series of coefficients which carry both spectral and temporal information about the original signal. From these coefficients, it is possible to identify localised temporal instances at which there is a change in frequency characteristics of the original signal [25]. This concept has been applied successfully to accelerometer signals in order to identify points in the signal at which the subject changes from one activity to another [22, 24]. As well as being used to locate discrete temporal events, wavelet analysis can also be used to derive time-frequency features which characterise the original signal. However, it is not clear whether such time-frequency features lead to more effective activity classification than the more commonly used time-domain or frequency-domain features.
challenging problem. Additionally, since the performance of a given set of features can be dependent on the location of the monitor, we compared accuracy for the different features across a number of different lower limb placements. It was felt that this work would underpin the development of an off-the-shelf activity monitor which could be used to classify activity patterns across different subjects.
2. Methods
2.1 Data collection
Accelerometer data was collected using Pegasus activity monitors developed by ETB, UK. Each of these units contained a tri-axial accelerometer, with dynamic range of ±5g, which was sampled a with 10-bit resolution. With these devices it is possible to sample accelerometer data at a user-defined frequency and to store this data for up to 24 hours. A sampling frequency of 64Hz was selected for this study as this is sufficiently larger than the 20Hz sampling required to assess daily activity [26]. A number of previous activity classification studies have used wavelet analysis to derive features from accelerometer signals collected at relatively high sampling frequencies (>250Hz). However, for this study 64Hz was chosen as this is a realistic sampling frequency which could be implemented by an off-the-shelf activity monitor. No anti-aliasing filtering was applied to the acceleration data.
Ten male and ten female subjects participated in the study. As large individual variation has been reported for accelerometer signals corresponding to the same activity [27], subjects with a range of ages and body mass indices were recruited into the study. The mean (SD) age of the subjects was 31 (7) years, mean (SD) height was 1.71 (0.07) m and the mean (SD) weight was 68 (10) Kg. The subjects covered a wide range of body mass index from 19-30 with mean (SD) 24 (3). Each subject gave informed consent to participate in the trial after approval had been obtained from the ethical committee at the University of Salford.
A number of studies have shown that static postures can be differentiated from dynamic activity by applying a single threshold to some measure of acceleration variability [28, 29]. Provided sensors are attached to more than one body segment, it is possible to accurately identify different static postures using a threshold-based approach [30, 31]. However, the situation is more complicated with only a single sensor. In this scenario, more complex signal processing along with an appropriate biomechanical model is required to differentiate
between different postures, postural transitions and continuous dynamic activity [32]. For this study we chose to investigate the classification of continuous dynamic activities. This choice was motivated by previous work which have used a range of different features to
characterise acceleration signals [11, 14, 16, 17, 21-24, 33-35]
To ensure that there was sufficient data to address the first research question, the circuit involved stair walking both inside and outside the building as well as level walking in a number of different environments. In addition to these three everyday activities, both jogging and running were also included in the circuit. For the first of these two activities, subjects were instructed to perform a gentle jog over a 50m distance and for the second to perform a fast run over the same distance. Both these activities have been used in previous classification studies [11, 12, 36] and their recognition could prove invaluable in any activity monitoring system for sports rehabilitation. We wanted to collect data across a range of different modes of locomotion and there included three additional activities: hopping (on each leg) and jumping. Both hopping [37] and jumping [36] have been used in previous activity monitoring studies and are also used in sports rehabilitation. In order to include each of these activities as part of the circuit each subject was required to hop (on each leg separately) over a 15m distance and to jump, moving both legs together, over the same distance.
Once activity transition points had been identified, features were calculated from two-second (128-sample) consecutive windows which overlapped by one second. The use of a 50% overlap between successive sliding windows has been shown to be effective in previous studies of activity classification [11, 38]. The choice of a two-second window was motivated by previous studies which had used similar length windows, Nyan et al. [24] (2 seconds) and Wang et al. [14] (2.56 seconds). It was not possible to use shorter windows as signals with less than 128 samples could not be fully decomposed into wavelet coefficients appropriate for comparison with other studies (see section 2.2). Longer windows limited the amount of data which could be extracted from short duration activities, such as stair walking. Pilot work also showed minimal differences between classification accuracies calculated from frequency-domain features derived from two-second or three-second windows.
If a window corresponded to a transition between two activities, it was excluded from subsequent analysis. Given the continuous nature of the circuit completed by the subjects, there was a disproportionate number of windows of data which corresponded to level walking. Therefore, in order to balance the distribution of the different activities, only a randomly chosen subset of these windows was used in the final analysis.
2.2 Wavelet features
coefficient. This process is repeated to the desired decomposition level. For further details see [40]
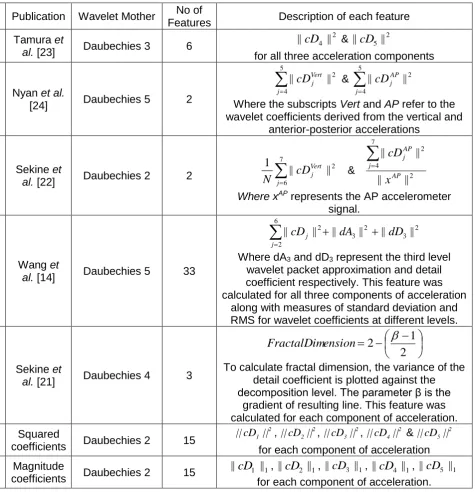
The aim of this study was to compare the performance of wavelet features with more commonly used time- and frequency-domain features. Wavelet features are normally derived from one or more of the detail coefficients which contain both temporal and frequency information on the original signal. Five separate studies were identified which had previously used wavelet features for classification of accelerometer data [14, 21-24]. These studies were then used as a basis for defining seven sets of wavelet features (Table I).
The first set of wavelet features was proposed by Tamura et al. [23]. With this approach the accelerometer signal is decomposed using the wavelet transform and the features defined as signal power measurements, calculated as the sum of the squared detail coefficients at levels 4 and 5. Tamura et al. [23] sampled acceleration data at 250Hz. Given our lower sampling frequency of 64Hz, we calculated the two features from detail coefficients corresponding to the same frequency bands as those used by Tamuras et al. [23]. This process of identifying corresponding wavelet coefficients for our lower sampling frequency was performed for all other wavelet feature sets where needed
wavelet decomposition, our preliminary investigation showed improved classification with a Daubechies wavelet mother. This was therefore used for subsequent analysis. Both Nyan et al. [24] and Sekine et al. [22] collected data at 256Hz, therefore as before, wavelet coefficients corresponding to appropriate frequency bands were used to calculate of each of the features.
Most previous activity classification studies have used wavelet analysis to derive only a small number of features. In contrast Wang et al. [14] used wavelet packet analysis to derive 33 features from a tri-axial accelerometer signal. With wavelet packet analysis, the detail coefficients are split into a further approximation and detail coefficient. This allows additional information to be extracted from the original signal. The features suggested by Wang et al.
[14] involved summing the squares of the detail coefficient and wavelet packet approximation coefficients across different levels. In addition, they calculated standard deviations and RMS values of detail and wavelet packet approximation coefficients at a number of different levels. In their study, Wang et al. [14] sampled accelerometer data at 50Hz, therefore our data was resampled to this frequency.
In addition to the five sets of wavelet features described above, we experimented with some alternative wavelet features. Two additional features sets were then included in this study (Table I). For both of these feature sets, each component of the 64Hz tri-axial acceleration signal was decomposed to five levels using a Daubechies 2 wavelet mother. A sixth wavelet feature set was then defined as the sum of the squared detail coefficients at levels 1 to 5. These five features were calculated for each component of acceleration, thus giving a total of 15 features. The seventh feature set was obtained in a similar way, but the sums of the absolute values were used to provide a different type of combining norm. All wavelet features in Table I, were derived for every window of accelerometer data using Matlab ver.7.4 (The Mathworks, USA).
2.3 Time and frequency-domain features
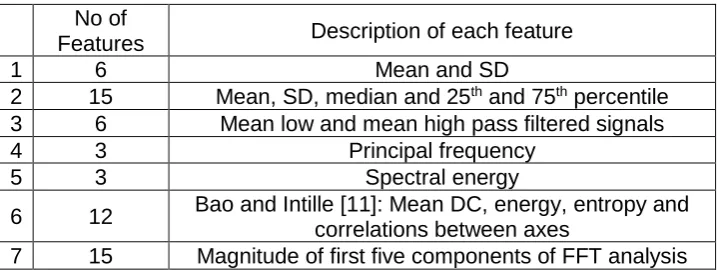
For additional comparison, we also employed three sets of time-domain features and four sets of frequency-domain features (Table II). Within each of these seven sets, the features were derived individually for each of the three components of the tri-axial accelerometer signal. Mean and standard deviation (SD) have been used in previous studies [34] to characterise windows of accelerometer data. As an extension to this set we defined the multiple statistics features set which additionally included median and 25th and 75th percentile [33]. Low pass filtering is commonly used to separate the DC and AC components of an accelerometer signal [42]. Previous studies have defined features as the mean DC and the mean of the rectified AC signal [16, 17]. These two statistics were therefore used to define the third set of time-domain features.
FFT coefficients [11, 43]. A recent study carried out by Bao and Intille [11] obtained high levels of classification accuracy using a mixed set of time and frequency-domain features. Therefore this was included as the sixth set of features. In addition to spectral energy, Bao and Intille [11] included DC, correlations between axes and frequency-domain entropy. This latter feature gives a measure of the normalised information entropy of the FFT components and allows for differentiation between activities which have simple acceleration patterns and those with more complex patterns [11]. The final frequency-domain feature set was defined as the magnitude of the first five components of the FFT power spectrum. As with the other feature sets, this set of parameters was derived separately for each of the three components of acceleration. Although it is more common to use the power spectrum of FFT coefficients, preliminary work showed that the magnitudes gave improved accuracy and were therefore used for the final analysis.
2.4 Activity classification
to compare the performance of two sets of features, the Mann-Whitney U test was used to test for differences in the two distributions of train-test accuracies. This test was chosen as it was not possible to guarantee that these distributions were normally distributed. A significance level of p<0.01 was used throughout.
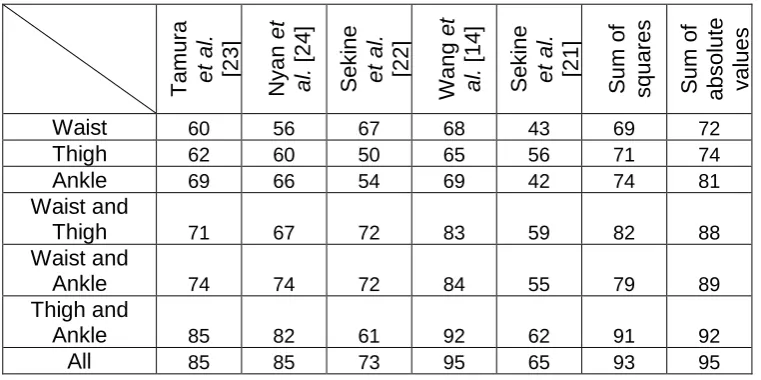
To address our first research aim, only windows of data which corresponded to level walking, stair ascent and stair descent where included in the analysis. For this three-activity classification problem, accuracy was determined for the waist-mounted accelerometer for each of the seven sets of wavelet features and for each of the seven sets of time/frequency features. This process was then repeated for the thigh and then the ankle-mounted sensor. To establish whether it would be possible to improve classification accuracy using data from more than one sensor, the analysis was performed for all seven possible combinations of the three sensors (as shown in the first column of Table III). Once classification accuracies had been determined for the three-activity problem, the process was repeated with windows of accelerometer data from all eight activities.
3. Results
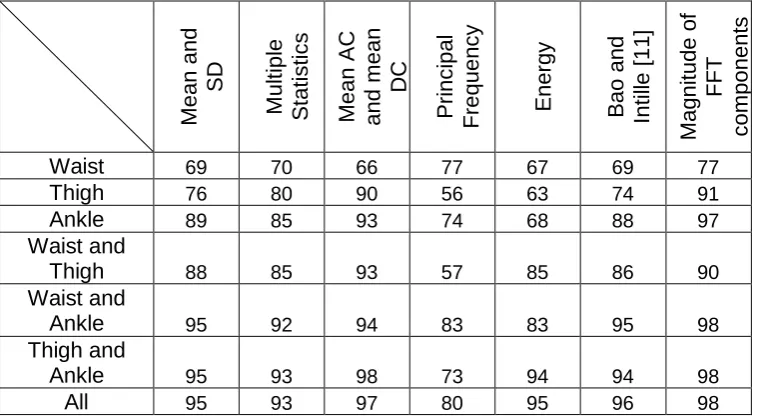
In order to establish whether, in general, the time/frequency features outperformed the wavelet features, a number of statistical tests were performed. Firstly, the performance of the best set of time/frequency features was compared with the best set of wavelet features for each sensor configuration. With the exception of the waist-mounted sensor, the time/frequency feature sets significantly outperformed the wavelet features sets (p<0.01) in every case (table III and IV). Further testing was then carried out by comparing the second best performing time/frequency feature set with the second best performing wavelet feature set, again for every sensor configuration. These tests also showed the time/frequency feature sets to significantly outperform the wavelet feature sets in every case (p<0.01).
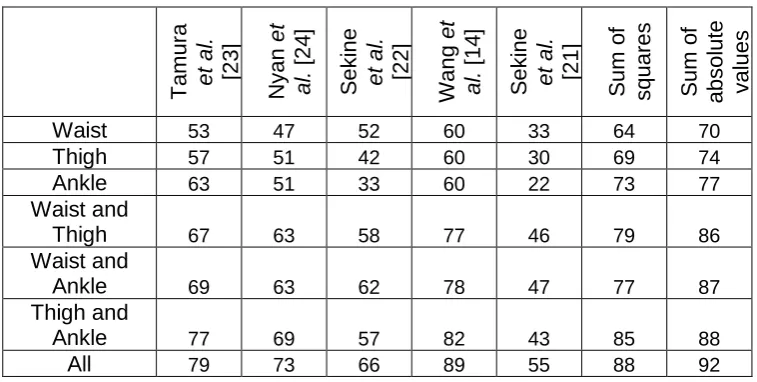
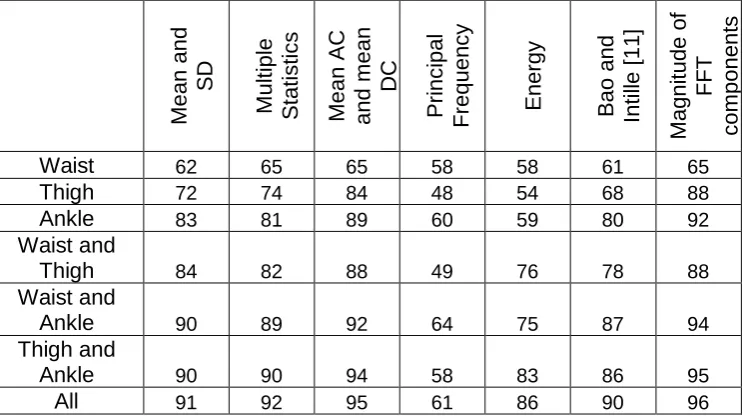
The results of the eight-activity classification problem displayed similar trends to the three-activity problem for both the wavelet features (Table V) and the time/frequency features (Table VI). Again, the highest wavelet classification accuracies, for each of the sensor configurations, were obtained using the sum of the absolute values (Table V). However, the performance of this feature set was, in some cases, not significantly better than the sum of the squares feature set. For the time/frequency features, maximal classification accuracy for a single sensor (92±7%) was again obtained when the individual FFT components were derived from the ankle-mounted unit (Table VI). However, this distribution of accuracies was not significantly different to those obtained using FFT coefficients derived from the thigh-mounted sensor (p=0.16). Again, to determine whether differences in accuracy existed between the two types of features, comparisons were made between the best and second best performing time/frequency and wavelet features. These comparisons showed that, with the exception of features derived from a waist mounted sensor, the time/frequency features significantly outperformed the wavelet features (p<0.01) (Table V and VI).
all activities. To investigate this further sensitivity and specificity were calculate separately for each of the eight activities for the ankle-mounted sensor with the best performing wavelet feature set (sum of the absolute values) and the best performing time/frequency feature set (magnitude of the FFT components). This comparison (Table VII) shows that, for each of the different activities, the FFT feature set outperforms the wavelet feature set.
4. Discussion
This study was designed to compare the discriminative ability of wavelet features with time/frequency features for two activity classification problems: a simple three-activity problem and an eight-activity problem. In addition, classification accuracies were compared for three individual lower limb placements, the waist, thigh and ankle, as well as some of their combinations. In general, similar levels of accuracy were found when data from a waist-mounted sensor was used to obtain either time/frequency or wavelet features. However, for both the ankle and thigh-mounted sensor, time/frequency features significantly outperformed the wavelet features. For both classification problems, the optimal accelerometer placement for a single sensor was shown to be on the ankle.
Five previous studies were identified which had used wavelet features to discriminate between level walking, stair ascent and stair descent. Of these five studies, only Nyan et al.
supervision. In their study, Nyan et al. [24] collected data using two shoulder-mounted accelerometers so their results are not directly comparable to those in the current study.
Wang et al. [14] studied levelling walking, stair ascent/descent and walking up/down a slope using data collected from a waist-mounted accelerometer. Using a MLP Neural Network classifier they obtained classification accuracies of 89-92% for these five activities. However, in their study, an individual normalisation scheme was used in which the features were divided by those obtained from a five second flat walking session. When unadjusted features were used for classification, similar levels of accuracy to those found in the current study were obtained.
In order to minimise computational power requirements, activity classification algorithms typically work with relatively short windows of sensor data. As these windows typically correspond to a single activity, the frequency content of the signal varies little with time. Wavelet analysis allows for the analysis of non-stationary signals. However, it is not clear whether parameters derived from wavelet coefficients, represent a more effective means of characterising short windows of data than standard frequency-domain techniques. In this study data was collected from 20 healthy subjects. Analysis of this data showed that features derived from an FFT analysis outperformed those derived from wavelet coefficients. This may reflect the suitability of standard frequency-domain techniques for characterising the short duration stationary signals, which were characteristic of our subject group.
current study, this set normally outperformed the other time-domain features and often gave comparable accuracy to the FFT component feature set.
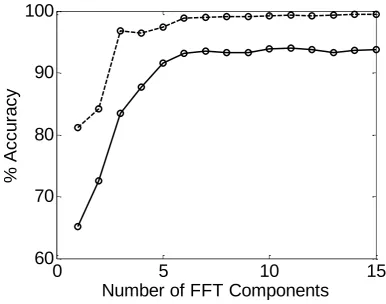
The highest classification accuracy for a single sensor was obtained for the FFT component feature set and the ankle-mounted sensor. This feature set consistently outperformed both the energy feature and the larger set proposed by Bao and Intille [11]. As they studied a larger range of activities than those of the current study, direct comparison of classification accuracies is not possible. However, their reported maximum classification accuracy of 84% using data from five sensors is similar to the maximum accuracy (90%) achieved in our study for the eight-activity problem. Huynh and Schiele [37] also compared the discriminative ability of individual FFT components with simple time-domain features, spectral energy and spectral entropy for a range of activities including walking, jogging and hopping. In agreement with this study, they found the FFT component to have higher discriminative ability than the other features. However, they were unable to identify a single component which performed best for each activity. Although, in the present study, the first five components were used as input to the classifier, it is possible to use a larger or smaller number of components. Figure 3 illustrates how the classification accuracy changes as the number of components varies. It can be seen that using the first six components produces maximal accuracy for both the three-activity and eight-activity problems. Although, for the three-activity problem, an almost perfect result is achieved, with the eight-activity problem a maximum accuracy of only 94% is possible. Inspection of the corresponding confusion matrix (Table VIII) showed that jumping was often confused with a number of the other activities. When this activity was excluded the accuracy increased to 97%.
in this study, was selected as it was believed to be more accurate than self observation by the subject. Another limitation is that only relatively young, healthy subjects were included in the study. Clearly it is not possible to generalise our findings, that frequency-domain features perform better than wavelet features, to other subject groups, such as the elderly or patients with neurological impairment. For such individuals, jerkiness of movement may lead to isolated frequency transients which maybe better characterised using wavelet features. Further work is thus needed to determine the most appropriate features for activity classification for different patient groups.
For this study a single classifier (kNN) was used to evaluate the discriminatory ability of the different feature sets. Although it is possible to use other methods to identify optimal features, this method was chosen for its simplicity, flexibility and popularity. In general, different classifiers can have different subsets of optimal features and a larger evaluation study would be needed to perform comparisons between different classifiers.
5. Conclusion
References
1. K. Aminian and B. Najafi, "Capturing human motion using body-fixed sensors:
outdoor measurement and clinical applications," Comp. Anim. Virtual Worlds, vol. 15, pp. 79–94, 2004.
2. W. Zijlstra and K. Aminian, "Mobility assessment in older people: new possibilities and challenges," Eur. J. Aging, vol. 4, pp. 3-12, 2007.
3. World Health Organization Global strategy on diet, physical activity and health, Geneva, 2004.
4. R. A. Washburn and H. J. Montoye, "The assessment of physical activity by questionnaire," Am. J. Epidemiol., vol. 123, pp. 563-576, 1986.
5. B. E. Ainsworth, D. R. Jacobs, Jr. and A. S. Leon, "Validity and reliability of self-reported physical activity status: the Lipid Research Clinics questionnaire," Med. Sci.
Sports Exerc., vol. 25, pp. 92-98, 1993.
6. C. J. Riddoch, C. Mattocks, K. Deere, J. Saunders et al., "Objective measurement of levels and patterns of physical activity," Arch. Dis. Child., vol. 92, pp. 963-969, 2007. 7. R. R. Pate, K. A. Pfeiffer, S. G. Trost, P. Ziegler et al., "Physical activity among
children attending preschools," Pediatrics, vol. 114, pp. 1258-1263, 2004.
8. B. Najafi, K. Aminian, F. Loew, Y. Blanc et al., "Measurement of stand-sit and sit-stand transitions using a miniature gyroscope and its application in fall risk evaluation in the elderly," IEEE Trans. Biomed. Eng., vol. 49, pp. 843-851, 2002.
9. N. Streitz and P. Nixon, "The disappearing computer," Commun. ACM., vol. 48, pp. 32-35, 2005.
10. J. Coutaz, J. L. Crowley, S. Dobson and D. Garlan, "Context is key," Commun. ACM., vol. 48, pp. 49-53, 2005.
11. L. Bao and S. S. Intille, "Activity recognition from user-annotated acceleration data,"
12. U. Maurer, A. Rowe, A. Smailagic and D. Siewiorek, "Location and activity recognition using eWatch: A wearable sensor platform," Ambient Intelligence in Everday Life,
Lecture Notes in Computer Science, vol. 3864, pp. 86-102, 2006.
13. J. Parkka, M. Ermes, P. Korpipaa, J. Mantyjarvi et al., "Activity classification using realistic data from wearable sensors," IEEE Trans. Inf. Technol. Biomed., vol. 10, pp. 119-128, 2006.
14. N. Wang, E. Ambikairajah, N. H. Lovell and B. G. Celler, "Accelerometry based classification of walking patterns using time-frequency analysis," in 29th Annual Conf.
of the IEEE Engineering in Medicine and Biology Society (Lyon), 2007, pp.4899-4902.
15. S. J. Preece, J. Y. Goulermas, L. P. J. Kenney, K. Meijer et al., "Activity identification using body-mounted sensors – a review of classification techniques," Submitted to
Physiol. Meas., 2008.
16. J. Fahrenberg, F. Foerster, M. Smeja and W. Muller, "Assessment of posture and motion by multichannel piezoresistive accelerometer recordings," Psychophysiology, vol. 34, pp. 607-612, 1997.
17. J. Fahrenberg, W. Muller, F. Foerster and M. Smeja, "A multi-channel investigation of physical activity," Psychophysiology, vol. 10, pp. 209-217, 1996.
18. F. R. Allen, E. Ambikairajah, N. H. Lovell and B. G. Celler, "Classification of a known sequence of motions and postures from accelerometry data using adapted Gaussian mixture models," Physiol. Meas., vol. 27, pp. 935-951, 2006.
19. T. Prill and J. Fahrenberg, "Simultaneous assessment of posture and limb
movements (e.g., periodic leg movements) with calibrated multiple accelerometry,"
Physiol. Meas., vol. 27, pp. N47-53, 2006.
20. S. J. Preece, J. Y. Goulermas, L. P. J. Kenney and D. Howard, "A comparison of different feature generation methods in activity classification," in Proc. ICAMPAM
21. M. Sekine, T. Tamura, M. Akay, T. Fujimoto et al., "Discrimination of walking patterns using wavelet-based fractal analysis," IEEE Trans. Neural Syst. Rehabil. Eng., vol. 10, pp. 188-196, 2002.
22. M. Sekine, T. Tamura, T. Togawa and Y. Fukui, "Classification of waist-acceleration signals in a continuous walking record," Med. Eng. Phys., vol. 22, pp. 285-291, 2000. 23. T. Tamura, M. Sekine, M. Ogawa, T. Togawa et al., "Classification of acceleration
waveforms during walking by wavelet transform," Meth. Inform. Med., vol. 36, pp. 356-359, 1997.
24. M. N. Nyan, F. E. Tay, K. H. Seah and Y. Y. Sitoh, "Classification of gait patterns in the time-frequency domain," J. Biomech., vol. 39, pp. 2647-2656, 2006.
25. S. Mallat and W. L. Hwang, "Singularity detection and processing with wavelets,"
IEEE Trans. Inf. Theory, vol. 38, pp. 617-643, 1992.
26. C. V. C. Bouten, K. T. M. Koekkoek, M. Verduin, R. Kodde et al., "A triaxial
accelerometer and portable data processing unit for the assessment of daily physical activity," IEEE Trans. Biomed. Eng., vol. 44, pp. 136-147, 1997.
27. E. A. Heinz, K. S. Kunze, S. Sulistyo, H. Junker et al., "Experimental Evaluation of Variations in Primary Features Used for Accelerometric Context Recognition,"
Ambient Intelligence, Lecture Notes in Computer Science, vol. 2875, pp. 252-263,
2003.
28. M. J. Mathie, A. C. Coster, N. H. Lovell and B. G. Celler, "Detection of daily physical activities using a triaxial accelerometer," Med. Biol. Eng. Comput., vol. 41, pp. 296-301, 2003.
29. H. B. Bussmann, P. J. Reuvekamp, P. H. Veltink, W. L. Martens et al., "Validity and reliability of measurements obtained with an "activity monitor" in people with and without a transtibial amputation," Phys. Ther., vol. 78, pp. 989-998, 1998.
31. J. B. J. Bussmann, Y. M. van de Laar, M. P. Neeleman and H. J. Stam, "Ambulatory accelerometry to quantify motor behaviour in patients after failed back surgery: a validation study," Pain, vol. 74, pp. 153-161, 1998.
32. B. Najafi, K. Aminian, A. Paraschiv-Ionescu, F. Loew et al., "Ambulatory system for human motion analysis using a kinematic sensor: monitoring of daily physical activity in the elderly," IEEE Trans. Biomed. Eng., vol. 50, pp. 711-723, 2003.
33. M. Ermes, J. Parkka, J. Mantyjarvi and I. Korhonen, "Detection of daily activities and sports with wearable sensors in controlled and uncontrolled conditions," IEEE Trans.
Inf. Techn. Biomed., vol. 12, pp. 20-26, 2008.
34. P. Pirttikangas, K. Fujinami and T. Nakajima, "Feature Selection and Activity
Recognition from Wearable Sensors," Ubiquitous Computing Systems, Lecture Notes
in Computer Science, vol. 4239, pp. 516-527, 2006.
35. F. Foerster and J. Fahrenberg, "Motion pattern and posture: correctly assessed by calibrated accelerometers," Behav. Res. Methods Instrum. Comput., vol. 32, pp. 450-457, 2000.
36. K. Zhang, P. Werner, M. Sun, F. X. Pi-Sunyer et al., "Measurement of human daily physical activity," Obes. Res., vol. 11, pp. 33-40, 2003.
37. T. Huynh and B. Schiele, "Analyzing features for activity recognition," in Proc Conf. Smart objects and ambient intelligence: innovative context-aware services: usages
and technologies (Grenoble), 2005, pp.159-164.
38. K. van Laerhoven and O. Cakmakci, "What shall we teach our pants?," in Proc 4th
Int. Symposium on Wearable Computers, 2000, pp.77-83.
39. S. G. Mallat, "A thoery for multi-resolution signal decomposition: the wavelet
representation," IEEE Trans. Pattern Anal. Machine Intell., vol. 11, pp. 674-693, 1989. 40. T. Chau, "A review of analytical techniques for gait data. Part 2: neural network and
wavelet methods," Gait Posture, vol. 13, pp. 102-120, 2001.
42. D. M. Karantonis, M. R. Narayanan, M. Mathie, N. H. Lovell et al., "Implementation of a real-time human movement classifier using a triaxial accelerometer for ambulatory monitoring," IEEE Trans. Inf. Technol. Biomed., vol. 10, pp. 156-167, 2006.
43. A. Sugimoto, Y. Hara, T. W. Findley and K. Yoncmoto, "A useful method for measuring daily physical activity by a three-direction monitor," Scand. J. Rehabil. Med., vol. 29, pp. 37-42, 1997.
Figure 3
0
5
10
15
60
70
80
90
100
Number of FFT Components
%
Accu
ra
Figure Captions:
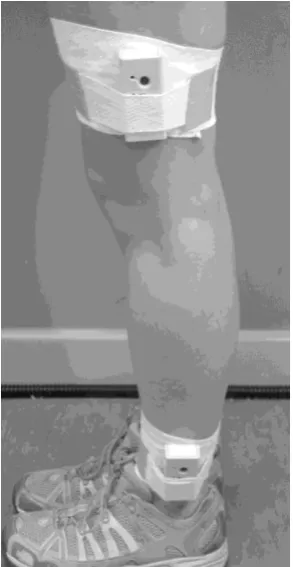
Figure 1: Activity monitors attached to the ankle and thigh.
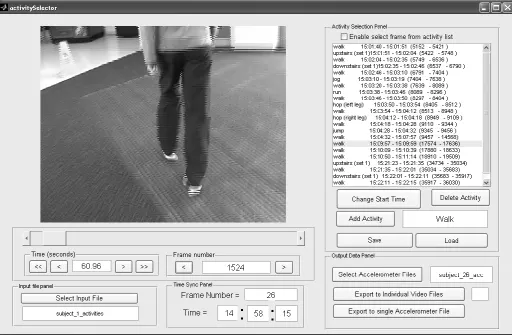
Figure 2: GUI used to annotate the accelerometer data from the video record.
Table I: Summary of the different wavelet features. The term cDj refers to the detail
coefficient at the jth level of decomposition. All other nomenclature is explained within the table.
Publication Wavelet Mother No of
Features Description of each feature 1 Tamura et
al. [23] Daubechies 3 6
2 4
||
||
cD
&||
cD
5||
2for all three acceleration components
2 Nyan et al.
[24] Daubechies 5 2
5 4 2 || || j Vert jcD &
5 4 2 || || j AP j cD
Where the subscripts Vert and AP refer to the wavelet coefficients derived from the vertical and
anterior-posterior accelerations
3 Sekine et
al. [22] Daubechies 2 2
7 6 2 || || 1 j Vert j cD
N & 2
7 4 2
||
||
||
||
AP j AP jx
cD
Where xAP represents the AP accelerometer
signal.
4 Wang et
al. [14] Daubechies 5 33
2 3 2 3 6 2 2 || || || || ||
||cD dA dD
j
j
Where dA3 and dD3 represent the third level wavelet packet approximation and detail coefficient respectively. This feature was calculated for all three components of acceleration
along with measures of standard deviation and RMS for wavelet coefficients at different levels.
5 Sekine et
al. [21] Daubechies 4 3
2
1
2
ension
FractalDim
To calculate fractal dimension, the variance of the detail coefficient is plotted against the decomposition level. The parameter β is the
gradient of resulting line. This feature was calculated for each component of acceleration. 6 Squared
coefficients Daubechies 2 15
2 1||
cD
|| , 2
2||
cD
|| , 2
3||
cD
|| , 2
4||
cD
|| & 2 5||
cD ||
for each component of acceleration 7 Magnitude
coefficients Daubechies 2 15 1 1
||
||
cD
,||
cD
2||
1, ||cD3 ||1,||
cD
4||
1, ||cD5 ||1Table II: Summary of the time and frequency-domain features
No of
Features Description of each feature
1 6 Mean and SD
2 15 Mean, SD, median and 25th and 75th percentile 3 6 Mean low and mean high pass filtered signals 4 3 Principal frequency
5 3 Spectral energy
6 12 Bao and Intille [11]: Mean DC, energy, entropy and correlations between axes
Table III: Classification accuracies (%) obtained using leave-one-out cross validation for the three-activity classification problem (level walking, stair ascent and stair descent) with the wavelet features (table I). Accuracies have been reported for each of the different accelerometer combinations.
Ta m ura et al . [23 ] N yan et al . [ 24 ] S eki ne et al . [22 ] Wang e t al . [ 14 ] S eki ne et al . [21 ] S um o f squ ares S um o f ab sol ute val ue s
Waist 60 56 67 68 43 69 72
Thigh 62 60 50 65 56 71 74
Ankle 69 66 54 69 42 74 81
Waist and
Thigh 71 67 72 83 59 82 88
Waist and
Ankle 74 74 72 84 55 79 89
Thigh and
Ankle 85 82 61 92 62 91 92
Table IV: Classification accuracies (%) obtained using leave-one-out cross validation for the three-activity classification problem (level walking, stair ascent and stair descent) with the time and frequency features (table II). Accuracies have been reported for each of the different accelerometer combinations.
M
ea
n and SD
M ul ti pl e S tatistics M ea n AC an d m ea n DC P ri nci pa l Frequ en cy E ne rgy B ao an d Intil le [11 ] M ag ni tud e o f FFT compone nt s
Waist 69 70 66 77 67 69 77
Thigh 76 80 90 56 63 74 91
Ankle 89 85 93 74 68 88 97
Waist and
Thigh 88 85 93 57 85 86 90
Waist and
Ankle 95 92 94 83 83 95 98
Thigh and
Ankle 95 93 98 73 94 94 98
Table V: Classification accuracies (%) obtained using leave-one-out cross validation for the eight-activity classification problem with the wavelet features (table 1).
Accuracies have been reported for each of the different accelerometer combinations.
Ta m ura et al . [23 ] N yan et al . [ 24 ] S eki ne et al . [22 ] Wang e t al . [ 14 ] S eki ne et al . [21 ] S um o f squ ares S um o f ab sol ute val ue s
Waist 53 47 52 60 33 64 70
Thigh 57 51 42 60 30 69 74
Ankle 63 51 33 60 22 73 77
Waist and
Thigh 67 63 58 77 46 79 86
Waist and
Ankle 69 63 62 78 47 77 87
Thigh and
Ankle 77 69 57 82 43 85 88
Table VI: Classification accuracies (%) obtained using leave-one-out cross validation for the eight-activity classification problem with the time and frequency features (table II). Accuracies have been reported for each of the different accelerometer
combinations.
M
ea
n and SD
M ul ti pl e S tatistics M ea n AC an d m ea n DC P ri nci pa l Frequ en cy E ne rgy B ao an d Intil le [11 ] M ag ni tud e o f FFT compone nt s
Waist 62 65 65 58 58 61 65
Thigh 72 74 84 48 54 68 88
Ankle 83 81 89 60 59 80 92
Waist and
Thigh 84 82 88 49 76 78 88
Waist and
Ankle 90 89 92 64 75 87 94
Thigh and
Ankle 90 90 94 58 83 86 95
Table VII: Sensitivity and specificity for each activity for the best performing time/frequency and wavelet feature sets.
Time/frequency Features: Magnitude of FFT coefficients
Wavelet Features: Sum of absolute values
Sensitivity Specificity Sensitivity Specificity
Walking 99 99 85 92
Upstairs 94 99 67 95
Downstairs 96 98 88 96
Jog 91 98 78 97
Run 91 99 87 98
Hop (left leg) 83 99 77 99
Table VII: Confusion matrix showing classification results for the eight-activity problem using features defined as the magnitudes of the first ten FFT components obtained from the ankle-mounted sensor.
Wal
ki
ng
U
pstai
rs
D
ow
nstai
rs
Jog Run
H
op
(
lef
t
leg
)
H
op
(
ri
gh
t
leg
)
Jump
Walking 377 1 0 0 0 0 0 0
Upstairs 2 346 2 0 0 0 0 0
Downstairs 2 2 275 0 0 0 0 0
Jog 0 0 0 219 11 0 0 1
Run 0 0 0 11 138 0 0 0
Hop (left leg) 0 1 0 0 0 72 12 2
Hop (right leg) 0 0 0 0 0 14 73 8