PERFORMANCE AND EMISSIONS CHARACTERISTICS OF
ALTERNATIVE BIODIESEL FUEL ON SMALL DIESEL ENGINE
Ridwan Saputra Nursal1, Amir Khalid2, Ahmad Syukri Ahmad Tajuddin3,Syahrunniza Abd. Hadi3
1
Centre of Technology In Marine Engineering (CTME), Marine Engineering Department, Ungku Omar Polytechnic (PUO), Ipoh, 31400 Perak, Malaysia
2
Automotive Research Group (ARG), Centre for Energy and Industrial Environment Studies (CEIES), Universiti Tun Hussein Onn Malaysia
3
Universiti Tun Hussein Onn Malaysia. E-Mail: [email protected]
ABSTRACT
Alternative fuels for diesel engines have become increasingly important due to several socioeconomic aspects and increased environmental concerns. Global warming concerns due to the production of greenhouse gases (GHGs) have seen as one of major factor the promotion of the use of biofuels. Carbon dioxide (CO2) from fuel combustion is a major
contributor to GHGs and caused a shift in the climate system. Yet the use of biodiesel as an alternative fuel for petroleum-diesel fuel operates in compression ignition (CI) petroleum-diesel engines is very effective for the reduction of CO2 emission since it
is classified as green and renewable energy. It is now acknowledged that the use of the biodiesel blends fuel is restricted due to loss of efficiency and long term problems in the engine associated with worsen the atmosphere pollution. Hence, this study targets on investigating the effects of various biodiesel and fossil diesel blends fuel on engine performance and exhaust gas emissions of small diesel engine and yet recommends bio-fuel that optimise the engine performance and lower exhaust emissions. As results of experimental investigations, there has been a decrease in performance of torque, brake power, brake thermal efficiency (BTE) and brake mean effective pressure (BMEP) while increase in brake specific fuel consumption (BSFC) has been observed for all biodiesel blend fuels over the entire speed range and load test compared to diesel fuel (DSL). In conjunction, exhaust gas emissions, signified the higher formations of NOx emissions while reductions of CO, CO2 and HC gases corresponding to the increasing of biodiesel blending ratio. Increased blends of
biodiesel ratio is found to enhance the combustion process consequently decreased the emission elements. It can be concluded that biodiesel blend fuels can be used in diesel engines without any engine modifications and have beneficial effects both in terms of emission reductions and alternative petroleum diesel fuel.
Keywords: Diesel Engine Biodiesel Alternative Fuel Emission
INTRODUCTION
For decades the advantages of biodiesel have been observed by many researchers. However, there are some obstacles remaining in the use of biodiesel. In recent years, some factors, such as environmental concerns and a continuing rise in crude oil prices, have focused more efforts on biodiesel use (Kinoshita, Myo, & Hamasaki, 2006). Biodiesel fuel is reported has good potential to be used as an alternative fuel that can reduce the exhaust gas emission especially carbon dioxide (CO2)from the internal
combustion engine. In this study, the biodiesel fuels are produced from crude palm oil (CPO), Jatropha oil (JCO) and waste cooking oil (WCO) feedstocks. Biofuels based on vegetable oils offer the advantage being a sustainable, annually renewable source of diesel engine fuel and yet receiving a lot of attention nowadays. Source of biodiesel from vegetable oils such as crude palm oil, soybean oil, raw rapeseed oil, waste cooking oil and etc. have become the main actor in producing biodiesel rather than biodiesel from animal fat. The selection of this vegetable oil is priority to the great fuel properties such as flash point and acid value that comparable to the petroleum-diesel fuel (Hossein, Ashnani, Johari, & Hashim, 2014).
The capability of CPO to be used as biodiesel due to the higher level of molecular saturation of it contains, which means a lower number of double bonds in the molecules. This leads to a higher ignition quality in compression ignition (CI) engine. However, this also leads to a higher cloud point which makes them difficult to be used in cold weather unless certain cold flow additives are being added. As JCO is found to contain as much as 34 wt.% of saturated fatty acids, Jatropha based biodiesel is expected to exhibit poor operability at low temperature (Lim & Teong, 2010).
Meanwhile the important issue is the emission exhausted from diesel engines fuelled by biodiesel is required to meet the future stringent emission regulations.
Thus, the improvement of emissions released from biodiesel is immediately required to meet the future stringent emission regulations. On the other hand, it was reported that the implementation of boost pressure, swirl velocity and injection pressure has a great effect on the mixture formation, turbulence, ignition delay, ambient density and ambient pressure yet subsequently affecting
the flame propagation, combustion characteristics as well as better emissions elements.
[image:2.595.54.544.252.488.2]As summary, most of biodiesel fuels have faced problems where the fuels are not operating effectively in cold weather and some of them may lead the increasing of emissions due to instable fuel properties or inappropriate blending ratio. Therefore, this research works expected will provide knowledge of the effects on performance, combustion characteristics and emission.
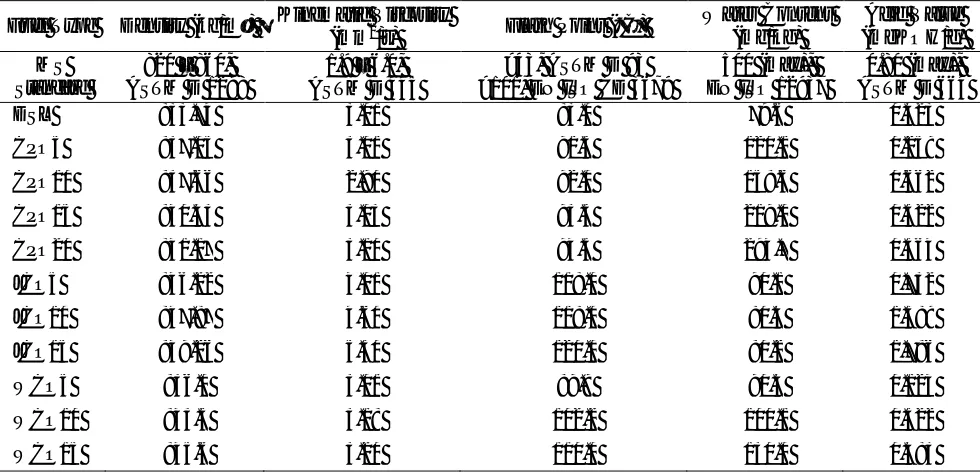
Table 1 – Fuel properties
Fuel Type Density (kg/m³) Kinematic Viscosity
(mm2/s) Flash Point (°C)
Water Content (mg/kg)
Acid Value (mgKOH/g)
MS Standard
820 – 860, ASTM D 1298
1.9 – 6.0, ASTM D 445
>43, ASTM D 93 >101, EN ISO CD 3679
500 (max), EN ISO 12937
0.80 (max), ASTM D 664
DSL 833.74 3.01 83.0 79.6 0.423
CPO5 837.05 3.01 91.5 120.1 0.259
CPO10 837.66 2.90 92.0 158.6 0.662
CPO15 840.43 3.03 93.5 219.0 0.322
CPO20 841.17 3.10 94.5 294.7 0.364
JCO5 846.22 4.01 118.0 90.1 0.732
JCO10 847.87 4.60 118.0 80.4 1.389
JCO15 849.26 5.30 120.0 80.2 1.786
WCO5 836.0 3.01 89.9 90.4 0.124
WCO10 843.5 3.18 102.2 100.1 0.322
WCO15 845.6 3.20 110.0 130.0 0.483
EXPERIMENTAL SETUP
Fuel Properties
The study used three types of biodiesel fuel i.e. crude palm oil (CPO), Jatropha curcas oil (JCO) and waste cooking oil (WCO) which had been prepared in UTHM’s automotive laboratory. The purified biodiesel from those three kinds of feedstocks are blended with standard diesel (DSL) in various concentrations of 5, 10 and 15% vol for CPO, JCO and JCO with additional of 20% vol fuel blending for CPO. These blended fuels are denoted as CPO5, CPO10, CPO15 and CPO20 for crude palm biodiesel blends fuel, while JCO5, JCO10 and JCO15 for jatropha curcas biodiesel blends fuel and WCO5, WCO10 and WCO15 for waste cooking biodiesel blends fuel respectively. The petroleum-diesel fuel (DSL) with grade II diesel rated is tested along with the biodiesel blends fuel and nominated as a reference standard fuel. The properties of DSL and all types of biodiesel fuel blends have been measured within ambient temperature to conform the MS Standard. Table 1 displays the standard requirement and summarizes the comparison of fuel properties characteristics that has been measured between the DSL and biodiesel at particular blending ratio.
The equipment apparatus setup for blending process is depicts in Figure 1. During blending process, the scale blending machine will be operated at 700C and the mixture will be stirred at 600C for 1 hour. The mixture will be stirred continuously with rotating blender blade speed was set to maintain at 270 rpm.
[image:2.595.322.529.573.747.2]The blended biodiesel fuels properties are tested to ensure meets the MS Standard. The kinematic viscosity of biodiesel was measured by Hydromation Viscolite 700 model VL700-T15 viscometer. Kinematic viscosity denoted as resistance of liquid to flow. It is refer to the time taken by a volume of biodiesel sample (liquid form) to flow under gravity through a calibrated glass capillary viscometer. Based on Malaysian Standard the range of kinematic viscosity is 3.5–5.0 mm2/s. The density of fuel was measured by Metter Toledo Diamond Scale model JB703-C/AF. Density is the connexion between the mass and volume of fuel and expressed in units of kilograms per metre cubic (kg/m3). The density of biodiesel adopts in Malaysian Standard is in the range of 860-900 g/cm3. The density of biodiesel gives an indication of the delay between the injection and combustion of the fuel (ignition quality) and the energy per unit mass (specific energy). The flash point of biodiesel were measured by using flash
[image:3.595.114.482.337.754.2]point analysis instrument namely Pensky-Martens model PMA 4. The flash point is the lowest temperature at which fuel emits enough vapours to ignite and is set to minimum range temperature of 430C for petrodiesel and 1010C for biodiesel as adopt in Malaysian Standard. The water content and acid value in biodiesel sample measured by Volumetric KF Titrator model v20 and undergo titration process. The term of acid value is expressed as the amount in (milligram) of potassium hydroxide (KOH) required to neutralize 1 gram of the biodiesel and is set to a maximum value of 0.5 mg KOH/g as in the Malaysian Standard. Higher acid content can cause severe corrosion in fuel supply system and internal combustion engine. During acid value measurement, the biodiesel sample is titrated with alcoholic KOH using phenolphthalein as indicator. The standards of water content for biodiesel in Malaysia Standard is set to a maximum 500 mg/kg or limit 0.05% maximum by volume.
Testing Apparatus and Procedure
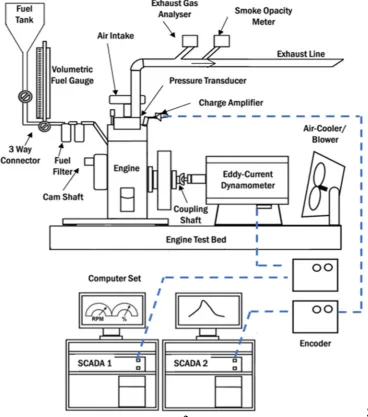
Facilities and equipment of this study are set up in Marine Engineering Department’s Laboratory in Ungku Omar Polytechnic, Ipoh. The testing apparatus set up has been arranged as in Figure 2. The dashed line shows the link connection from main particular sensor attached with the engine to encoder/data acquisition system (DAQ) and connect to a Supervisory Control and Data Acquisition unit (SCADA) which computerise monitored.
[image:4.595.50.290.411.666.2]Fuels was tested used a small diesel engine, model TF120-ML with 0.638 litre capacity, single cylinder, horizontal type, 4-cycle engine with air-cooled system made by Yanmar Motor. The engine was design with compact dimensions and in all applications with a power requirement up to 8.8 kW at 1 hour due to its low weight. Table 2 signified specification of the engine. The operating parameters such as loads exerted during engine operation and engine speeds will be controlled manually, set by user while the overall operation of engine will automatically monitored by set of SCADA unit. The DEWESOFTv7.11 software is used to monitor the input parameters and measure the performance of the engine while the DYNO-MAX 2010 software is used to analyse the combustion characteristics.
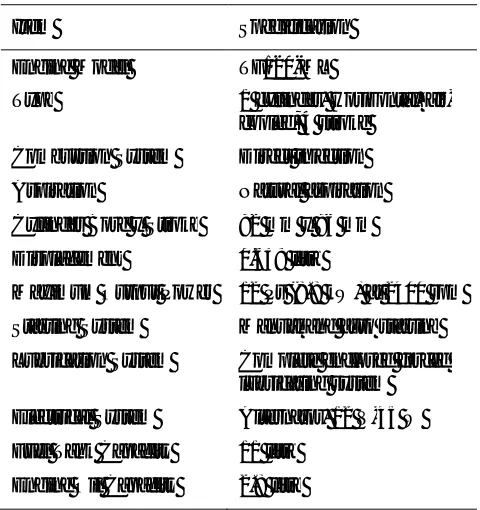
Table 2 – Test engine specification
Item Specification
Engine Model TF120-ML
Type 1 cylinder, Horizontal, air-cooled, 4 stroke
Combustion System Direct injection
Aspiration Natural aspiration
Cylinder Bore x Stroke 92 mm x 96 mm
Displacement 0.638 litre
Maximum Output Power 12 Ps (8.8 kW) at 2400 rpm
Starting System Manual and auto starting
Lubrication System Complete enclosed forced lubricating system
Electrical System Alternator, 12 V-45 W
Fuel Tank Capacity 11 litre
Engine Oil Capacity 2.8 litre
For this research, the fuels tested of DSL, CPO5, CPO10, CPO15, CPO20, JCO5, JCO10, JCO15, WCO5, WCO10 and WCO15 are used for running in a manner of similar engine operation conditions. This gives the total 11 different fuels in numbers will be tested. The engine will be operated under dynamometer loads at 0%, 30%, 60% and 90% loads condition. The maximum load i.e. 100% will not be considered in the test operation to avoid the exhausted and failure of the engine as the precaution. The
other parameter in this experiment is the various running speeds of the engine which will be simulated at 800, 1200, 1600 and 2000 rpm.
The parameters measured with respect to engine performance consists of engine torque, brake power (BP), brake specific fuel consumption (BSFC), brake mean effective pressure (BMEP), brake thermal efficiency (BTE), exhaust gas temperature (EGT) and fuel mass flow rate (ṁf). While the combustion analysis parameters
consists of cylinder pressure data, volume and heat release are used to plot pressure-volume (P-V) diagram as well as pressure-crank angle (P-CA) diagram, heat release (HR) and cumulative heat release (CHR) from fuel combusted inside the combustion chamber of the engine. In conjunction, the measurements of exhaust gas emissions comprised carbon dioxide (CO2), carbon monoxide (CO),
oxides of nitrogen (NOx) and hydrocarbon (HC) using exhaust gas analyser.
RESULTS AND DISCUSSION
All types of biodiesel blends were analysed simultaneously with compare to the standard diesel (DSL) results of engine performance and exhaust gas emissions. B0, B5, B10, B15 and B20 in graph plotted at x-axis are indicates the 0, 5, 10, 15 and 20%vol blending ratio respectively. Therefore, for an example WCO at B5 also denoted as WCO5 in the analysis and discussion. Further discussion are comprised the analysis of performance and emission characteristics through engine speed of1600 rpm at 0% and 50% (medium) dynamometer loads condition.
Performance Characteristics
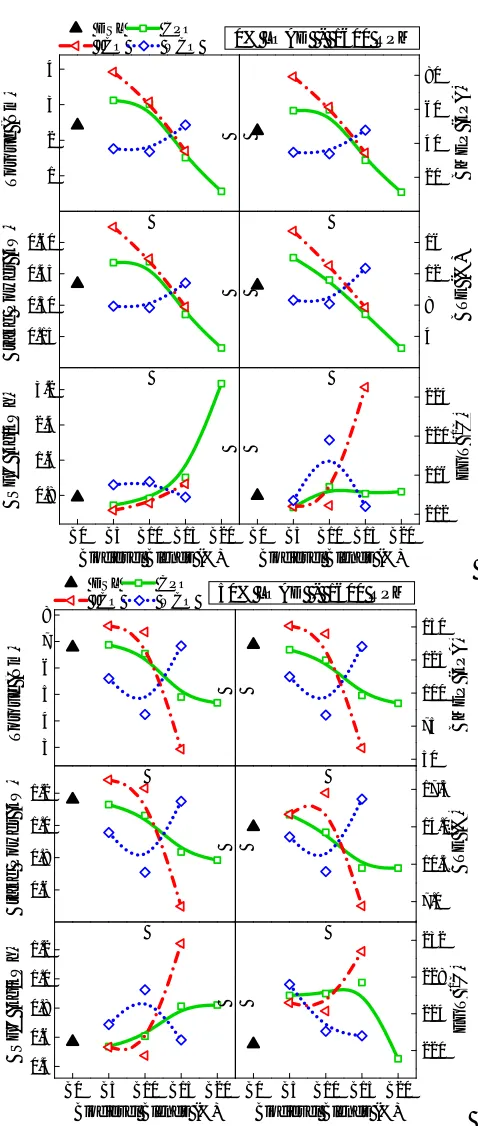
Figure 3 and 4 shows the changes in torque, brake power, brake specific fuel consumption (BSFC), brake mean effective pressure (BMEP), brake thermal efficiency (BTE) and exhaust gas temperature (EGT) of standard diesel (DSL), crude palm biodiesel blends oil (CPO), jatropha curcas biodiesel blends oil (JCO) as well as waste cooking biodiesel blends oil (WCO) at particular blending ratio under 0 and 50% loads condition during engine speed of 1600 rpm. Through engine speed of 1600 rpm, CPO under 0 and 50% loads condition is observed to have a comparable performance in term of torque, brake power, BMEP, BTE and BSFC at 5 to 10%vol blending ratio with that of DSL. However, a decreased in engine performance is remarked associated with increased in BSFC as the CPO blending concentration was increased from 10 to 20% by volume. The EGT by CPO is comparable to that of DSL without load but it is also remarked that EGT is lower for CPO20. This is explained that CPO at higher blending ratio may produce lower combustion temperature compared to DSL and CPO blends at lower concentration. The decrement of EGT whereby triggered by low combustion temperature due to the lower calorific value of biodiesel (Abedin et al., 2014).
Figure 3 – Performance of diesel engine by all types of biodiesel blends during without load condition
Figure 4 – Performance of diesel engine by all types of biodiesel blends speed under 50% load condition
blending ratio relative to that of DSL but again decreased in performance associated with increased in BSFC by JCO15 under 50% rated loads. This is caused by higher kinematic viscosity of biodiesel may cause poor
atomisation of the fuel, hence poor mixing with air resulting in higher BSFC. In average, Figure 3 and 4 also indicates that combustion of JCO yields a higher EGT relative to that of DSL at exerted loads condition.
1 2 3 4 20 40 60 80 0.15 0.30 0.45 0.60 4 8 12 16
B0 B5 B10 B15 B20 0.8
1.6 2.4 3.2
B0 B5 B10 B15 B20 212 216 220 224 T o rq u e ( N m )
DSL CPO JCO WCO
B M E P ( k P A )
0% LOAD - 1600 RPM
B ra k e P o w e r (k W ) B T E ( % ) B S F C ( k g /k W h )
Biodiesel Blends (%)
E G T ( 0 C )
Biodiesel Blends (%)
3 4 5 6 7 8 50 75 100 125 150 0.6 0.8 1.0 1.2 7.0 10.5 14.0 17.5
B0 B5 B10 B15 B20 0.4
0.6 0.8 1.0 1.2
B0 B5 B10 B15 B20 220 224 228 232 T o rq u e ( N m )
DSL CPO JCO WCO
B M E P ( k P A )
50% LOAD - 1600 RPM
B ra k e P o w e r (k W ) B T E ( % ) B S F C ( k g /k W h )
Biodiesel Blends (%)
E G T ( 0 C )
On the other hand, WCO15 has demonstrates the performance in term of torque, brake power, BMEP, BTE and BSFC are as good as that of DSL. Even though, the performance are slightly lower by WCO blends fuel at 5 and 10%vol blending concentration under both all rated loads as depicts in Figure 3 and 4. Higher EGT of WCO blends fuel than that of DSL also remarked under 50% rated loads.
Emission Characteristics
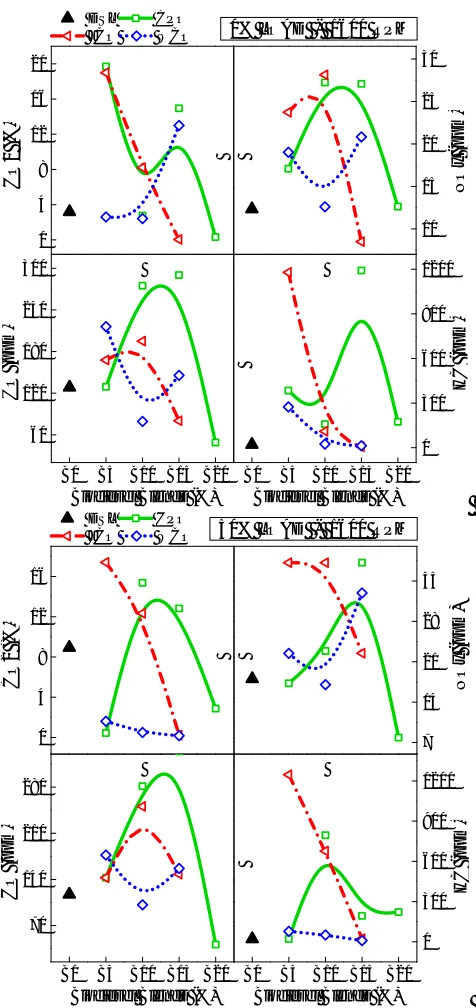
Figure 5 and 6 shows the changes in formation of CO2, CO, NOx and HC emissions from diesel engine
fuelled by CPO, JCO and WCO blends fuel corresponding to the biodiesel blending ratio as well as DSL under 0 and 50% loads condition through engine speed of 1600 rpm.
By refer to Figure 5, CO2 emissions by CPO
decrease proportional to increasing of blending ratio. At higher CPO blends concentration of 20%vol also indicates the reduction of CO2 and CO formations. The better
emissions of CO2 and CO also remarked by CPO20 under
all rated loads while at lower blending ratio of 5%vol, the formation of CO2 shows an improvement with slightly
high of CO formation as depicts in Figure 6. This results is relates to the fact that high blends of biodiesel have more
oxygen content, which result more complete combustion and directly decrease CO2 and CO emission (Anand,
Kannan, Nagarajan, & Velmathi, 2010). By refer to Figure 6, the emission of NOx gases by CPO at all blending ratio are higher relative to that of DSL. This is due to properties of CPO blends fuel has low viscosity thus enhanced the fuel-air premixing thus influence the higher NOx (Khalid, Anuar, Sapit, et al., 2014). However, there is signification of a bit reductions of NOx under 50% rated loads by CPO blends at 5% and 20% blending concentration. Nevertheless, CPO blend fuel in average demonstrates greater formation of HC emissions through engine speed of 1600 rpm under 0 and 50% load condition compared to that of DSL which relates to the over-leaning of fuel-air mixtures during the ignition delay period resulting incomplete combustion subsequently increases HC emission (Abedin et al., 2014), while CPO5 under 50% rated loads signifies a comparable of HC emissions with DSL as dictates in Figure 6.
On the other hands, by refer to Figure 5 and 6, it is observed that in overall CO2, CO, NOx as well as HC
Figure 5 – Emissions characteristic by all types of biodiesel blends during 1600 rpm engine speed without load condition
Figure 6 – Emissions characteristic by all types of biodiesel blends during 1600 rpm engine speed under 50% load condition
Figure 5. Apart from that, during 1600 rpm under 50% loads condition, there are a better and comparable of CO2
and HC emissions associated with slightly higher of CO and NOx emissions by 15% JCO blends fuel are remarked relative to that of DSL as per Figure 6. This is mainly due to the fact that JCO blends fuel has high oxygen content that will attributed to better combustion and directly decrease CO2 and HC emission along with yielding the
higher NOx emission.
Moreover, Figure 5 and 6 shows that both CO and NOx has similar trends of emissions where both of gases contributes by WCO blends fuel in average is higher as compared to that of DSL in conjunction with slightly lower of CO formation and comparable of NOx emission at 10% WCO blending concentration. By refer to Figure 5, the formation of CO2 emissions by WCO5 and WCO10
blends fuel are comparable to that of DSL without load condition but somewhat higher by WCO15 during 1600 rpm engine speed. Notwithstanding, the CO2 emissions are
0 4 8 12 16 20 10 15 20 25 30
B0 B5 B10 B15 B20 60
120 180 240 300
B0 B5 B10 B15 B20 0 300 600 900 1200 C O 2 ( % )
DSL CPO JCO WCO
N O x ( p p m )
0% LOAD - 1600 RPM
C O ( p p m )
Biodiesel Blends (%)
H C ( p p m )
Biodiesel Blends (%)
0 4 8 12 16 7 14 21 28 35
B0 B5 B10 B15 B20 70
140 210 280
B0 B5 B10 B15 B20 0 300 600 900 1200 C O 2 ( % )
DSL CPO JCO WCO
N O x ( p p m )
50% LOAD - 1600 RPM
C O ( p p m )
Biodiesel Blends (%)
H C ( p p m )
[image:7.595.181.419.103.607.2]lower compared to that of DSL as loads increased to 50% rated under similar speed. There is reduction trend of HC emissions under all rated load conditions inversely proportional to increment of WCO blending ratio were observed with small variant of emissions between WCO blends fuel and DSL except for WCO5 under 0% load condition as in Figure 5. Reductions of HC formations is associated by the increasing of blending ratio which weaken the fuel ignitibility as well as prolong the ignition delay (Khalid, Anuar, Ishak, et al., 2014). This circumstances results in lower combustion temperature and pressure of WCO blends.
CONCLUSIONS
The study has been accomplished using three types of alternative biodiesel derived from different CPO, JCO and WCO (0, 5, 10 and 15%vol blending ratio and up to 20%vol for CPO) in order to investigate the engine performance and exhaust gas emissions characteristic for 0, 50 and 90% loads condition thriughout 800, 1200, 1600 and 2000 rpm engine speeds. The conclusion based on the experimental study were lay emphasis on fuels characteristic that optimised the engine performance and exhaust emissions blends and are drawn as follows:
(1) CPO from 5% to 10%vol blending concentration promotes a comparable engine performance in term of torque, brake power, BMEP, BTE and BSFC under all rated loads condition to that of DSL.
(2) CPO at 20%vol blending ratio promotes the reduction of CO2 and CO relative to DSL due to the fact that
high blends of biodiesel have more oxygen content, which result more complete combustion and directly reduced the CO2 and CO emission.
(3) CPO at 5% and 20%vol blending ratio promotes the reductions of NOx comparative to DSL under 50% rated loads which relates to the lower combustion temperature due to the lower calorific value of biodiesel.
(4) JCO from 5% to 10%vol blending concentration promotes a comparable engine performance in term of torque, brake power, BMEP, BTE and BSFC under all rated loads condition to that of DSL.
(5) JCO at 15%vol blending ratio promotes the reduction of CO and NOx emissions under 0% load condition associated with the reduction of CO2 and HC
emissions relative to DSL under all rated loads which mainly due to the has high oxygen content in JCO blends that attributed to better combustion subsequently decrease the CO2 and HC emissions.
(6) WCO at 15% blending concentration promotes a comparable engine performance in term of torque, brake power, BMEP, BTE and BSFC under all rated loads condition to DSL.
(7) WCO at 10%vol blending ratio promotes the reduction of CO and NOx emissions comparative to
DSL under all loads condition along with reduction of CO2 at 5%vol blending concentration.
(8) WCO at 15%vol blending ratio promotes comparable and slightly lower HC emissions relative to DSL under all loads condition due to weaken of fuel ignitibility as well as prolong the ignition delay.
REFERENCE
Abedin, M. J., Masjuki, H. H., Kalam, M. a., Sanjid, a., Rahman, S. M. A., & Fattah, I. M. R. (2014). Performance, emissions, and heat losses of palm and jatropha biodiesel blends in a diesel engine. Industrial Crops and Products, 59, pp.96--104.
Anand, R., Kannan, G. R., Nagarajan, S., & Velmathi, S. (2010). Performance Emission and Combustion Characteristics of a Diesel Engine Fueled with Biodiesel Produced from Waste Cooking Oil. SAE Technical Paper: 2010-01-0478.
ASTM American Society for Testing and Materials. (2012). ASTM Standard Specification for Biodiesel Fuel Blend Stock (B100) for Middle Distillate Fuels. West Conshohocken: ASTM D6751.
Atabani, A. E., Silitonga, A. S., Anjum, I., Mahlia, T. M. I., Masjuki, H. H., & Mekhilef, S. (2012). A comprehensive review on biodiesel as an alternative energy resource and its characteristics. Journal of Renewable and Sustainable Energy Reviews, 16(4), pp.2070--2093.
Atabani, A. E., Silitonga, A. S., Ong, H. C., Mahlia, T. M. I., & Masjuki, H. H. (2013). Non-edible vegetable oils : A critical evaluation of oil extraction , fatty acid compositions , biodiesel production , characteristics , engine performance and emissions production, Journal of Renewable and Sustainable Energy Reviews, 18, pp.211--245.
Demirbas, A. (2008). Biodiesel : A Realistic Fuel
Department of Standards Malaysia. (2008). MS 2008:2008 Automotive fuels - Palm Methyl Esters (PME) for diesel engines - Requirements and test methods. ICS: 75.160.20
European Standard (2008). Automotive fuels - Fatty acid methyl esters (FAME) for diesel engines - Requirements and test methods. Brussels: EN14214.
Hossein, M., Ashnani, M., Johari, A., & Hashim, H. (2014). A source of renewable energy in Malaysia , why biodiesel? Journal of Renewable and Sustainable Energy Reviews, 35, pp.244--257.
Khalid, A., Anuar, M. D., Ishak, Y., Manshoor, B., Sapit, A., Leman, M., & Zaman, I. (2014). Emissions Characteristics of Small Diesel Engine Fuelled by Waste Cooking Oil, Journal of MATEC Web Conference, 13, 06006, pp.1--6.
Khalid, A., Anuar, M. D., Sapit, A., Razali, A., Manshoor, B., Fawzi, M., & Zaman, I. (2014). Experimental Investigation of Emissions Characteristics of Small Diesel Engine Fuelled by Blended Crude Palm Oil, Journal of Applied Mechanics and Materials, 660, pp.462--467.
Khalid, A., Mudin, A., Jaat, M., Mustaffa, N., Manshoor, B., Fawzi, M., … Ngali, Z. (2014). Effects of Biodiesel Derived By Waste Cooking Oil on Fuel Consumption and Performance of Diesel Engine, Journal of Applied Mechanics and Materials,554, pp.520--525.
Khalid, A., Osman, S. A., Jaat, N. M., Mustaffa, N., Basharie, S. M., & Manshoor, B. (2013). Performance and Emissions Characteristics of Diesel Engine Fuelled by Biodiesel Derived from Palm Oil, Journal of Applied Mechanics and Materials,315, pp.517--522.
Kinoshita, E., Myo, T., & Hamasaki, K. (2006). Diesel Combustion Characteristics of Coconut Oil and Palm Oil Biodiesels, (724). SAE Technical Paper: 2006-01-325.
Lim, S., & Teong, L. K. (2010). Recent trends , opportunities and challenges of biodiesel in Malaysia : An overview, Journal of Renewable and Sustainable Energy Reviews.14, pp.938--954.
Sani, W., & Hasnan, K. (2008). UTHM Biodiesel Pilot Plant Development, Proceedings of International Conference on Mechanical & Manufacturing Engineering (ICME2008), 59-2, pp.1-8.