Journal of Chemical and Pharmaceutical Research, 2014, 6(3):1479-1489
Research Article
CODEN(USA) : JCPRC5
ISSN : 0975-7384
Characterization, correlation and electrocoagulation studies of leather
processing industrial effluent
T. Sugumaran
1*, A. Ramu
2and N. Kannan
31Center for Research and Post-Graduate Studies in Chemistry, Ayya Nadar Janaki Ammal College, Sivakasi, Tamil
Nadu, India
2Department of Inorganic Chemistry, Madurai Kamaraj University, Madurai, Tamil Nadu, India
3Center for Research and Post-Graduate Studies in Chemistry, Ayya Nadar Janaki Ammal College, Sivakas, Tamil
Nadu, India
_____________________________________________________________________________________________
ABSTRACT
This study was performed to investigate the characterization, water quality index, correlation, linear regression analysis and assessment of irrigation quality of leather processing industrial effluent discharged from the industry located at west of Madurai near Dindigul, Tamilnadu, India. Further the treatment study by electrocoagulation was carried out with and without adsorbents viz., Commercial Activated Carbon (CAC), Multi Walled Carbon Nanotubes (MWCNTs) and Graphene (GR). Most of the water quality parameters (WQPs) of effluent were found to be higher than the limit prescribed by Bureau of Indian Standards (BIS) for the discharge of industrial effluent. The decrease in values of Total Dissolved Solids (TDS), both anions and cations were higher in the case of EC with GR and MWCNTs than CAC.
Keywords: Leather Processing Effluent, Correlation analysis, Electrocoagulation, Adsorbents
_____________________________________________________________________________________________
INTRODUCTION
The use of leather goes back to the pre-historic times. The principal raw material is the hide or skin of animals including that of reptiles, fish and birds. The tannery operation involves converting the raw skin, a highly putrescible material, into leather, a stable material, which can be used in the manufacture of a wide range of products. The whole process involves a sequence of complex chemical reactions and mechanical processes. Performing various steps of pre- and post-treatment, generates a final product with specific properties: stability, appearance, water resistance, temperature resistance, elasticity and permeability for perspiration and air, etc [1-4].
Leather is an intermediate industrial product, with numerous applications in down-stream sectors of the consumer products industry. For the latter, leather is often the major material input and is cut and assembled into shoes, clothing, leather goods, furniture and many other items of daily use. The tanning of hides and skins also generates other by-products, which find outlets in several industrial sectors such as-dog biscuits and other animal food production, fine chemicals including photography and cosmetics, soil conditioning and fertilizers. The process of making leather has always been associated with odour and water pollution [5].
______________________________________________________________________________
Volume of wastewater (effluent) and its characteristics vary from tannery to tannery. They may also vary within the same tannery from time to time. The wastewater from beam house process viz. soaking, liming, deliming, etc., are highly alkaline, containing decomposing organic matter, hair, lime, sulphide and organic nitrogen with high BOD and COD. The wastewater from tan yard process viz., pickling, chrome tanning are acidic and coloured. Effluent from vegetable tanning contains high organic matter. The chrome tanning wastes contain high amounts of chromium mostly in the trivalent form [10,11]. The colored wastewaters released into the ecosystem from leather processing industries are toxic and even mutagenic towards living organisms in aquatic environment. Although there are many treatments techniques are available to reduce the level of pollutants in tannery effluents among them EC is one of the best method. The detailed survey of literature shows that only few works have been carried out using EC process [12-15].
In this connection the present study focused on the characterization, water quality index, correlation, linear regression analysis, assessment of irrigation quality and treatment by EC using adsorbents of leather processing industrial effluent discharged from the industry located at west of Madurai near Dindigul, Tamilnadu, India.
EXPERIMENTAL SECTION
Chemicals and Regents
The adsorbent materials CAC and MWCNTs were purchased from Sigma-Aldrich Chemicals used without any further purification. GR was synthesized by the modified Hummer’s method. All the other chemicals and reagents used in the studies are analytical grade and used as received.
Leather Processing Industrial Effluent Sampling Procedure
The leather processing industrial effluent samples for this study were collected from industry located at west of Madurai near Dindigul, Tamilnadu, India. The samples have been collected bimonthly over a period of one year in a 2L polythene can. The sampling of effluents and its characterisation were carried out as per the method recommended by BIS and APHA and methods are reported in literature [10,11]. The values of physico-chemical characteristics of leather processing industrial effluent are shown in Table 1.
Electrocoagulation (EC) Treatment Studies of Leather Processing Effluent
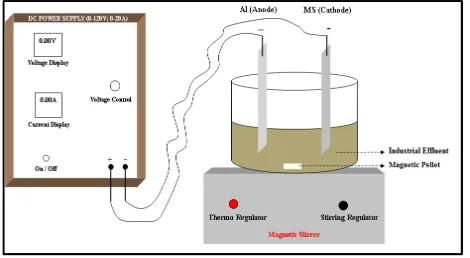
[image:2.595.186.421.593.722.2]The electrochemical cell consisted of two mono polar electrodes, one mechanically polished cathode (to avoid ohmic over potential) and another anode viz., iron (mild steel-MS) and aluminium, respectively. Both the electrodes are purchased from the local market (purity: Al = 99.5%, Fe = 99%). The dimension of iron electrode and aluminium (anode) electrode is 10.4cm×2.5cm×0.6cm each. The spacing between the electrodes was maintained at 2.8cm. The electrodes are connected to a DC power supply (120V, 20A). About 100mL of well-mixed, screened, homogeneous industrial effluent was taken in the borosilicate electrochemical cell. The temperature of the effluent before EC was noted to be 30 °C. The temperature was maintained throughout EC (deviation ±1 ◦C). For efficient electrochemical coagulation, 30V DC was passed through the electrodes throughout the EC process by getting a constant current density of 125Am-2. The experimental set-up with laboratory prototype reactor is schematically shown in Figure 1. The whole set-up was placed on a magnetic stirrer and the sample under study was subjected to constant stirring in order to avoid concentration over potential. The WQPs of effluent have been analyzed after 15minutes. Similar EC experiments were carried out in the presence of CAC, MWCNTs and GR with constant, slow stirring to facilitate effective electrocoagulation. After each EC process the effluent was filtered through Whatman 42 filter paper and analyzed for various water quality parameters.
Figure 1. Schematic diagram of experimental set-up for EC process
Characterization studies
RESULTS AND DISCUSSION
Characterization of leather processing industrial effluent
The physico-chemical characteristics of the leather processing effluent is presented in Tables 1. The statistical values such as minimum (min) and maximum and average (mean) for the effluent is given in Table 2. The WQPs determined for leather processing effluent are compared with tolerance limits of BIS for both drinking water and industrial effluent discharge on land for irrigation [16-21].
[image:3.595.85.531.181.415.2]
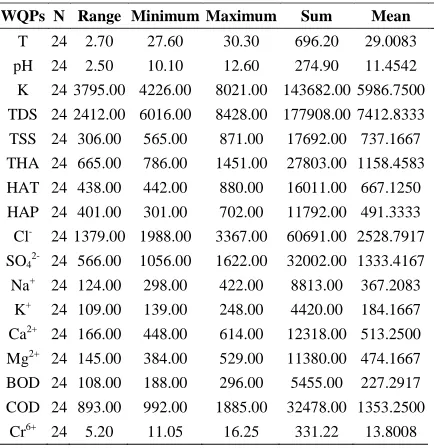
Table 1 Water Quality Parameters of leather processing industrial effluent
T pH K TDS TSS THA HAT HAP Cl- SO
42- Na+ K+ Ca2- Mg2+ BOD COD Cr6+
27.6 11.1 4435 7430 842 786 485 301 2876 1420 325 190 550 455 238 1418 12.01 28.3 11.9 4963 6655 726 1152 696 456 2259 1245 361 181 602 384 296 1247 14.26 29.1 12.1 6115 8428 668 1007 599 408 2662 1362 387 165 518 506 220 1568 13.24 28.4 12.3 7064 7226 794 886 474 412 3068 1168 422 198 480 493 208 1019 16.25 29.3 12.6 6012 7048 565 1259 696 563 2969 1056 403 222 465 418 261 1622 12.56 29.9 12 8021 7817 614 1451 829 622 2204 1496 410 156 488 524 286 1784 13.5 30.1 11.8 4750 6913 714 1317 775 542 2213 1520 368 169 614 507 193 1017 14.75 30.3 12.5 6627 7005 793 1001 554 447 2455 1462 343 172 469 525 214 992 14.15 28.7 10.9 6945 7118 701 1224 673 551 2688 1487 400 185 583 494 188 1066 13.85 28.3 11.6 5003 7655 771 947 536 411 2002 1367 417 198 500 456 261 1602 11.05 29.4 12.1 6512 8135 838 874 446 428 1998 1114 378 139 562 487 221 1372 15.5 29.7 10.6 5796 7324 871 1442 829 613 3367 1176 336 188 488 519 203 1022 14.65 28.6 10.9 5542 6560 812 1130 568 562 2456 1209 391 169 462 529 269 1267 13.9 27.9 10.7 5852 6016 742 943 442 501 2551 1358 312 182 492 481 251 1658 12.85 27.7 11.8 7967 8000 688 868 470 398 2868 1622 302 163 518 397 213 1091 13.55 28.8 10.1 6565 6858 715 1359 874 485 2383 1456 319 208 502 466 201 1885 13.05 29.3 10.9 7114 7445 748 1245 802 443 2262 1372 298 219 533 419 217 1465 13.65 29.4 12.1 5205 7056 655 1295 880 415 1988 1241 415 248 511 508 209 1352 12.8 29.9 11.2 6116 7815 815 1013 629 384 2204 1330 385 202 542 507 242 1728 13.15 30.1 11 4801 8318 603 1333 631 702 2692 1224 404 180 503 459 200 1342 14 28.6 10.7 4226 6966 724 1402 834 568 2268 1555 369 192 472 429 194 1118 14.05 29.4 11.3 5416 8254 808 1348 854 494 2687 1429 348 154 448 487 213 1009 14.85 28.3 11.8 6613 8009 829 1423 839 584 3003 1059 312 172 498 429 238 1332 15.65 29.1 10.9 6022 7857 656 1098 596 502 2568 1274 408 168 518 501 219 1502 13.95
Units: T in oC, K in µmho/cm. and remaining parameters except pH are in mg/L.
Table 2 Statistical Data of leather processing industrial effluent
WQPs N Range Minimum Maximum Sum Mean
T 24 2.70 27.60 30.30 696.20 29.0083 pH 24 2.50 10.10 12.60 274.90 11.4542 K 24 3795.00 4226.00 8021.00 143682.00 5986.7500 TDS 24 2412.00 6016.00 8428.00 177908.00 7412.8333
TSS 24 306.00 565.00 871.00 17692.00 737.1667 THA 24 665.00 786.00 1451.00 27803.00 1158.4583 HAT 24 438.00 442.00 880.00 16011.00 667.1250
HAP 24 401.00 301.00 702.00 11792.00 491.3333 Cl- 24 1379.00 1988.00 3367.00 60691.00 2528.7917
SO42- 24 566.00 1056.00 1622.00 32002.00 1333.4167
Na+ 24 124.00 298.00 422.00 8813.00 367.2083 K+ 24 109.00 139.00 248.00 4420.00 184.1667
Ca2+ 24 166.00 448.00 614.00 12318.00 513.2500
Mg2+ 24 145.00 384.00 529.00 11380.00 474.1667
BOD 24 108.00 188.00 296.00 5455.00 227.2917 COD 24 893.00 992.00 1885.00 32478.00 1353.2500
Cr6+ 24 5.20 11.05 16.25 331.22 13.8008
Comparison of WQPs of leather processing effluent with BIS tolerance limit
[image:3.595.198.415.450.674.2]______________________________________________________________________________
specific conductance of leather processing industrial effluent is 5987µ mhocm-1. The range of specific conductance value of the effluent is 4226-8021 µmhocm-1 as against the tolerance level of 3000 µmhocm-1. The extremely high values of specific conductance were found in the effluent. The average value of TDS and TSS in leather processing industrial effluent are 7413 and 737mg/L respectively. The min – max range for TDS and TSS in leather processing industrial effluent are 1441 – 2261 mg/L (≅ 2 times) and 565-871 (≅1.5 times) respectively. It is concluded that the effluent is highly polluted form specific conductance, TDS and TSS studies. Therefore, proper effluent treatment is required in order to bring down the values of specific conductance, TDS and TSS before discharge.
The average values of THA, HAT and HAP of leather processing industrial effluent are 1158, 667 and 491mg/L, respectively. The min – max range of THA, HAT and HAP values of effluent are 786-1451 (≅ 2 times), 442-880 and 301-702 respectively. The percentage of average values of temporary hardness and permanent hardness respectively to that of total hardness are 58 and 42. From the hardness studies of leather processing industry it is found that the effluent is highly polluted. Hence treatment becomes mandatory before the discharge of the same in the nearby water systems.
The average value and range of chloride and sulphate present in leather processing industrial effluent are 2529 and 1333mg/L and 1988-3367 and 1056-1622mg/L respectively. The mean values of chloride and sulphate in effluent indicate that they are above the discharge limit prescribed by BIS and hence they may be discharged only after proper effluent treatment. The average values of sodium and potassium ions in the leather processing industrial effluent are 367 and 184mg/L respectively. The range of sodium and potassium ions in the same are 298-422 and 139-248 mg/L respectively. The values obtained for sodium and potassium ions of effluent are found to be above the tolerance limit of effluent discharge prescribed by BIS. The range of permissible limits by BIS for the presence of Ca2+ and Mg2+ ions in drinking water are 75 - 200 mg/L and 30 - 150 mg/L, respectively. The average values of Ca2+ and Mg2+ ions of leather processing industrial effluent are 513 and 474mg/L respectively. The min-max range of Ca2+ and Mg2+ ions in the effluent are 448-614 and 384-529mg/L respectively. The average values of Ca2+ and Mg2+ ions of the leather effluents are exceeded the tolerance limit prescribed by BIS and hence it must be treated before letting out from the industries.
The average values of BOD and COD of leather processing industrial effluent are 227 and 1352mg/L respectively. The min-max ranges of BOD and COD in the effluent are 188-296 and 992-1885mg/L respectively. The BOD and COD of the leather effluent exceeded the tolerance limit prescribed by BIS and indicate a high load of organic as well as some inorganic substances and highly polluted nature of the effluent sample. Hence, the effluent is to be discharged only after proper treatment to reduce the values of BOD and COD.
The mean values and min - max range of Cr6+ ion in leather processing effluent 14mg/L and 11-16.25mg/L. The sample contain Cr6+ ion above the prescribed limit of BIS (2.0 mg/L) and hence treatment of effluent becomes essential in order to reduce the level of Cr6+ ion before its discharge [16-21].
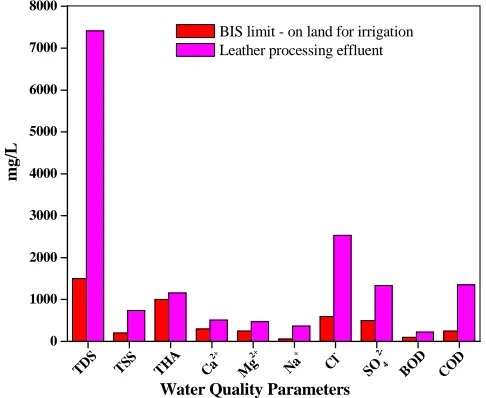
Figure 2 gives a judicious comparison of the major WQPs of leather processing industrial effluent (TDS, TSS, THA, Ca2+, Mg2+, Na+, Cl-, SO42-, BOD and COD) with BIS tolerance limits for industrial effluent discharged on land for
[image:4.595.186.429.550.749.2]irrigation [16-21].
Fig. 4.13 Comparison of WQPs of leather processing industrial effluent with BIS Limit 0
1000 2000 3000 4000 5000 6000 7000 8000
BIS limit - on land for irrigation Leather processing effluent
CO D BO
D SO4
2-Cl
-Na
+
Mg
2+
Ca
2+
TH A TSS TD
S
m
g
/L
Calculation of Water Quality Index (WQI) of leather processing industrial effluent
The mean WQI value indicates that the effluent is contaminated approximately six times above the prescribed limit which indicates that the effluent is highly polluted with a heavy load of various pollutants. Therefore, the treatment becomes vital [18-21].
Correlation analysis of WQPs of leather processing industrial effluent
[image:5.595.96.522.238.529.2]The water quality data (24 in numbers for the printing effluent, which were collected fortnightly for a period of one year; i.e., 24 observations) is presented in Table 1 was used for correlation analysis. One of the parameters i.e., ‘i’ is chosen as x (independent variable) and other one ‘j’ as y (dependent variable) [9-15]. The correlation co-efficients (r values) between each pair of the 24 WQPs are calculated and are presented in the form of correlation co-efficient matrix in Table 3.
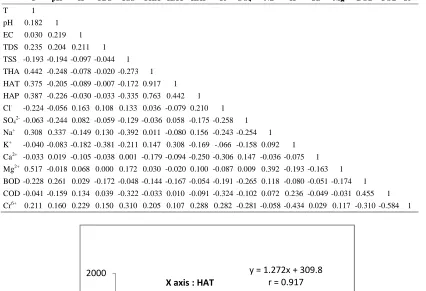
Table 3 Correlation Coefficient Matrix of leather processing industrial effluent
T pH K TDS TSS THA HAT HAP Cl- SO
42- Na+ K+ Ca2+ Mg2+ BOD COD Cr6+
T 1
pH 0.182 1 EC 0.030 0.219 1 TDS 0.235 0.204 0.211 1 TSS -0.193 -0.194 -0.097 -0.044 1
THA 0.442 -0.248 -0.078 -0.020 -0.273 1 HAT 0.375 -0.205 -0.089 -0.007 -0.172 0.917 1 HAP 0.387 -0.226 -0.030 -0.033 -0.335 0.763 0.442 1
Cl- -0.224 -0.056 0.163 0.108 0.133 0.036 -0.079 0.210 1
SO42- -0.063 -0.244 0.082 -0.059 -0.129 -0.036 0.058 -0.175 -0.258 1
Na+ 0.308 0.337 -0.149 0.130 -0.392 0.011 -0.080 0.156 -0.243 -0.254 1
K+ -0.040 -0.083 -0.182 -0.381 -0.211 0.147 0.308 -0.169 -.066 -0.158 0.092 1 Ca2+ -0.033 0.019 -0.105 -0.038 0.001 -0.179 -0.094 -0.250 -0.306 0.147 -0.036 -0.075 1
Mg2+ 0.517 -0.018 0.068 0.000 0.172 0.030 -0.020 0.100 -0.087 0.009 0.392 -0.193 -0.163 1
BOD -0.228 0.261 0.029 -0.172 -0.048 -0.144 -0.167 -0.054 -0.191 -0.265 0.118 -0.080 -0.051 -0.174 1
[image:5.595.175.466.453.630.2]COD -0.041 -0.159 0.134 0.039 -0.322 -0.033 0.010 -0.091 -0.324 -0.102 0.072 0.236 -0.049 -0.031 0.455 1 Cr6+ 0.211 0.160 0.229 0.150 0.310 0.205 0.107 0.288 0.282 -0.281 -0.058 -0.434 0.029 0.117 -0.310 -0.584 1
Figure 3. Correlation between HAT and THA
The minimum and maximum values for both positive and negative correlations as well as for total correlations for leather processing effluent are given in Table 4. The minimum and maximum values of correlation co-efficients for leather processing effluent are -0.392 (between Na+ - TSS) and 0.917 (between HAT - THA), respectively. The studies shows that only a few WQPs 0.763 (between HAP –THA) and 0.517 (between Mg2+ - T) are positively correlated with ‘r’ value (>0.5), while most of the WQPs are either correlated positively with low ‘r’ value (<0.5) or negatively correlated, which are highly insignificant and only the positive correlations were found to be statistically significant.
y = 1.272x + 309.8 r = 0.917
0 500 1000 1500 2000
300 400 500 600 700 800 900 1000
X axis : HAT
______________________________________________________________________________
Table 4 Correlation co-efficient range of WQPs of leather processing effluent
Sample For total correlation For positive correlation For negative correlation
Min Max Min Max Min Max
Leather processing effluent
– 0.392 (Na+ – TSS)
0.917 (HAT – THA)
0.010 (COD – HAT)
0.917 (HAT – THA)
– 0.392 (Na+ – TSS)
– 0.007 (HAT – TDS)
Linear Regression (LR) studies of leather processing effluent
A few statistically significant LR equations for the leather processing effluent are given below and the corresponding graph is given in Figure 3. The WQP calculated using LR equations for the leather processing effluent are given in Table 4 and Table 5.
Table 4. Linear Regression Values of leather processing effluent
X Y r2 R M C
HAT THA 0.8418 0.917497 1.2721 309.8 HAP THA 0.5817 0.762693 1.7195 313.63
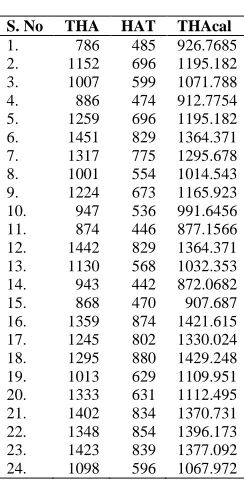
[image:6.595.245.367.300.540.2]THA = 1.272HAT + 310 ( r = 0.9175 ); HAP = 0.0095THA + 25( r = 0.7627 )
Table 5. Linear Regression Study of leather processing effluent (HAT vs THA)
y = 1.2721x + 309.8; r = 0.9175
S. No THA HAT THAcal
1. 786 485 926.7685 2. 1152 696 1195.182 3. 1007 599 1071.788 4. 886 474 912.7754 5. 1259 696 1195.182 6. 1451 829 1364.371 7. 1317 775 1295.678 8. 1001 554 1014.543 9. 1224 673 1165.923 10. 947 536 991.6456 11. 874 446 877.1566 12. 1442 829 1364.371 13. 1130 568 1032.353 14. 943 442 872.0682 15. 868 470 907.687 16. 1359 874 1421.615 17. 1245 802 1330.024 18. 1295 880 1429.248 19. 1013 629 1109.951 20. 1333 631 1112.495 21. 1402 834 1370.731 22. 1348 854 1396.173 23. 1423 839 1377.092 24. 1098 596 1067.972
Assessing leather processing industrial effluent quality for irrigation needs
The minimum, maximum and average values of sodium absorption ratio (SARmin, SARmax and SARav), percent
sodium (PSmin, PSmax and PSav), Kelly’s ratio (KRmin, KRmax and KRav) and magnesium ratio (MRmin, MRmax and
MRav) [23-27] for leather processing effluentare calculated using equations 1 to 4. The status of any industrial
effluents for irrigation is given in Table 6. The quality of leather processing effluent for irrigation is given in Table 7.
SAR = Na+/ [ (Ca2+ + Mg2+) /2 ]½ (1)
PS = 100 [ (Na+ + K+) / (Ca2+ + Mg2+ + Na+ + K+) ] (2)
KR = [ Na+ / (Ca2+ + Mg2+) ] (3)
Table 6. Values of SAR, PS, KR and MR of industrial effluents and its status for irrigation
Ratio Status for irrigation
[image:7.595.191.420.194.288.2]SAR 0 to 10 = Excellent 10 to 18 = Good 18 to 28 = Fair Above 28 = Poor PS Less than 50 KR Less than 1 MR Less than 50
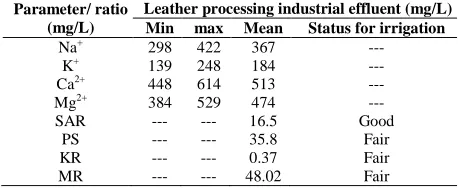
Table 7. Quality of leather processing industrial effluent for irrigation
Parameter/ ratio (mg/L)
Leather processing industrial effluent (mg/L) Min max Mean Status for irrigation
Na+ 298 422 367 ---
K+ 139 248 184 ---
Ca2+ 448 614 513 ---
Mg2+ 384 529 474 ---
SAR --- --- 16.5 Good
PS --- --- 35.8 Fair
KR --- --- 0.37 Fair
MR --- --- 48.02 Fair
Based on the SAR, PS, KR and MR results the leather processing industrial effluent is suitable for irrigation. However, the higher values of other WQPs of effluent indicate that it may be useful for irrigation only after proper treatment.
Electrocoagulation treatment studies of leather processing industrial effluent
The physico-chemical characteristics of leather processing industrial effluent were found to be higher than the tolerance limit for the discharge of industrial effluent prescribed by BIS. This indicates that the leather processing industrial effluent could be discharged only after proper effluent treatment. Hence, treatment by EC processes has been carryout on leather processing industrial effluent to evaluate the percentage removal of various WQPs with and without adsorbents namely CAC, MWCNTs and GR.
Optimization of adsorbents for EC processes
The optimization of dose of adsorbents (CAC, MWCNTs and GR) for EC studies of leather processing effluent was determined by measuring TDS (in mgL-1) and the results indicate that the optimum dose for CAC, MWCNTs and GR are 2g, 150mg and 150mg respectively.
Removal of WQPs of leather processing effluent before and after EC processes
[image:7.595.116.498.556.696.2]The physico-chemical WQPs of leather processing industrial effluent before and after EC with and without adsorbents in presence of iron cathode (MS) and aluminium anode is given in Table 8.
Table 8. Characteristics of leather processing industrial effluent before and after EC with and without adsorbents in presence of iron and aluminium electrodes
Units: K in µmho/cm and remaining parameters except pH are in mg/L. The values given in bracket refer percentage (%) removal
S. No WQPs
Water Quality Parameters Values Before
EC
After EC
Without adsorbent With CAC With MWCNTs With GR
1 Colour Black Light black Almost colourless Almost colourless Almost colourless
2 pH 11.8 8.7 (26) 8.2 (31) 7.8 (34) 7.9 (33)
3 Κ 6613 1652 (75) 556 (92) 432 (93) 385 (94)
4 TDS 8009 945 (88) 768 (90) 535 (93) 535 (93)
5 TSS 829 410 (51) 365 (56) 320 (61) 305 (63)
6 Na+ 312 168 (46) 134 (57) 117 (63) 105 (66)
7 K+ 172 52 (70) 32 (81) 28 (84) 22 (87)
8 Ca2+ 498 225 (55) 175 (65) 143 (71) 162 (67)
9 Mg2+ 429 189 (56) 135 (69) 105 (76) 112 (74)
10 Cl- 3003 750 (75) 460 (85) 362 (88) 382 (87)
______________________________________________________________________________
Measurement of pH before and after EC processes
The initial pH of the raw leather processing industrial effluent is 8. The pH of the effluent was adjusted to
below 10 by adding 0.1M H2SO4. It is observed from the Table 8 and Figure 4, the pH of the effluent is
reduced after EC with and without adsorbents. The result shows the decrease in pH is due to reduction in the concentration of H+ ions present in the leather processing effluent. The H+ ions present in the printing effluent may undergo electronation at cathode and adsorption on adsorbent materials resulting in evolution of H2 gas.
H+ + e- ½ H2↑
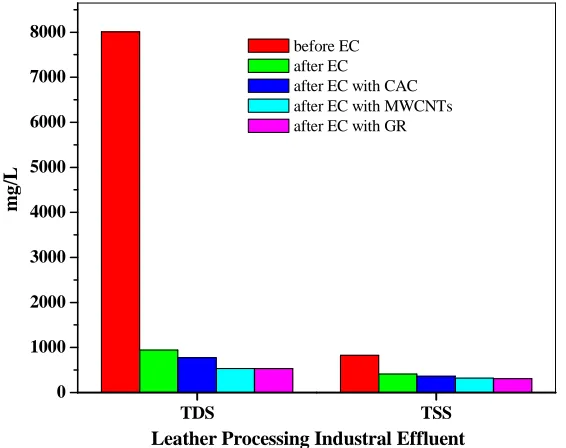
Effect on TDS and TSS before and after EC processes
[image:8.595.166.449.328.552.2]TDS is a measure of the total ions present water systems. From the Table 9 and Figure 5, the decrease in the values of TDS in leather processing industrial effluent after electrocoagulation with MWCNTs and GR are relatively higher than CAC. The high percentage removal of TDS and TSS is due to the formation of coagulants and flocculants by electrolytically added Al3+ generated from aluminium anode. The dissolved and suspended particles undergo coagulation with Al3+. The gases evolved at the electrodes may impinge on and cause flotation of the coagulated materials. The EC process is basically associated with electroflotation since bubbles of hydrogen and oxygen are produced at the cathode and anode, respectively. The success of an EC process and for that matter electroflocculation (EF) process is determined by the size of the bubbles as well as by the proper mixing of the bubbles with wastewater. It is generally believed that the smaller bubbles provide more surface area for attachment of the particles in aqueous stream, resulting in better separation efficiency of the EF process [28-35].
Figure 4. Removal of TDS and TSS in leather processing effluent by EC with and without adsorbents
Effect on anions and cations before and after EC processes
The details of reduction in the concentration of anions such as Cl- and SO42- during EC of leather processing effluent
with and without absorbents is given in the Table 8 and Figure 5. It may be due to de-electronation of these anions at anode resulting in electrochemical oxidation, they also undergo reaction with Al3+, Al(OH)3 to produce
corresponding chloride and sulphate precipitates and further the anions undergo adsorption on the surface of CAC, MWCNTs and GR during electrocoagulation.
Cl- e- + 1/2Cl2↑(at anode)
Al3+ + 3H2O ↔ Al(OH)3(s) + 3H+
Al3+ + 3Cl- → AlCl3↓
In addition, chlorine produced at anode as a result of oxidation is a strong oxidant that can oxidize some organic compounds and promote electrode reactions [36-43].
2Cl- ↔ Cl2 + 2e
-Cl2 + H2O ↔ HClO + H+ + Cl-
HClO ↔ ClO-+ H+
TDS TSS
0 1000 2000 3000 4000 5000 6000 7000 8000
m
g
/L
Leather Processing Industral Effluent
before EC after EC
Figure 5. Removal of cations and anions in leather processing effluent by EC with and without adsorbents
The removal of cations in leather processing effluent before and after EC process in presence and absence of adsorbents is shown in Table 8 and Figure 5. From the result it is observed that there is decrease in concentration of cations such as Na+, K+, Ca2+ and Mg2+ in effluent after EC with and without adsorbents. This may be due to the electronation of cations at cathode and also adsorption of cations on the surface of CAC, MWCNTs and GR during electrocoagulation. Form the results, it is also observed that the percentage removal of cations is relatively lower than the percentage removal of other WQPs this may be due the lower hydrogen over potential on iron cathode [44].
Ca2+(aq) + 2e- → Ca(s)
Mg2+(aq) + 2e- → Mg(s)
Na+(aq) + e- → Na(s)
K+(aq) + e- → K(s)
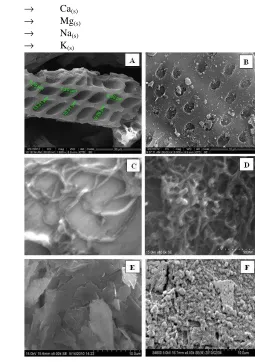
Figure 6. SEM images of A, C and E represent CAC, MWCNTs and GR respectively before EC processes: B, D and F represent CAC, MWCNTs and GR respectively after EC processes of leather processing effluent
0 500 1000 1500 2000 2500 3000
Leather Processing Industrial Effluent
m
g
/L
SO4 2-Na+
Mg2+ Cl
-Ca2+
[image:9.595.156.411.384.746.2]______________________________________________________________________________
The percentage removal of pollutants in leather processing effluent is higher in the case of GR and MWCNTs than CAC during EC processes can be attributed to their good adsorption as well as conducting properties. Since EC process is common in all the four treatment studies of leather processing effluent the efficiency of treatment lies on the adsorbing capacity of the adsorbent materials used during EC processes.
Surface morphological studies of adsorbents before and after EC process
The typical SEM photographs of adsorbents, before and after EC of leather processing effluent are shown in Figure 6. SEM photographs of adsorbents before EC process clearly reveal the surface texture and porosity of the adsorbents (Fig. 6A, C, E). SEM photographs also show that the particles can be roughly approximate as spheres or globules, if the roughness factor is included to account for their regularities. SEM photographs of adsorbents after EC processes depict the porosity nature of the adsorbents and also presence of grains in it (Fig. 6B, D, F). Furthermore, the adsorbed effluents molecules are either engulfed or surrounded on the surface of porous CAC, MWCNTs and GR adsorbents [45,46].
CONCLUSION
The leather processing industrial effluent samples for this study were collected from industry located at west of Madurai near Dindigul. Characterization, correlation analysis and treatment by EC process were carried out. Most of the WQPs of leather processing effluents were found to be higher than the limit prescribed by BIS for the discharge of industrial effluent. The average WQI value of leather processing industrial effluent showed that it was contaminated six times higher than the prescribed limit. Correlation and linear regression were carried out in order to study the rapid monitoring of water pollution. The studies of quality of effluent for irrigation showed that, it is not suitable for irrigation purposes as such. The decrease in values of TDS was higher in the case of EC with GR and MWCNTs than CAC. The decrease in concentration of both anions and cations are relatively higher in EC with and without GR and MWCNTs than CAC and the SEM studies show adsorbed effluents molecules are either engulfed or surrounded by the porous adsorbent particles.
REFERENCES
[1] Dutta, S.S., An Introduction to the Principles of Leather Manufacture, 4th ed., Indian Leather Technologists’ Association, Calcutta, India, (1999).
[2] Technical EIA Guidance Manuals for Leather / Skin / Hide Processing Industry –Ministry and Environment and Forests, Government of India, (2010).
[3] Larry W. Canter, “Environmental Impact Assessment”, Second Edition, McGraw Hill, University of Oklahoma, (1997).
[4] Lefebvre, O., Vasudevan, N., and Torrijos, M., Water Res., 39 (2005) 1471.
[5] Lofrano, G., Meric, S., Inglese, M., Nikolau, A.D., and Belgiorno, V., Desalin. Water Treat., 23 (2010) 173 . [6] Dantonio, L., and Napoli, R.M.A., Desalin. Water Treat., 23 (2010) 129.
[7] Central Pollution Control Board – “Waste Management in Tanneries: Review Report”, Ministry and Environment and Forests, Government of India, Delhi, (2000) (http://www.cpcb.nic.in/standard welcome.htm). [8] Ministry of Environment and Forest - Charter on Corporate Responsibility for Environmental Protection, MoEF, Government of India, (2003).
[9] Feng, J.W., Sun, Y.B., Zheng, Z., Zhang, J.B., Li, S., and Tian, Y.C., J. Environ. Sci., 19 (2007) 1409.
[10] Espinoza-Quinones, F.R., Fornari, M.M.T., Modenes, A.N., Palacio, S.M., Da Silva, F.G., Szymanski, N., Kroumov, A.D., and Trigueros, D.E.G., Chem. Eng. J., 151 (2009) 59.
[11] Khandegar, V., and Saroha, A. K., J. Environ. Manage., 128 (2013) 949.
[12] Ouaissa, Y.A., Chabani, M., Amrane, A., and Bensmaili, A., Procedia Eng., 33 (2012) 98.
[13] Modenes, A.N., Espinoza-Quinones, F.R., Borba, F.H., and Manenti, D.R., Chem. Eng. J., 197 (2012) 1. [14] Babu, R.R., Bhadrinarayana, N.S., Meera, K.M., Begum, S., and Anantharaman, N., J. Univ. Chem. Technol. Metall., 42 (2007) 201.
[15] Filho, D. S., Bota, G. B., Borri, R. B., and Teran, F. J. C., Desalin. Water Treat., 37 (2012) 359.
[16] APHA, AWWA, WEF, “Standard Methods for the Examination of Water and Wastewater”, 20th edn., American Public Health Association, Washington, D.C. (1998).
[17] IS: 3025-1964: “Methods of Sampling and Test (Physical and Chemical) for Water used in Industry”, Indian Standards Institution, 4th reprint, New Delhi, (1977).
[18] Vallinayagam, P., “Correlation Analysis of Water Quality Parameters in Industrial Wastewaters in Sivakasi”, M.Phil. Thesis, M.K. Univ., Madurai, April, (1988).
[19] Rajasekaran, N., “Correlations among Water Quality Parameters in Industrial Wastewaters in Sivakasi”, M.Phil. Thesis, M.K. Univ., Madurai, April (1988).
[21] Kannan, N., Rajasekaran, N. and Ganesan, SP., Indian J. Env. Prot., 12 (1992) 259. [22] Tiwari, T.N., and Ali, M., Indian J. Env. Prot., 7 (1987) 1149.
[23] Matcalf and Eddy., ‘Wastewater Engineering, Treatment, Disposal and Reuse’, IV edition, Tata McGraw Hill, New Delhi (2003).
[24] Kelley, W.P., “Alkali Soils – Their Properties and Reclamation’, Rein Hold Publ. Corpn., New York, 1951. [25] Richards, L.A., “Diagnosis and improvement of saline and alkali soils”, US Salinity Laboratory, U.S. Department of Agriculture Hand Book – 60, Washington, D.C. (1954).
[26] Venkateswara Rao, A., Singanan, M. and Kaza Somasekhara Rao, Indian J. Env. Prot., 12 (1996) 61.
[27] Wilcox, D.V., “The quality of water for irrigation use”, U.S. Agriculture Technology Bulletin, Washington, D.C. (1948).
[28] Rajeshwar, K., and Ibanez, J., Environmental Electrochemistry, Fundamentals and Applications in Pollution Abatement; Academic Press: London, UK, 1997.
[29] Cassano, A., Molinari, R., Romano, M., and Drioli, E., J. Membr. Sci., 181 (2001) 111. [30] Murugananthan, M., Raju, G.B., and Prabhakar, S., Sep. Purif. Technol., 40 (2004) 69. [31] Ge, J., Qu, J., Lei, P., and Liu, H., Sep. Purif. Technol., 36 (2004) 33.
[32] Lee, J. W., Choi, S. P., Thiruvenkatachari, R., Shim, W. G., and Moon, H., Dyes Pigm., 69 (2006) 196. [33] Kannan, N., Karthikeyan, G., and Tamilselvan, N., J. Hazard. Mater., B137 (2006) 1803.
[34] Pajootan, E., Arami, M., and Mahmoodi, N.M., J. Taiwan Inst. Chem. Eng., 43 (2012) 282. [35] Merzouk, B., Gourich, B., Madani, K., Vial, C., and Sekki, A., Desalination 272 (2011) 246.
[36] Modirshahla, N., Behnajady, M.A., and Mohammadi-Aghdam, S., J. Hazard. Mater., 154 (2008) 778. [37] Moussavi, G., Khosravi, R., and Farzadkia, M., Desalination 278 (2011), 288.
[38] Schulz, M.C., Baygents, J.C., and Farrell, J., Int. J. Environ. Sci. Technol., 6 (2011) 521.
[39] Secula, M.S., Cagnon, B., De Oliveira, T.F., Chedeville, O., and Fauduet, H., J. Taiwan Inst. Chem. Eng., 43 (2012) 767.
[40] Secula, M.S., Cretescu, I., and Petrescu, S., Desalination 277 (2011) 227. [41] Vasudevan, S., Lakshmi, J., and Sozhan, G., Desalination 310 (2013) 122.
[42] Verma, S.K., Khandegar, V., and Saroha, A.K., J. Hazard. Toxic. Radio. Waste 17 (2013) 146. [43] Yuksel, E., Eyvaz, M., and Gurbulak, E., Environ. Prog. Sust. Energy 32 (2013) 60.
[44] Moussavi, G., Majidi, F., and Farzadkia, M., Desalination 280 (2011) 127.