Munich Personal RePEc Archive
Does Corruption Pay in Indonesia? If So,
Who are Benefited the Most?
Pradiptyo, Rimawan
Faculty of Economics and Business, Universitas Gadjah Mada,
Indonesia
17 September 2012
Online at
https://mpra.ub.uni-muenchen.de/41384/
Do
es
Corrupt
ion
Pay
in Indonesia
?
If So, Who are
Benefited
the Most
?
1
Rimawan Pradiptyo2
Department of Economics, Faculty of Economics and Business Universitas Gadjah Mada
Indonesia
Abstract
This paper aims to assess the discrepancies in sentencing corruptors by judges in Indonesia’s judicial system. The data are based on the Supreme Court’s decisions during the period of 2001-‐2009 which available in public domain in www.putusan.mahkamahagung.go.id. The data comprise of 549 cases, which involved 831 defendants. The defendants have been classified into five groups depending on their alleged scales of corruptions (i.e. petty, small, medium, large and grand scale of corruptions).
The explicit cost of corruption during the period of 2001-‐2009 was Rp73.1 trillion (about US $7.86 billion). In this paper, total financial punishment was estimated as the summation of the value of fines, seizure of assets (monetary only), and the compensation order sentenced by judges. The total financial punishment sentenced by the supreme judges during the period of 2001-‐2009 was Rp5.33 trillion (about US$573.12 million), therefore Rp67.77 trillion (US$7.28 billion) gap between the explicit cost of corruption and total financial punishment sentenced shall be borne by the tax payers.
Logistic and Tobin’s logistic (TOBIT) regressions have been used to analyse both the likelihood and the intensity of sentencing offenders, respectively, with particular punishments (i.e. imprisonment, fines, compensation order, etc.). The results show that the probability and the intensity of sentencing across various types of punishment do not correspond to the scale of corruptions. Offenders who committed petty and small scales corruption tend to be punished more severely than their medium, large and grand corruptors.
Keywords: Corruption, Court Decisions, Probability of Sentencing, Intensity of Sentencing, Logistic Regression, Tobin’s Logistic (TOBIT) Regression.
JEL Classifications: D02, D04, K14, K42
1
I would like to express my gratitude to conference participants in Kolkata, India, Perth, Scotland, Cambridge, UK for constructive feedback. I am indebted to Harry Gemilang, Seri Damayanti, Sony Sasongko for excellent assistantship in collecting the data. All remaining errors are my responsibility.
2
1. Introduction
According to the utilitarian approach, the decision of a potential offender to commit an
offence or not depends on the expected costs and benefits of the conduct. The expected
costs of conducting an offence has been modelled as the interaction between any costs
incurred (financially and non-‐financially) by the potential offenders if they have would
have failed in committing an offence and the probability of being caught. Similarly, the
expected benefits of conducting an offence can be estimated as the probability of
success in conducting an offence and any gains (tangible and intangible) arose from
conducting the offence. Becker (1968) used decision theory to analysed offenders and
potential offenders behaviour. Excellent literature surveys in this area have been
conducted by various authors including Garoupa (1997), Eide (2000, 2004), Bowles (2000)
and Polinsky and Shavell (2000, 2007).
Another group of economists who use game theoretical analysis tend to be more pessimistic
about the effectiveness of punishment as a mean to deter offending (Tsebelis, 1989). This
article triggered a long debate involving several authors, including
Bianco/Ordershook/Tsebelis (1990), Weissing and Ostrom (1991), Hirshleifer and Rasmusen
(1992), Tsebelis (1990, 1991, 1992, 1993) and Andreozzi (2004). Recently Pradiptyo (2007)
refined the inspection game proposed by Tsebelis, and showed that actually there is not so
much discrepancy in the solution between decision theory and game theoretical
approaches.
Irrespective of whether the approach is using either decision theory or game theory, it
is assumed that potential offenders are rational. Individuals are going to commit an
offence if the expected benefits of the activity exceed the expected costs of offending.
Consequently, in order to deter individual from committing an offence, the authority
may increase the expected costs of offending bourned by potential offenders.
Attempts to increase the expected costs of offending can be done in several ways. The
criminal justice authority may endeavour either to increase the probability of
conviction, or alternatively, they may increase the severity of punishment. Indeed both
possible scenarios are costly. In order to achieve the optimum level of deterrence,
however, the criminal justice authority has two possible scenarios either by setting low
of detection with low intensity of punishment (Becker, 1968, Garoupa, 1997, Garoupa
and Klerman, 2002, 2004, Polinsky and Shavell, 2000, 2001, 2007).
A similar approach may be used in tackling corruptions. Any potential corruptors are
rational individuals and accordingly they would conduct costs-‐benefits analysis prior to
involve in corruptions. As applicable to other type of offences, the intensity of
corruptions can be divided into several groups for instance small, medium and large
scales of corruptions. The classification of the groups depends on the intensity of
misallocation of resources owing to corruptions. Ideally, given the probability of
detection and conviction, corruptors who committed larger scale of corruptions should
receive sentence with higher intensity of punishment. In the case for which the courts
determined to use financial punishment, then ideally a substantially higher intensity of
financial punishment should be sentenced to more serious corruptors.
It should be noted that the characteristics of corruptors tend to be different in
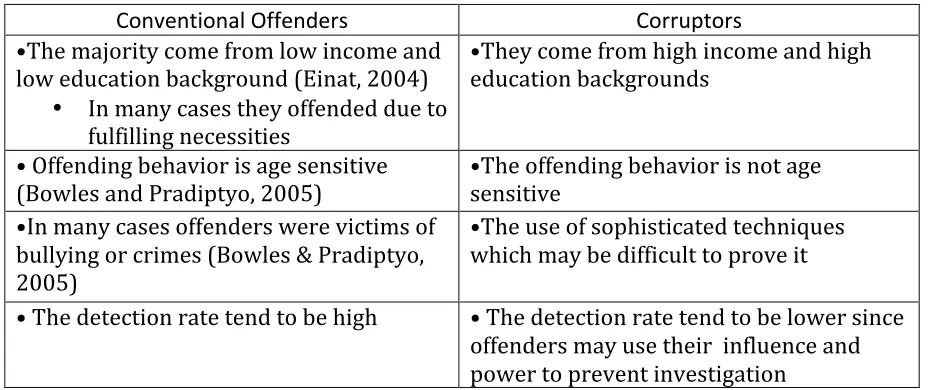
comparison to offenders conventional crimes. Table 1 provides comparison of
characteristics between conventional offenders and corruptors. It may not be
surprising, therefore, that combating corruptions is more difficult than tackling
conventional crimes.
Table 1: Characteristics of Conventional Offenders and Corruptors
Conventional Offenders Corruptors
•The majority come from low income and low education background (Einat, 2004)
• In many cases they offended due to fulfilling necessities
•They come from high income and high education backgrounds
• Offending behavior is age sensitive (Bowles and Pradiptyo, 2005)
•The offending behavior is not age sensitive
•In many cases offenders were victims of bullying or crimes (Bowles & Pradiptyo, 2005)
•The use of sophisticated techniques which may be difficult to prove it
• The detection rate tend to be high • The detection rate tend to be lower since offenders may use their influence and power to prevent investigation
This paper aims to assess Indonesia’s court decisions in combating corruptions across
various scales of corruptions. The data used in this study are based on the Indonesia
[image:4.595.64.532.485.680.2]involving 831 defendants. All cases have been published in the official website of the
Supreme Court in the following URL: http://putusan.mahkamahagung.go.id. The gravity
of corruption and various anti corruption programs in Indonesia is discussed in section
2. Section 3 discusses the judicial system in Indonesia. Logistic and Tobin’s logistic
regressions are used to evaluate the Supreme Court’s decisions. The model and the
results of the analysis are discussed in section 4 and 5, respectively.
2. Corruption and Anti Corruption Programs in Indonesia
The Corruption Perception Index (CPI) in 2011 by the Transparency International
placed Indonesia as the 100th country out of 183 countries in the world. In 2011, the CPI
for Indonesia was 3.0, a small increase from CPI in 2010 that was 2.8. In 1999 the CPI of
Indonesia was just 1.9 (See Figure 1). Indeed, according to the CPI, there is an
improvement of condition in Indonesia, with respect to the perception of the subjects
who take part in as respondents for developing the CPI. The improvement may not,
however, necessarily sufficient to show the improvement in Indonesia.
Figure 1: The Corruption Perception Index (CPI) of Indonesia 1999-‐2011
Source: Transparency International, 1999-‐2011.
Recently, a survey by Hong Kong-‐based Political & Economic Risk Consultancy Ltd in
2010 scored Indonesia 9.07 out of 10.00 and placed Indonesia as the most corrupt
country in Asia-‐Pacific region. This result was higher in comparison to 2009, which was
1.9 1.9 1.9 1.9 1.9 2
2.2 2.4 2.3
2.6 2.8 2.8 3
0 0.5 1 1.5 2 2.5 3 3.5
1999 2000 2001 2002 2003 2004 2005 2006 2007 2008 2009 2010 2011
[image:5.595.75.514.438.652.2]7.69. It turns out that problem of corruption in Indonesia is more acute then other
countries in the region such as Cambodia, the Philippines, India, Thailand and Vietnam.
Corruptions in Indonesia had been flourished since the end of President Soekarno’s
regime. Under President Suharto’s regime, corruptions had become spread out to all
level of bureaucracy. After the end of President Suharto’s regime, reformations have
been conducted in various fields, including politic, economic and also law. Anti
corruptions programmes have been launched by the GoI post Suharto’s era, ranging
from:
1. Ratification of Law no 31/1999 or Anti Corruption Act, which then be amended
in 2001 by Law no 20/2001;
2. Ratification of Law no 30/2002 which mandated the establishment of Corruption
Eradication Committee (KPK) and the KPK has been fully operated since 2004;
3. Ratification of Law 15/2002 of Anti Money Laundering Act, which mandated the
establishment of Indonesian Financial Transaction Reports and Analysis Centre
(PPATK) and the institution, has been fully operated since 2005. The act, then,
was amended by Law no 8/2010.
4. In 2003 the Ministry of Finance has pioneered bureaucratic reformation which
have been followed by other government departments up until now.
The Anti Corruption bill has been ratified in year 1999 and was refined in year 2001.
Indonesia has a penal law which is based in the Dutch penal law in 1811. Corruption has
been considered as an extra ordinary crime; therefore it requires a special law to tackle
it which is different from the Indonesia penal law.
In 2002, the GoI also ratified anti money laundering act, which is separate from the anti
corruption act. The act provided the basis to form PPATK and the body has been fully
functioning since 2005. Different from KPK, the PPATK does not have the power to
bring defendants to courts. Instead, the PPATK functions as an intelligent unit, which
provide information to law enforcement agencies such as police, KPK and office of
prosecutor. Recently, the GoI refined the act in 2010 which provide a stronger position
of PPATK to share any information that they obtained to other law enforcement
In year 2002, the parliament ratified a bill which became the foundation for the
Corruption Eradication Committee. The Committee is an independent body which the
main task is to tackle large-‐scale corruptions (i.e. Rp 1 billion or more). The Committee
has been financed by government budget, however they report to the parliament and
they do not report to President. The Committee has been fully operational since 2004.
Since then, corruptions have been dealt by two groups of law enforcers. For large scale
corruptions (Rp 1 billion or more) have been tackled by the Committee, whereas for
medium and small scales corruptions (less then Rp 1 billion) have been tackled by
Police and Public Prosecutors. It should be noted that the committee may have a more
powerful authority than the police in investigating corruptions. Furthermore the
committee has been equipped with more sophisticated instrument which enable them
to intercept any type of communication between suspects and their counterparts.
3. Judicial System in Indonesia
Indonesia follows continental law system and its’ penal code is based on 1881 Dutch
penal code. Although, the Dutch has amended its penal code in 1994, the Dutch the
penal code 1881 still has been implementing in Indonesia until now. It should be noted
that the judicial system in Indonesia does not recognise the use of juries, instead the
decisions whether a defendant guilty or not depends on the decisions of board of judges.
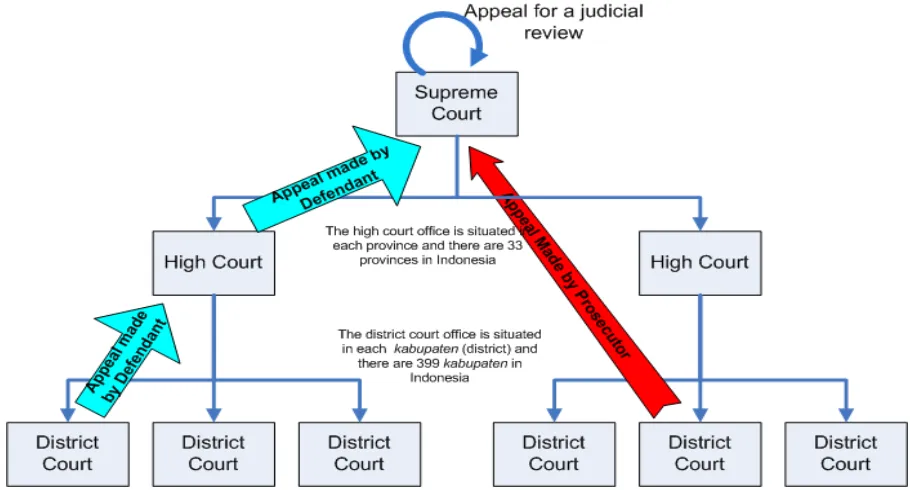
Under Indonesia criminal justice system, all criminal cases should be trialled before
District Courts. Each District Court is situated in a Kabupaten (district) and there are
497 districts in Indonesia. Judges’ decisions in a district court may be appealed either by
defendants or prosecutors if they dissatisfied with the decisions. In the event that the
defendant does the appeal, which occurs in most corruption cases, then the case is
referred to the High Court, which situated in the capital of each province. In the case for
which the defendant does not satisfy with judges’ decisions in the High Court, a further
appeal can be made to the Supreme Court. On the contrary, if the prosecutor does not
satisfy with judges’ decisions in the District court, the case may be appeald directly to
the Supreme Court.
After the Supreme Court sentenced the case, there is still an opportunity for conducting
further appeal called a judicial re-‐examination by the Supreme Court. The judicial re-‐
before trial previously. It should be noted that the cost of court in Indonesia is
economical. The judicial system in Indonesia rules that the there are three possible
values of the court costs, namely Rp2500 to Rp10,000 (US$0.29 – 1.16), irrespective of
how long the trials have been conducted.
Figure 2: Appeal Process under Indonesia Judicial System
Figure 2 shows the complexity of judicial system in Indonesia, starting from the
detection by Police to the judicial review in the Supreme Court. The data used in this
study are based on the Supreme Court decisions, both with and without any judicial
review. Similar to other types of crime, the underlying number of corruptions is
unknown in Indonesia. As the only information obtained was the Supreme Court
decisions, any attempt to estimate the detection rate of corruptions would be daunting.
There are strong tendencies that appeal have been made up until the Supreme Court for
the corruption cases3. In the case for which all corruption cases in the District Court
have been appealed up to the Supreme Court, then the unobserved heterogeneity
number 1 and 2 can be ignored. Nevertheless, points 3-‐5 are more serious and
unfortunately the information may not be available. In essence the number of cases
sentenced by the Supreme Court might be a tip of an iceberg of the underlying
corruption cases in Indonesia.
3
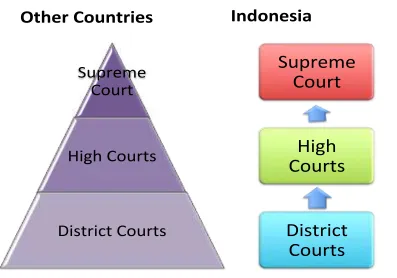
[image:8.595.69.524.201.446.2]Figure 3: Comparison of Appeal Cases in Indonesia and Other Countries
The conviction rate may be estimated from the data set and it should be noted that
information in the Supreme Court decisions are very rich. Each the Supreme Court
decision contains all information on the previous stage courts decisions. Therefore it is
possible to trace back all information regarding the trials, evidence and also decisions in
three different courts (i.e. District Courts, High Courts and the Supreme Court). By
using a strict assumption that all corruptions cases put before the District Courts were
appealed until the Supreme Court, then the conviction rate start from the State Court
may be estimated4. It should be noted that none of the defendant or offender appeared
more than one cases, therefore the data may not be able to support reconviction
analysis.
Any attempt to analyse the data set may face unobserved heterogeneity issues. The
unobserved heterogeneity arose from the fact that the data obtained record only any
cases put before trials up until the Supreme Court. At least there are two potential
source of unobserved heterogeneity. Firstly, a case in the District Court may be
appealed either to the High Courts (by offenders) or to the Supreme Court (by
4
An informal discussion with an Indonesia penal law expert, Dr. Eddy OS Hiarej, strengtened the assumption that almost all corruption cases have been appealed.
Other&Countries&
Indonesia&
Supreme'
Court'
High'
Courts'
District'
Courts'
Supreme'
Court'
High'Courts'
District'Courts'
[image:9.595.82.479.111.389.2]prosecutors). Secondly, some cases in the Supreme Court have been undergone a
judicial review. In order to minimise the unobserved heterogeneity, both variables
should be incorporated in the regression models.
Since the information is based on the Supreme Court decision, the analysis suffers from
unobserved heterogeneity which were affected by several factors below:
1. The number of cases terminated up until the High Courts
2. The number of cases terminated up until the District Courts
3. The number of cases referred from Police to Prosecutors but not being
prosecuted
4. The number of cases reported to and detected by police but not being processed
or referred to prosecutors
5. The number of unreported/undetected corruptions
Under Indonesia’s penal code, the intensity of punishment should be stated clearly for
each type of offences in the Bill. There are various type of punishments in the Bill
including imprisonment, parole, fines, subsidiary of fines, compensation order,
subsidiary of compensation order, the seizure of evidence, the court costs and other
sentences (see Appendix A). In this study we defined financial punishment as the
summation of money levied through fines, compensation order and the amount of
money seized as evidence. The courts may seized other types of assets which were
suspected as the result from corruptions, such as cars, houses, apartments, etc, however
these assets were not included in our calculation due to its complexity.
The values of court costs5 and other sentences were also neglegible. The values of the
court costs were either Rp2500 (US$0,27), Rp5000 (US$ 0,54) or Rp10,000 (US$ 1.08).
These values, suprisingly, applicable for any type of offences. Other sentences were not
applicable for most offenders and there were complexity in converting the order to
monetary value.
5
4. Model
The optimum deterrence effect of sentencing is subjects of two factors, namely the
probability of conviction and the intensity of punishment. Irrespective of whether the
analysis is based on decision theory or game theory, the deterrence effect of conviction
arose from the combination of the both factors (Becker, 1968, Garoupa, 1997, Shavel
and Polinsky, 2000, 2007, Pradiptyo, 2007).
The probability of conviction and also the probabilities of receiving a particular type of
punishment have been estimated using Logistic regression. Logistic regression is part of
limited dependent variable analysis, whereby the values of the dependent variable are
binary (e.g. 1 or 0, yes or no, male or female, etc) as a function of a stream of
explanatory variables. The result obtained from Logistic regression provides
information on the direction and the level of significant of each explanatory variables in
affecting the likelihood even in the dependent variable. Thus far, the coefficients in the
Logistic regression do not mean anything apart from providing information on the
direction and the significant of the variables. The contribution of each explanatory
variables to influenced the dependent variable will be obtained if we estimate the
marginal effect of the Logistic regressions.
The intensity of each punishment would be estimated by the use of Tobit Logistic
(TOBIT) regression. The TOBIT analysis has been used since the value of dependent
variable is bounded below, namely the data cannot be negative. As the minimum value
of any type of punishment is zero, the parameter estimate would be biased if we use
least square method. In order to overcome the problem, the TOBIT regression, which is
part of maximum likelihood method, has been used to estimate the impact of various
criminogenic factors to the intensity of various punishment.
Attempt will be made to present both Logistic and TOBIT regressions in a table,
therefore the information on the probability of conviction and the intensity of
sentencing can be observed and analysed simultaneously.
𝐷_𝑆𝐶_𝐺𝑢𝑖𝑙𝑡𝑦!=𝑎+𝑏
!𝐺𝑒𝑛𝑑𝑒𝑟!+𝑏!𝐿𝑛(𝐴𝑔𝑒)!+𝑏!𝐿𝑛(SocCost)!
+𝑏
!𝐷_𝑆𝑂𝐸_𝐸𝑚𝑝!+𝑏!𝐷_𝑀𝑃!+𝑏!𝐷_𝑃𝑟𝑖𝑣𝑎𝑡𝑒!+ 𝑏!𝐷_𝐽𝑎𝑤𝑎!
+𝑏!𝐷_𝐺𝑟𝑒𝑎𝑡𝑒𝑟𝐽𝑎𝑘𝑎𝑡𝑎!+𝑏!𝐷_𝐺𝑟𝑎𝑛𝑑_𝐶𝑜𝑟𝑟!+𝑏!"𝐷_𝐿𝑎𝑟𝑔𝑒_𝐶𝑜𝑟𝑟!
+𝑏
!!𝐷_𝑆𝑚𝑎𝑙𝑙_𝐶𝑜𝑟𝑟!+𝑏!"𝐷_𝑃𝑢𝑛𝑦_𝐶𝑜𝑟𝑟!+𝑏!"𝐷𝐶_𝐺𝑢𝑖𝑙𝑡𝑦!+𝑏!"𝐷_𝐻𝑖𝑔ℎ𝐶𝑜𝑢𝑟𝑡!
+𝑏!"𝐷_𝐽𝑢𝑑𝑖𝑐𝑖𝑎𝑙_𝑅𝑒𝑣!
Whereby
D_SC_Guiltyi = Dummy variable whether the Supreme Court found defendant guilty (1 =
Yes, 0 = Otherwise)
Gender = Gender of defendant (1 = Male, 0 = Female) Ln(Age) = Natural logarithmic function of age of defendant
Ln(SocCost)i = Natural logarithmic function of Social costs of corruptions estimated by
prosecutors in nominal price (limited to explicit costs)
D_SOE_Empi = Dummy variable whether a defendant worked as State-‐Owned
Enterprise’s Employee (1 = Yes, 0 = otherwise)
D_MPi = Dummy variable whether the defendant were Member of the Parliament (1 =
Yes, 0 = otherwise)
D_Privatei = Dummy variable whether a defendant worked in private sector (1 = Yes, 0 =
Otherwise)
D_ Jawa = Dummy variable whether the corruption was committed in the Island of Jawa (1 = Yes, 0 = otherwise)
D_GreaterJakarta = Dummy variable whether the corruption was committed in Greater Jakarta (1 = Yes, 0 = otherwise)
D_Grand_Corr = Dummy variable whether the defendant commited grand scale of corruptions, i.e. Rp25 Billion or above (1 = Yes, 0 = Otherwise) D_Large_Corr = Dummy variable whether the defendant commited large scale of
corruptions, i.e. from Rp 1 Billion to up to but not including Rp25 Billion (1 = Yes, 0 = Otherwise)
D_Small_Corr = Dummy variable whether the defendant commited small scale of
corruptions, i.e. Rp10 million to up to but not including Rp100 million (1 = Yes, 0 = Otherwise)
D_Petty_Corr = Dummy variable whether the defendant commited a petty scale of corruptions, i.e. up to but not including Rp10 million (1 = Yes, 0 = Otherwise)
DC_Guiltyi = Dummy variable whether District Courts found finesnt guilty (1 = Yes, 0 =
Otherwise)
D_HighCourt = Dummy variable whether the case was appealed to the Supreme Court after being sentenced by the HighCourt (1 = Yes, 0 = Otherwise)
D_Judicial_Rev = Dummy variable whether after the Supreme Court sentenced the defendant, the decisions were requested to be reviewed.
In the model above, the decisions made by District and High Courts serve as
independent variables. The aims of using this variable is to investigate the consistency
between the decisions made by the District and the High Courts in comparison to the
The occupations of defendants were classified into four groups, namely Civil Servant,
State-‐Own Enterprise’s Employee, Senator and those who worked in private sector. In
this model, civil servant has served as a reference to the other occupations.
Furthermore, the corruptions were also classified into five different scales, namely
grand, large, medium, small and petty corruptions. In the model above, the medium
scale of corruptions has served a reference. The merit of using medium scale as a
reference is the ability of the model to observe any difference in the intensity of
punishment between large and grand corruptions in one side with petty and small
corruptions on the other side. This approach enable us to deduce whether the court
tend to treat different class of offenders differently.
In this study, the scale of corruptions have been classified into five groups, namely:
1. Petty corruption (up to but not including Rp10 million or US$1,075),
2. Small corruption (from Rp10 million to up to but not including Rp 100 million or
US$10,753),
3. Medium corruption (from Rp 100 million to up to but not including Rp 1 billion
or US$107,527),
4. Large corruption (from Rp 1 billion to up to but not including Rp 25 billion or
US$2,688,172) and
5. Grand corruption (Rp 25 billion or above)
As previously discussed, the appeal system to the Supreme Court in Indonesia is quite
unique. Not all cases which were appealed to the Supreme Court have got through High
Courts. In order to observed possible unobserved heterogeneity among different routes
of appeal to the Supreme Court a dummy variable named D_HighCourt was included in
the model. Similarly another dummy variable named D_Judicial_Rev has been employed
in order to observed possible variation in the probability of conviction whether or not
the judicial review has been conducted to the initial Supreme Court decisions.
Similar to the regression model to estimate the likelihood of conviction by the Supreme
Court, a similar approach was used to estimate the likelihood of offenders being
sentenced by various types of punishments. The Logistic regression model of the
likelihood of sentencing various types of punishments are summaries i the following
𝐷_𝑆𝐶_𝑃𝑢𝑛𝑖𝑠ℎ𝑚𝑒𝑛𝑡 ! !
=𝑎+𝑏
!𝐺𝑒𝑛𝑑𝑒𝑟!+𝑏!𝐿𝑛(𝐴𝑔𝑒)!+𝑏!𝐿𝑛(SocCost)! +𝑏
!𝐷_𝑆𝑂𝐸_𝐸𝑚𝑝!+𝑏!𝐷_𝑀𝑃!+𝑏!𝐷_𝑃𝑟𝑖𝑣𝑎𝑡𝑒!+ 𝑏!𝐷_𝐽𝑎𝑤𝑎! +𝑏!𝐷_𝐺𝑟𝑒𝑎𝑡𝑒𝑟𝐽𝑎𝑘𝑎𝑡𝑎!+𝑏!𝐷_𝐺𝑟𝑎𝑛𝑑_𝐶𝑜𝑟𝑟!+𝑏!"𝐷_𝐿𝑎𝑟𝑔𝑒_𝐶𝑜𝑟𝑟!
+𝑏
!!𝐷_𝑆𝑚𝑎𝑙𝑙_𝐶𝑜𝑟𝑟!+𝑏!"𝐷_𝑃𝑢𝑛𝑦_𝐶𝑜𝑟𝑟!+𝑏!"𝐷𝐶_𝐺𝑢𝑖𝑙𝑡𝑦!+𝑏!"𝐷_𝐻𝑖𝑔ℎ𝐶𝑜𝑢𝑟𝑡! +𝑏!"𝐷_𝐽𝑢𝑑𝑖𝑐𝑖𝑎𝑙_𝑅𝑒𝑣!
D_SC_Punishmentij = Dummy variable whether the Supreme Court sentenced defendant
i with punishment j
DC_Punishmentij = Dummy variable whether the Supreme Court sentenced defendant i
with punishment j
The regression model in this analysis is similar to the regression model in the previous
analysis, however, the difference lies in the sample of offenders who can be included for
these analyses. The types of punishment are relevant only to those who were found
guilty by the Supreme Court. Given that the subgroup of defendants were found guilty,
the further question is which factors affect the likelihood of offenders were sentenced
with a certain type of punishment as oppose to other possible punishments.
In order to estimatevarious factor which attributable to the intensity of each type of
punishments sentenced to offenders, Tobin’s Lnit (TOBIT) analysis has been conducted.
The reason of using TOBIT regression is due to the fact that the intensity of punishment
is always be positive or it cannot be lower than zero.
𝑆𝐶_𝑃𝑢𝑛𝑖𝑠ℎ𝑚𝑒𝑛𝑡 ! !
=𝑎+𝑏
!𝐺𝑒𝑛𝑑𝑒𝑟!+𝑏!𝐿𝑛(𝐴𝑔𝑒)!+𝑏!𝐿𝑛(SocCost)! +𝑏
!𝐷_𝑆𝑂𝐸_𝐸𝑚𝑝!+𝑏!𝐷_𝑀𝑃!+𝑏!𝐷_𝑃𝑟𝑖𝑣𝑎𝑡𝑒!+ 𝑏!𝐷_𝐽𝑎𝑤𝑎!
+𝑏!𝐷_𝐺𝑟𝑒𝑎𝑡𝑒𝑟𝐽𝑎𝑘𝑎𝑡𝑎!+𝑏!𝐷_𝐺𝑟𝑎𝑛𝑑_𝐶𝑜𝑟𝑟!+𝑏!"𝐷_𝐿𝑎𝑟𝑔𝑒_𝐶𝑜𝑟𝑟!
+𝑏
!!𝐷_𝑆𝑚𝑎𝑙𝑙_𝐶𝑜𝑟𝑟!+𝑏!"𝐷_𝑃𝑢𝑛𝑦_𝐶𝑜𝑟𝑟!+𝑏!"𝐷𝐶_𝐺𝑢𝑖𝑙𝑡𝑦!+𝑏!"𝐷_𝐻𝑖𝑔ℎ𝐶𝑜𝑢𝑟𝑡! +𝑏!"𝐷_𝐽𝑢𝑑𝑖𝑐𝑖𝑎𝑙_𝑅𝑒𝑣!
where:
SC_Punishment = the intensity of punishment j sentenced to defendant i.
5. Results
Information from the dataset shows that the majority of defendants were male (93.1%)
and only small fraction were female (6.9%). None of defendants who committed Grand
)who were prosecuted for Grand scale corruptions . The number of defendants who
were prosecuted for large corruptions were 201, of which 190 defendants were male
(94.5%).
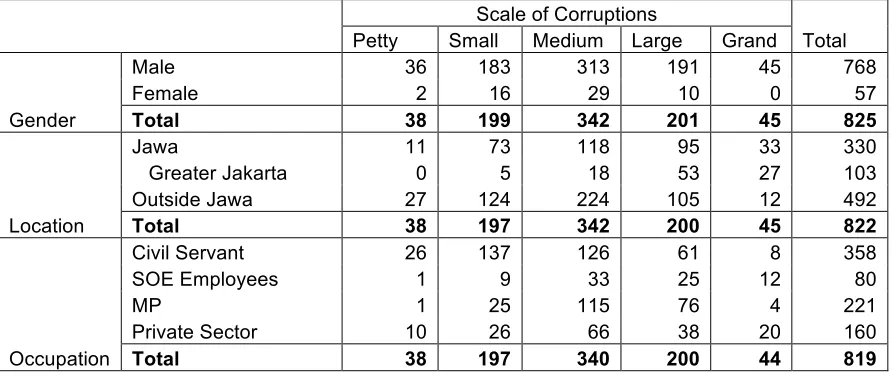
Table 2: Distribution of Defendants According to the Scale of Alleged Corruptions
Scale of Corruptions
Total Petty Small Medium Large Grand
Gender
Male 36 183 313 191 45 768
Female 2 16 29 10 0 57
Total 38 199 342 201 45 825
Location
Jawa 11 73 118 95 33 330
Greater Jakarta 0 5 18 53 27 103
Outside Jawa 27 124 224 105 12 492
Total 38 197 342 200 45 822
Occupation
Civil Servant 26 137 126 61 8 358
SOE Employees 1 9 33 25 12 80
MP 1 25 115 76 4 221
Private Sector 10 26 66 38 20 160
Total 38 197 340 200 44 819 Source: Indonesia Supreme Court, calculated.
Table 2 shows that more than 50% of defendants committed their alleged corruptions
in outside Jawa. Of 330 alleged corruption cases in Jawa 31,2% have been committed in
Greater Jakarta (GreaterJakarta6). There is a tendency that the grand-‐scale of
corruptions were committed in Jawa, especially in Jakarta. This may not be surprising as
Jakarta is the capital city and the centre of administration in Indonesia. About 90% of
money has been circulated in Jawa and more than 47% of money has been circulated in
Jakarta.
Civil servants tend to dominate petty and small scales corruptions as opposed to
individuals from the other occupations. On the other hand, the defendants who worked
in private sector dominate the alleged grand scale of corruptions. Indeed, the coverage
of the anti corruption act in Indonesia is limited to civil servants, member of
parliaments and also state-‐owned enterprise employees, howerver, individuals who
work in private sector may become defendants as they may involve in corruption of
government procurements.
6
[image:15.595.72.519.172.360.2]Corruptions create misallocation of resources, therefore any attempt to estimate the
cost of corruptions should be taken into consideration both explicit and implicit costs of
corruptions. Unfortunately this is not the case in Indonesia as prosecutors, who mostly
never received training in economics, have calculated the cost of corruptions limited to
the explicit cost only. The consequences are that the costs of corruptions have been
underestimated and there might be many cases of error types I and II in convicting
defendants.
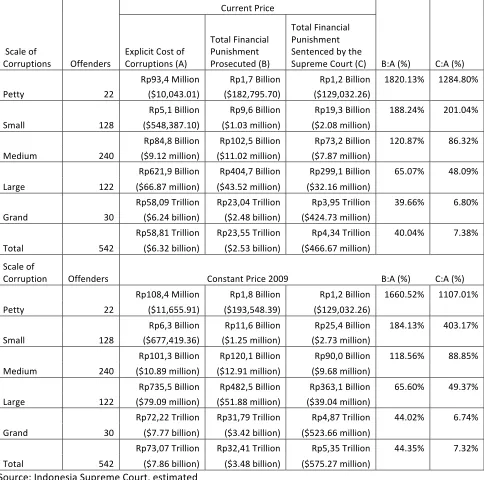
Table 3 shows that comparison between the total explicit costs, the total financial
punishment prosecuted and total financial punishment sentenced by the Supreme
Courts across various scales of corruptions. Offenders who commit petty scale of
corruptions tend to be sentenced most severely than their counterparts. Although the
total costs of corruptions they inflicted to society was Rp 93.4 million, they were
prosecuted and sentenced for Rp1.7 billion (1800.3%) and Rp 1.2 billion (1234.8%),
respectively. A similar anomaly occurs to offenders with small scale corruptions. The
total financial punishment sentenced to them was more than double than that of
prosecuted. The B:A ratio to this type of offenders was 186.6%, however the C:A ratio
was 375.8%. Both types of offenders tend to be unfortunate as they received financial
punishment more than the cost they inflicted.
The features of financial punishment sentenced for both petty and small scale
corruptors may not be found on the other classes of corruptors. Indeed the medium
scale corruptors were prosecuted for financial punishment for 120.9% above the cost of
corruptions they inflicted. Nevertheless, the Supreme Court sentenced them with
financial punishment worths 86.3% of their total cost of corruptions. The cost of
corruptions attributable by this group was Rp84.8 billion, however they were sentenced
with financial punishment worths Rp73.2 billion.
Table 3: Comparison between Cost of Corruption and Financial Punishment Sentenced
Scale of
Corruptions Offenders
Current Price
B:A (%) C:A (%) Explicit Cost of
Corruptions (A)
Total Financial Punishment Prosecuted (B)
Total Financial Punishment Sentenced by the Supreme Court (C)
Petty 22
Rp93,4 Million Rp1,7 Billion Rp1,2 Billion 1820.13% 1284.80% ($10,043.01) ($182,795.70) ($129,032.26)
Small 128
Rp5,1 Billion Rp9,6 Billion Rp19,3 Billion 188.24% 201.04% ($548,387.10) ($1.03 million) ($2.08 million)
Medium 240
Rp84,8 Billion Rp102,5 Billion Rp73,2 Billion 120.87% 86.32% ($9.12 million) ($11.02 million) ($7.87 million)
Large 122
Rp621,9 Billion Rp404,7 Billion Rp299,1 Billion 65.07% 48.09% ($66.87 million) ($43.52 million) ($32.16 million)
Grand 30
Rp58,09 Trillion Rp23,04 Trillion Rp3,95 Trillion 39.66% 6.80% ($6.24 billion) ($2.48 billion) ($424.73 million)
Total 542
Rp58,81 Trillion Rp23,55 Trillion Rp4,34 Trillion 40.04% 7.38%
($6.32 billion) ($2.53 billion) ($466.67 million)
Scale of
Corruption Offenders Constant Price 2009 B:A (%) C:A (%)
Petty 22
Rp108,4 Million Rp1,8 Billion Rp1,2 Billion 1660.52% 1107.01% ($11,655.91) ($193,548.39) ($129,032.26)
Small 128
Rp6,3 Billion Rp11,6 Billion Rp25,4 Billion 184.13% 403.17% ($677,419.36) ($1.25 million) ($2.73 million)
Medium 240
Rp101,3 Billion Rp120,1 Billion Rp90,0 Billion 118.56% 88.85% ($10.89 million) ($12.91 million) ($9.68 million)
Large 122
Rp735,5 Billion Rp482,5 Billion Rp363,1 Billion 65.60% 49.37% ($79.09 million) ($51.88 million) ($39.04 million)
Grand 30
Rp72,22 Trillion Rp31,79 Trillion Rp4,87 Trillion 44.02% 6.74% ($7.77 billion) ($3.42 billion) ($523.66 million)
Total 542
Rp73,07 Trillion Rp32,41 Trillion Rp5,35 Trillion 44.35% 7.32% ($7.86 billion) ($3.48 billion) ($575.27 million)
Source: Indonesia Supreme Court, estimated
Offenders who committed large and grand scales of corruptions tend to be more
‘fortunate’ than their counterparts who committed petty to medium scales of
corruptions. The offenders who committed large and grand scales of corruptions were
prosecuted with financial punishment about 65.07% and 39.66%, respectively, of their
cost they have been inflicted to society. The ratio between the total financial
punishment sentenced and the cost of corruptions decreased to 49.37% and 6.74%,
respectively, for large and grand scale of corruptors, when they were sentenced by the
[image:17.595.74.558.99.579.2]society worth Rp58.09 trilion, however the Supreme Court punished them with
financial punishment worth Rp3.95 trillion (6.8%). If the estimation has been done in
real price, then using price in 2009 as the constant price, then all offenders inflicted the
cost of corruptions Rp73.07 trillion. Surprisingly, they were sentenced by the Supreme
Court to pay the total financial punishment woths only Rp4.87 trillion (6.7%).
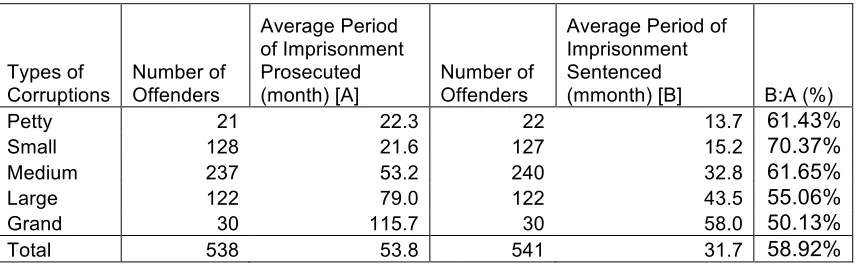
Table 4: The Comparison of Average Imprisonment Prosecuted and Sentenced
Types of Corruptions
Number of Offenders
Average Period of Imprisonment Prosecuted (month) [A]
Number of Offenders
Average Period of Imprisonment Sentenced
(mmonth) [B] B:A (%)
Petty 21 22.3 22 13.7 61.43%
Small 128 21.6 127 15.2 70.37%
Medium 237 53.2 240 32.8 61.65%
Large 122 79.0 122 43.5 55.06%
Grand 30 115.7 30 58.0 50.13%
Total 538 53.8 541 31.7 58.92%
Source: Indonesia Supreme Court, estimated
Further exploration on the sentencing for imprisonment found a similar pattern. Table
4 shows that, again, petty to medium scales of corruptors tend to be sentenced more
severly in comparison to the other counterparts. The ratio of the average imprisonment
sentenced to the average of imprisonment prosecuted by the Supreme Court were
55.0% and 50.1%, respectively, for both large and grand scales corruptors. In contrast,
the same ratios were 61.4%, 70.3% and 61.6%, respectively for petty, small and
medium scales of corruptors.
It should be noted that the length of imprisonment above was based on the Supreme
Court’s decision and it did not reflect the actual length of imprisonment. The actual
length of imprisonment tend to be shorter as every year, especially on the independence
day, the government grants remission to offenders including corruptors. In general the
actual length of imprisonment was about 60% of the Supreme Court’s sentencing.
The findings above give rise various unanswered questions which should be
investigated further in the near future. Why do prosecutors and judges tend to treat
offenders differently? Why do both petty and small scale corruptors tend to be treated
[image:18.595.73.501.212.346.2]more lenienced toward large and Grand scales of corruptors? What are the
consequences which may arise due to the unfair sentencing as it was found above?
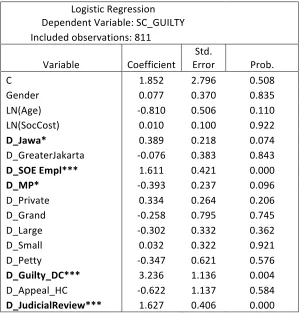
Table 5 provides information on various factors attributable to the probability of conviction
in corruption cases in Indonesia. The result shows that the Supreme Court is highly likely to
support District Courts’ decisions. A defendant who was found guilty by the District Courts is
highly likely to be found guilty by the Supreme Court. Obviously any attempt to appeal is
costly, however defendants tend to pursue to appeal when Distric Court decided that they
were guilty.
Table 5: Logistic Regression of Conviction by the Supreme Court
Logistic Regression Dependent Variable: SC_GUILTY
Included observations: 811
Variable Coefficient
Std.
Error Prob.
C 1.852 2.796 0.508
Gender 0.077 0.370 0.835
LN(Age) -‐0.810 0.506 0.110
LN(SocCost) 0.010 0.100 0.922
D_Jawa* 0.389 0.218 0.074
D_GreaterJakarta -‐0.076 0.383 0.843
D_SOE Empl*** 1.611 0.421 0.000 D_MP* -‐0.393 0.237 0.096
D_Private 0.334 0.264 0.206
D_Grand -‐0.258 0.795 0.745
D_Large -‐0.302 0.332 0.362
D_Small 0.032 0.322 0.921
D_Petty -‐0.347 0.621 0.576
D_Guilty_DC*** 3.236 1.136 0.004
D_Appeal_HC -‐0.622 1.137 0.584
D_JudicialReview*** 1.627 0.406 0.000 Source: Indonesia Supreme Court, estimated Note:
*) significant at α = 10%; **) significant at α = 5%; ***) significant at α = 1%.
[image:19.595.149.445.288.600.2] [image:19.595.148.448.290.604.2]Defendants who worked as State-‐Own Enterprise’s Employees tend to have a higher
probability to be found guilty as opposed to those who worked in private sectors. Similarly,
MPs who were prosecuted in corruptions tend to have a higher probability to be found
guilty in comparison to those who worked in private sector. It should be noted, however,
that this finding is significant only at α = 10%.
The result suggests that the probabilty of conviction in corruption cases do not depends on
geographical distribution. Whether the case was committed in the island of Jawa or outside
Jawa, or whether the case was committed in Greater Jakarta or outside Greater Jakarta, the
result show that the probability of conviction is not statistically significant. The probability of
conviction does not vary across various scale of corruptions, meaning that the probability of
conviction faced by a petty scale corruptor cannot be differentiated with the probability of
conviction faced by a grand scale corruptor.
The result suggests also that requesting a judicial review may be counterproductive to the
defendants. Defendants who requested the Supreme Court to conduct a judicial review over
the Supreme Court initial decision is more likely to be convicted and this result is significant
at α = 1%.
According to Becker (1968) given the probability of conviction, a deterrence effect of
punishment, then, is solely depends on the intensity of punishment itself. Ideally, those
who create a high social cost to society should be sentenced with higher intensity. This
imply that offenders who committed petty corruptions should be punished less severely
in comparison to those who committed more serious corruptions.
Under the Indonesia criminal court code, there are several types of punishments
including: a) fines, b) subsidiary punishment to fines (imprisonment); c) compensation
order, d) subsidiary punishment to compensation order (imprisonment), e) the seizure
of evidence, f) imprisonment, g) parole and h) other punishment. According to anti
corruption act 1999, the maximum value of fines is Rp1 billion. The compensation value
should be matched with the value of the social costs inflicted by the offenders.
Further assessment is conducted to explore factors which closely associated with
particular types of punishments (e.g. fines, compensation order, etc.). For this purpose,
by the Supreme Court. It might be interesting to conduct a similar exercise to the
decisions of judges in High Courts, however, some cases referred to the Supreme Court
may not necessarily be referred to the High Court, consequently the Supreme Court
covers a broader cases that the High Courts.
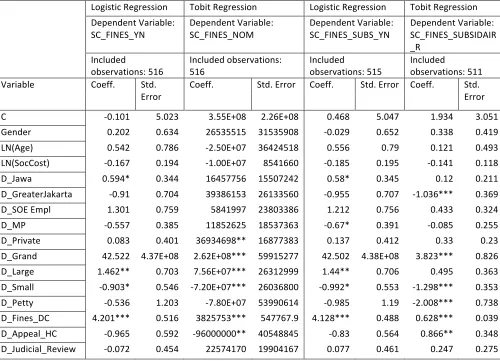
Fines and Subsidiary Punishment to Fines
The Logistic regression in Table 6 shows that defendants who previously worked as
MPs tend to receive fines higher than their counterparts who worked in private sector.
Similarly offenders who committed corruptions in Jawa were more likely to receive
fines than their counterparts in outside the island of Jawa. It should be noted however
that both results are significant at α=10%.
Table 6: The Probability and the Intensity of Fines
Logistic Regression Tobit Regression Logistic Regression Tobit Regression
Dependent Variable: SC_FINES_YN
Dependent Variable: SC_FINES_NOM
Dependent Variable: SC_FINES_SUBS_YN
Dependent Variable: SC_FINES_SUBSIDAIR _R
Included
observations: 516
Included observations: 516
Included
observations: 515
Included
observations: 511
Variable Coeff. Std.
Error
Coeff. Std. Error Coeff. Std. Error Coeff. Std. Error
C -‐0.101 5.023 3.55E+08 2.26E+08 0.468 5.047 1.934 3.051
Gender 0.202 0.634 26535515 31535908 -‐0.029 0.652 0.338 0.419
LN(Age) 0.542 0.786 -‐2.50E+07 36424518 0.556 0.79 0.121 0.493
LN(SocCost) -‐0.167 0.194 -‐1.00E+07 8541660 -‐0.185 0.195 -‐0.141 0.118
D_Jawa 0.594* 0.344 16457756 15507242 0.58* 0.345 0.12 0.211
D_GreaterJakarta -‐0.91 0.704 39386153 26133560 -‐0.955 0.707 -‐1.036*** 0.369
D_SOE Empl 1.301 0.759 5841997 23803386 1.212 0.756 0.433 0.324
D_MP -‐0.557 0.385 11852625 18537363 -‐0.67* 0.391 -‐0.085 0.255
D_Private 0.083 0.401 36934698** 16877383 0.137 0.412 0.33 0.23
D_Grand 42.522 4.37E+08 2.62E+08*** 59915277 42.502 4.38E+08 3.823*** 0.826
D_Large 1.462** 0.703 7.56E+07*** 26312999 1.44** 0.706 0.495 0.363
D_Small -‐0.903* 0.546 -‐7.20E+07*** 26036800 -‐0.992* 0.553 -‐1.298*** 0.353
D_Petty -‐0.536 1.203 -‐7.80E+07 53990614 -‐0.985 1.19 -‐2.008*** 0.738
D_Fines_DC 4.201*** 0.516 3825753*** 547767.9 4.128*** 0.488 0.628*** 0.039
D_Appeal_HC -‐0.965 0.592 -‐96000000** 40548845 -‐0.83 0.564 0.866** 0.348
D_Judicial_Review -‐0.072 0.454 22574170 19904167 0.077 0.461 0.247 0.275
Source: Indonesia Supreme Court, estimated
[image:21.595.71.571.324.685.2]Offenders who committed grand, medium and petty scales of corruptions have similar
likelihood to be sentenced with fines. Offenders who committed large scale corruptions,
however, were more likely to be sentenced with fines relative to those who committed
medium scale corruptions (α=5%). Surprisingly, offenders who committed small scale
corruptions tend to be less likely to receive fines, although the result was significant at
α=10%.
Result from Tobit regression shows that the intensity of fines did not depend on the
social costs inflicted by the offenders. It should be noted that the value of fines is
bounded above, namely that the maximum value of fines cannot exceed Rp 1 billion. In
term of occupations, offenders who previously worked as civil servants and state-‐
owned enterprise employees tend to be fined higher than their counterparts who
worked in private sector (α=1%).
Offenders who committed large and grand corruptions tend to receive higher fines than
medium scale corruptors (α=1%). On the other hand, small scale corruptors received
less fines than medium scale corruptors (α=1%). The result did not suggest, however,
that petty scale corruptors received lower value of fines than the medium scale
corruptors. This implies that the petty corruptors tend to be treated harsher than the
rest of the group. Although the social costs of corruptions that have been inflicted by
petty corruptors were much lower than those of medium corruptors, the intensity of
fines received by both groups was not significantly different.
In order to make fines more credible, many authorities have to adopt a strategy of
transforming the values of fines in relation to a term of imprisonment period, as a
result, a failure to pay the fines will be compensated by serving time in prison. In the
U.S., for instance, 25% of convicts sentenced by state courts in the year 2000 received
fines as additional penalties (U.S. DOJ, 2003). In Israel during 1997-‐2000, fines were
used in combination with other penalties in 34.7% of the cases (Einat, 2004). The use of
complementary sanctions shows that fines in themselves are not sufficient as a credible
sentence. Furthermore, the costs of policing and enforcing fines may not necessarily be
lower than other types of sentences, and the higher the fine, the higher the costs of