Myanmar,reconsidered
durongkaveroj, wannaphong
Chiang Mai University
25 September 2012
Online at
https://mpra.ub.uni-muenchen.de/52354/
M ya nm a r,
Re c onside re d
Dedication
To
my
grandmother
Myanmar, as you know, is military-based country. In recent years, there is some good news from Myanmar – one of the poorest countries in Southeast Asia. The situation of politics is better than ten years ago because of the internal and external pressure. Releasing of political prisoners and also Aung San Suu Kyi in 2010 until the election in April 2012 guarantees the improved political scenario. Parliament also passed the law to help encourage investment from foreign investor. The United State, E.U., and Australia started easing sanction. World Bank and E.U. have already opened their office while Dawei port is constructing assiduously. China – one of the greatest border trading partner – does not stop constructing the infrastructure in connecting Yunnan to other countries in Indochina region. Consequently, the world is now glaring at Myanmar. It is the fact that Myanmar has potential to become leader of Southeast Asia, economically, socially, and politically.
This paper, “Myanmar; reconsidered”, deliberately explains about Myanmar economy. However, it’s linked to politics and society as well. Contents of this paper have many dimensions including the country fact, economic health, trade, welfare, labor migration, and policy suggestion. Initially, when you consider Myanmar, you may think about life’s deprivation, conflict, and military – controlled; however, Myanmar has a long line and there is some background that you should know before judging. Also, some statistics indicate the outstanding growth rate in various fields, for instance, Gross Domestic Product, Human Development Index, Export Index Value. So, this paper will reconsider Myanmar in many dimensions. Nevertheless, in collecting data, it is difficult because there are many sources of information and those are different (for example, GDP from World Bank is not similar to Government Office even the same recent year). It is hard for me to select only one source of a ton of data for analyzing.
This paper could not have been written without Asst. Prof. Dr. Nisit Panthamit who not only suggested me to find an information but also challenged me throughout the international economics class. Also, I am very thankful to Prof. Kyaw Min Hton, pro-rector of Yangon Institute of Economics, who gave me information about Myanmar Economy. Additionally, I am equally thankful to Ni Lar,Ph.D who informed me about Dawei port in Myanmar. I would also like to thank my parents, who were the initial instigator and early on provided advice and encouragement.
I Country
Profile
1
II
Economic
Health
8
III Trade
23
IV Welfare
35
V
Labor Migration
42
VI Policy Suggestion
50
VII References
55
“Economics
and
Politics
are
inseparable.
A
bad
political
system
contributes
to
a
bad
economic
system”
Country Profile
General Feauture
Land Area : 657740 Sq km Land Boundary : 5876 km Coast Line : 2216 km Net Sown Area : 16.7% Reserved Forest Area : 24.04% Other Forest Area : 28.24%
Population : 59 million Working-age Group: 33.87 million
Buddhist: 89.3%
Border Countries : Bangladesh (193km), India (1463km), China (2185km), Laos (235km) and Thailand (1800km)
Special feature
1. Composed of more than one hundred different national races : Each has its own culture, traditions and values
2. Influence of religion & culture
Country Analysis
Strengths
1. Location
2. Large youthful population, providing a low-cost labor force attractive to foreign investment
3. Rich natural resources—land, water, gas, minerals
4. Abundant agricultural resources to be exploited for productivity improvement 5. Tourism potential
Constraints
1. Weak macroeconomic management and lack of experience with market mechanisms
2. Unstable financial institutions 3. Underdeveloped financial sector 4. Poor infrastructure, particularly in
transport, electricity access, and telecommunications
Opportunities
1. Strategic location
2. Potential of renewable energy
3. Potential for investment in a range of sectors
4. Sea port connecting the West and the the East.
5. Leader of Indochina region
Risks
1. Risks from economic reform and liberalization
2. Military rule
3. Pollution from economic activities 4. Ethnic conflicts
5. Exploitation of natural resource from foreign investor
Rich Natural Resources
Myanmar’s natural resources are among its most important assets. They are a source of wealth and in some cases, such as energy resources, provide key inputs for wealth creation in other parts of the economy. Natural resources will continue to be a source of growth if they can be properly and sustainably managed. The country is particularly rich in natural gas, water, forests, and fisheries. Other resources include petroleum oil and several minerals, including tin, antimony, zinc, copper, tungsten, lead, coal, marble, limestone, and precious stones.
For Gas and Oil, Myanmar has a large supply of natural gas. Proven reserves total 7.8 trillion cubic feet (BP 2012) and gas-fired plants account for 21% of total installed power generation capacity. With hydropower providing the main source of electricity generation, gas is exported and is now the country’s most important source of export revenue. Moreover, Myanmar is among Southeast Asia's five major energy exporters. A large portion of gas exports flow to Thailand and the PRC will become an increasingly important consumer when a new (planned) gas pipeline comes on stream. The country also has proven oil reserves of 2.1 billion barrels, more than Thailand and Brunei Darussalam although less than half of the reserves in Malaysia (5.9 billion), Indonesia (5.8 billion), and Viet Nam (4.4 billion)
Advantage of Location
Source: Thant Myint U, Where China Meets India: Burma and the New Crossroads of Asia., 2011.
Draw a circle around the central city of Mandalay with a radius of just over 700 miles (1,100km), and it stretches to the states of West Bengal and Bihar in India, to Yunnan and Sichuan provinces in China, as well as to Tibet, and south to cover most of Laos and Thailand. The circle is home to some 600m people – it is a big market and a great opportunity to reform the country so as to exploit this advantage of location.
When Dawei Deep Seaport is developed, it will reduce marine route and benefit to avoid Malacca Strait, risky cross-point for shipping.
Bridge connecting between East, South and Southeast Asia
Source: Kyaw Min Hton, “Economic Reconstruction and Development in Myanmar”,
Yangon Institute of Economics,2012
The figure shows the connection of East, South, and Southeast Asia through Myanmar. It indicates the absolute advantage of location to become leader of Indochina region. Moreover, Myanmar can be a center of trade bridging Japan, China, Korea with European Unions and the Middle East.
Country’s Timeline
Figure 2 : Shwedagon Pagoda
March 1962: Burma comes under military rule by Ne Win after a bloodless coup. March 1988: Mass anti-government demonstrations take place throughout Burma.
1989: Burma changes its name in English to Myanmar and the name of the capital from Rangoon to Yangon. Suu Kyi is placed under house arrest for charges of trying to divide the military, charges she denies.
1990: Suu Kyi's National League for Democracy party wins more than 80 percent of the legislative seats in the polls, the first free elections in the country in
nearly 30 years. The junta refuses to recognize the results.
October 14, 1991: Suu Kyi wins the Nobel Peace Prize.
April 23, 1992: General Than Shwe replaces Saw Maung as head of the junta. July 23, 1997: Myanmar joins ASEAN (Association of Southeast Asian Nations). March 2006: Naypyidaw becomes the new administrative capital.
August-September 2007: Huge fuel price increases spark protests, later dubbed the "saffron revolution" after the robes of monks who also joined in. The protests gained steam over weeks. On September 24, Buddhist monks led about 100,000 in the largest anti-government demonstrations since 1988. Two days later, government forces cracked down.
October 20, 2007: U.N. General Assembly approves a resolution condemning the government crackdown and asking for the release of political protesters. May 2, 2008: Cyclone Nargis hits Myanmar, killing more than 22,000. The government later reports 41,000 missing and up to 1 million homeless.
May 14, 2009: Suu Kyi is arrested and charged with government subversion, relating to an incident in which American John Yettaw swam uninvited to her
lakeside home.
August 10, 2009: Myanmar court convicts Suu Kyi, then 64, for breaching the terms of her house arrest over Yettaw's visit. She is sentenced to 18 more months in home confinement, as were two of her house companions. Yettaw is sentenced to seven years of hard labor, but U.S. Senator Jim Webb obtains his release soon afterwards.
March 10, 2010: Junta announces new election law that disqualifies Suu Kyi from taking part in upcoming national elections, citing her conviction in court. She has spent more than 14 years of the last 20 years under house arrest.
April 26, 2010: Myanmar's Prime Minister Thein Sein and several other ministers resign from their military posts in order to participate in upcoming elections.
May 7, 2010: The NLD refuses to register for the election, thereby disqualifying itself as a political party and officially dissolves. On the same day, supporters of Suu Kyi say they will form a new political party, National Democratic Force, which comprises some members of NLD.
Figure 3: 1990 Election
August 13, 2010: Myanmar will hold elections on November 7, in the military junta-led nation's first vote since 1990.
November 2010: Scheduled date of Suu Kyi's release from house arrest and detention after 14 years
2011 January: Government authorises internet connection for Aung San Suu Kyi. Junta retires to wings
2011 March:Thein Sein is sworn in as president of a new, nominally civilian government. 2011 August: President Thein Sein meets Aung San Suu Kyi in Nay Pyi Taw.
2011 September: President Thein Sein suspends construction of controversial Chinese-funded Myitsone hydroelectric dam, in move seen as showing greater openness to public opinion. 2011 October: Some political prisoners are freed as part of a general amnesty. New labor laws allowing unions are passed.
2011 November Pro-democracy leader Aung San Suu Kyi says she will stand for election to parliament, as her party rejoins the political
process.
2011 December: U.S. Secretary of State Hillary Clinton visits, meets Aung San Suu Kyi and holds talks with President Thein Sein. US offered to improve relations if democratic reforms continue. President Thein Sein signs law allowing peaceful demonstrations for the first time; NLD re-registers as a political party in advance of by-elections for parliament due to be held early in 2012. Burmese authorities agree truce deal with
rebels of Shan ethnic group and orders military to stop operations against ethnic Kachin rebels.
2012 January: Government signs ceasefire with rebels of Karen ethnic group. Pre-publication censorship was scrapped in 2012, but state control of media remains strong A day later, hundreds of prisoners are released - among them the country's most prominent political prisoners, including veterans of the 1988 student protest movement, monks involved in the 2007 demonstrations and activists from many ethnic minority groups.
2012 May: Manmohan Singh pays first official visit by an Indian prime minister since 1987. He signs 12 agreements to strengthen trade and diplomatic ties, specifically providing for border area development and an Indian credit line
2012 April - Taking part in an election for the first time since 1990, the NLD wins 43 out of 45 seats in landmark parliamentary by-elections seen as a major test for Burma's reform drive. The polls are thought to have been generally free and fair. The U.S. responds by easing sanctions on Burma. The European Union suspends all non-military sanctions against Burma for a year. E.U.
Figure 5 Aung San Suu Kyi welcomed US engagement with Burma, Dec 2 2011
foreign policy chief Catherine Ashton, British Prime Minister David Cameron and U.N. Secretary-General Ban Ki-moon visited for talking on moving the democracy process forwards. At the late April, Suu kyi , first time in 24 years, went outside countries, went to Thailand for World Economic Forum and she also visited Burmese Labor at Sumut Sakhorn.
2012 June: Suu Kyi went to International Labor Organization (ILO) at Switzerland and she begged for investment in Myanmar. She went to Oslo in Norway to receive the Nobel Prize that she got it since 1991 but she is arrest in her house. She also went to Oxford University to receive the honorary doctorate.
2012 August: President Thein Sein sets up commission to investigate violence between Rakhine Buddhists and Rohingya Muslims in the west of the country. Dozens have died and thousands of people have been displaced.
Burma abolishes pre-publication censorship, meaning that reporters no longer have to submit their copy to state censors. In a major cabinet reshuffle President Thein Sein replaces
hardline Information Minister Kyaw Hsan with moderate Aung Kyi, the military's negotiator with opposition leader Aung San Suu Kyi.
2012 September: Moe Thee Zun, the leader of student protests in 1988, returns from exile after Burma removed 2,082 people from its blacklist. And, Myanmar parliament passed the investment law. The legislation drops a number of apparently restrictive provisions floated by lawmakers. One proposal had required a minimum investment of $5 million, which some analysts said would restrict joint-venture investors to dealing only with the country's largest and, possibly, most politically connected firms, including potentially some with ties to Myanmar's former harsh military regime. It also allows foreigners to own 50% of joint ventures in restricted businesses. That was above the 49% limit in previous drafts, but fell short of hopes among some investors that higher percentages would be allowed.
Aung San Suu Kyi, the light of
Myanmar
Economic Health
Myanmar economy does a good job in term of economic growth rate. If we compare the “value” of gross domestic product by dollar term, it is of course lower than other countries in region, for instance, Thailand or Indonesia. However, elaborately consider about growth rate, it is outstanding which means that the gap among economic indicators converges on and on and, in the near future, it is feasible for Myanmar economy to outpace other countries in regions in the condition that it keeps the rate of growth constant. Since growth in Gross Domestic Product (GDP) is a popular measure of economic growth, in this paper, growth in GDP is also referred to economic growth.
Three features dominate the economy of Burma today: a traditional rice-based agriculture sector that is grossly underperforming, a pipeline supplying natural gas to Thailand from off- shore fields, and a strong underground economy based on illegal exports of timber and other natural resources, plus narcotics (mostly methamphetamines). The economy is balkanized by the decades-long conflict between the central government (ethnically Burman and Buddhist) and a number of ethnic minorities (often Christian) inhabiting the country’s mountainous borders with China, India, and Thailand. Furthermore, the military regime maintains control over most economic activity through a host of monopolistic state-owned enterprises and businesses owned by family members and cronies of the regime’s senior generals. As a result, the space for spontaneous private initiative is severely restricted.
Figure1 Gross Domestic Product (GDP) growth rate from 1961 to 2004
Source: This study (data from World Bank)
Figure2 Economic Growth during 1961 - 2004
Source: This study (data from World Bank)
From figure2, it shows the time series data about growth rate in Gross Domestic Product from 1961 to 2004, needless to say, it is fluctuated. A sharp increase in growth was followed by a dramatic decrease economic growth. The worst economic health is in 1988 which the economic growth receded to -11.3524. The reason is that in 1988, there is an event so called “8888 Uprising” as it happened in August 8, 1988. It is series of marches, demonstrations, protests, and riots in the Socialist Republic of the Union of Burma (today, Myanmar) against military rule, headed by General Ne Win. After that, Myanmar economy experienced a fluctuation of GDP on and on; however, since 2000, the economic scenario is improved because of more serene in politics.
Table1 Gross National Income per capita at PPP (constant 2005 international dollar)
Source: This study (data from UNDP)
From table1, it is the times series data collected by World Bank in the year 1980, 1985, 1990, 1995,2000, 2005, 2006,2007,2008,2009,2010,2011. The observation is twelve. Table shows the comparison in GNI between Myanmar and other economic category. On average, Myanmar’s GNI is lower than all of income category. Myanmar maximum is less than the minimum GNI in very high income category (Norway, USA, Sweden) and high income category (Cuba, Mexico). The situation is not good compared to other countries in the same region.
-10
-5
0
5
10
15
GDP
1960 1970 1980 1990 2000
Year
l ow 12 1271. 083 226. 5185 988 1585
medi um 12 3219. 75 1479. 916 1087 5276
hi gh 12 9572. 417 1598. 215 7531 11579
v er y hi gh 12 29168. 17 5009. 753 19609 33352
Figure3Gross National Income per capita at PPP (constant 2005 international dollar)
Source: This study (data from UNDP)
From the figure3, the red line represents Myanmar’s GNI. You will see that it lies below the all other income category, even the low income group. So, on average, in the real value of dollar – not growth rate, economic health is still deprived and it needs more concentration from government to reform economy.
Table2 AEC’s Export as percentage of GDP during 1960 - 2011
Source: This study (data from World Bank)
From table2, it indicates export value of GDP among ten countries of Asian Economic Community (AEC). From mean, Singapore’s export is outstanding by the advantage of its location. It is followed by Brunei – oil product, and Malaysia. When we consider maximum value, of course, Singapore again has a greatest indicator on export as percent of GDP. It is followed by Malaysia and Brunei. For Myanmar, export as percentage of GDP is lowest in AEC. However, percentage method tells us merely the importance of export on its economy, it does not tell about the real value or volume of export. It is indicates that Myanmar economy does not depend on export.
0
10000
20000
30000
40000
1980 1990 2000 2010 year
Myanmar very high high medium low
Figure4 AEC’s Export as percentage of GDP during 1960 - 2011
Source: This study (data from World Bank)
From the figure4, it shows comparison in time series data about export as percentage of GDP among AEC. Singapore’s export represented by the dash blue line lies above other countries in AEC while the green line representing Myanmar’s share of export in GDP lies in the bottom. The gap between the dash blue line and solid green line shows the difference in importance of export in two economies.
Table3 AEC’s Import as percentage of GDP during 1960 - 2011
Source: This study (data from World Bank)
From table3, the highest import as percentage of GDP is still Singapore though the Malacca Strait. Myanmar, however, are still the lowest of import as percentage of GDP.
0
50
100
150
200
250
1960 1970 1980 1990 2000 2010
year
Myanmar Thailand
Vietnam Laos
Malaysia Singapore
Cambodia Brunei
Indonesia Philippine
Figure5 AEC’s Import as percentage of GDP during 1960 - 2011
Source: This study (data from World Bank)
From the figure5, it shows comparison in time series data about import as percentage of GDP among AEC. Singapore’s export represented by the solid red line lies above other countries in AEC while the thin purple line representing Myanmar’s share of import in GDP lies in the bottom. The gap between the solid red line and thin purple line shows the difference in importance of export in two economies.
As you can see from the figure4 and figuer5, Myanmar joined a little fraction of GDP in trade or international market. Why? In the past, Myanmar is socialist country ruled by military. International trade is not Myanmar’s priority. Its tariff and other protection from multinational company are relatively high. So, it is not surprising that participation in global market is relatively small compared to other countries in region, for instance, Singapore or Malaysia.
When we consider import and export as percentage of GDP, now we will further explore the Balance of trade as percentage of GDP
0
50
100
150
200
1960 1970 1980 1990 2000 2010
Year
Myanmar Thailand
Vietnam Laos
Malaysia Singapore
Cambodia Brunei
Table4 Balance of trade as percentage of GDP during 1960 - 2011
Source: This study (data from World Bank)
Table4 shows comparison in the balance of trade as percentage of GDP among AEC countries. On the average, the countries which have the positive balance of trade are Singapore, Brunei, Indonesia, and Malaysia. The rest’s balance of trade is negative. When we consider maximum value, Brunei has the highest balance of trade, it indicates that flow of money and gold now are accumulated in the reserve of Brunei’s central bank. For Myanmar, over the time, balance of trade is negative. It indicates that value of import is greater than value of export in terms of percentage of Myanmar’s GDP. The interest thing is zero value of maximum balance of trade in Vietnam, Laos, and Cambodia. It is not the case that overall export equals to import. But the real maximum for Vietnam balance of trade is -2.28, for Laos is -2.366, for Cambodia is -2.23.
Figure6 Balance of trade as percentage of GDP during 1960 - 2011
Source: This study (data from World Bank)
bphi l i 52 - 3. 05521 3. 554789 - 10. 33735 4. 877942 bi ndo 52 2. 578709 4. 156469 - 7. 518597 13. 96863 bbr unei 52 24. 54223 29. 85799 - 6. 932153 81. 69724 bc ambo 52 - 4. 389039 5. 34747 - 18. 43355 0 bs g 52 5. 982491 14. 17539 - 20. 38088 30. 70096 bmal ay 52 7. 27944 8. 985502 - 8. 637713 25. 05187 bl aos 52 - 5. 866813 6. 48978 - 19. 86548 0 bv i et 52 - 3. 995583 4. 724827 - 15. 85203 0 bt h 52 - . 4314287 5. 53282 - 7. 518507 15. 88792 bmy an 52 - 1. 744957 2. 11951 - 8. 72444 1. 500097 Var i abl e Obs Mean St d. Dev . Mi n Max
-20
0
20
40
60
80
1960 1970 1980 1990 2000 2010
Year
B.Myan B.Th
From figure6, most of the balance of trade as percentage of GDP in AEC is fluctuated. However, solid blue line, Singapore’s balance of trade does a good job because its trend is positive over the 52 years. For Thailand, it is receded from 1960 – 1995, since 2000, its trend is positive. For Brunei, during 1970 - 1985, its balance of trade improved – may be from the OPEC increase in the price of crude oil. Brunei is not a member of OPEC. So, when the crude oil from OPEC is high, many countries bought from Brunei. This may an export, in perspective of Brunei, increase. So, the balance of trade is improved. Theoretically, when nation experiences a positive balance of trade, in general, national welfare should be improved and we can expect that Brunei’s reserve is still fluent.
Further information about economic health
Figure7 value in Export, Import, and Net during 1976 – 2010
Source: This study (data from IMF)
Figure8 Myanmar’s Export as GDP, Import as GDP, and Economic Growth during 1961 - 2004
Source: This study (data from World Bank)
From the figure8, in side of export and import, the result is similar to IMF data. In the past, import is greater than export – the dash blue line representing import lie above the dash green line representing export. So, the net export and import or balance of trade will be stagnant in negative terms. However, when I added economic growth in consideration so as to find that in Myanmar economy, what is the key influence to economic growth followed the basic idea of GDP equation as written;
Y = C + I + E + G
Where, Y = GDP
C = Consumer Spending
I = Investment made by industry E = Excess of Exports over Imports G = Government Spending
Table5 Outcome of Regression Model: GDP growth rate and Import as Percentage of GDP during 1961 – 2004
Dependent Variable: GDPGROWTH Method: Least Squares
Date: 09/12/12 Time: 16:02 Sample: 1961 2004
Included observations: 44
Variable Coefficient Std. Error t-Statistic Prob.
C 6.799049 1.367824 4.970706 0.0000 IMPORT -0.246087 0.141276 -1.741884 0.0888
R-squared 0.067375 Mean dependent var 4.914928 Adjusted R-squared 0.045169 S.D. dependent var 5.683419 S.E. of regression 5.553578 Akaike info criterion 6.311151 Sum squared resid 1295.374 Schwarz criterion 6.392250 Log likelihood -136.8453 F-statistic 3.034159 Durbin-Watson stat 1.525130 Prob(F-statistic) 0.088849
Source: This study
From the table5, we get the linear regression model as Y= a+bX by OLS method. The linear equation is GDPGROWTH = c + bIMPORT (C stands for vector of coefficient) and the model is as written;
GDPGROWTH = 6.7990 – 0.2461IMPORT
Table6 Outcome of Regression Model: GDP Growth Rate and Export as Percentage of GDP during 1961 – 2004
Dependent Variable: GDPGROWTH Method: Least Squares
Date: 09/10/12 Time: 19:08 Sample: 1961 2004
Included observations: 44
Variable Coefficient Std. Error t-Statistic Prob.
C 6.459825 1.229718 5.253093 0.0000 EXPORT -0.275052 0.160224 -1.716671 0.0934
R-squared 0.065565 Mean dependent var 4.914928 Adjusted R-squared 0.043317 S.D. dependent var 5.683419 S.E. of regression 5.558962 Akaike info criterion 6.313089 Sum squared resid 1297.887 Schwarz criterion 6.394189 Log likelihood -136.8880 F-statistic 2.946960 Durbin-Watson stat 1.469772 Prob(F-statistic) 0.093407
Source: This study
From the table6, we get the linear regression model as Y= a+bX by OLS method. The linear equation is GDPGROWTH = c + bEXPORT (C stands for vector of coefficient) and the model is as written;
GDPGROWTH = 6.4598 – 0.2751EXPORT
Table7 Outcome of Regression Model: GDP Growth Rate and Balance of trade as percentage of GDP during 1961 – 2004
Dependent Variable: GDP Method: Least Squares Date: 09/10/12 Time: 18:51 Sample: 1961 2004
Included observations: 44
Variable Coefficient Std. Error t-Statistic Prob.
C 5.408061 1.189817 4.545287 0.0000 BALANCETRADE 0.241782 0.401477 0.602232 0.5503
R-squared 0.008561 Mean dependent var 4.914928 Adjusted R-squared -0.015044 S.D. dependent var 5.683419 S.E. of regression 5.726011 Akaike info criterion 6.372304 Sum squared resid 1377.062 Schwarz criterion 6.453404 Log likelihood -138.1907 F-statistic 0.362684 Durbin-Watson stat 1.467080 Prob(F-statistic) 0.550257
Source: This study
From the table7, we get the linear regression model as Y= a+bX by OLS method. The linear equation is GDPGROWTH = c + bBALANCETRADE (C stands for vector of coefficient) and the model is as written;
Change in Economic Structure
Figure 10 Sector Share in Myanmar’s GDP during 1965 – 2010
Source: Asian Development Bank. 2006. Asian Development Outlook. Manila: ADB.
From the figure10, it shows that agricultural sector has played a vital role in Myanmar economy since 1965. However, since 2000, industry sector’s share increased while agricultural share decreased.
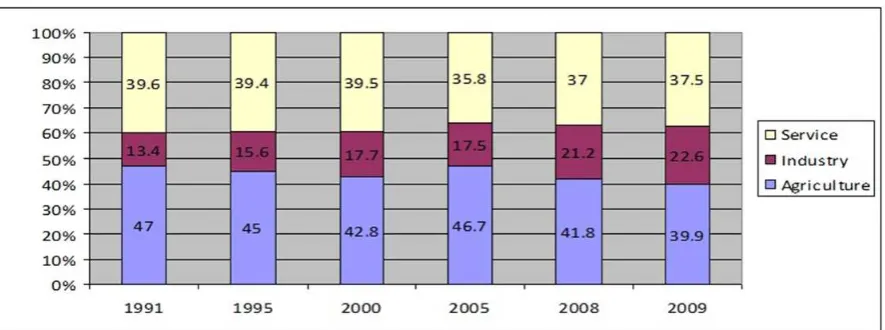
Figure11 Myanmar’s Economic Structure
Source: Kyaw Min Hton, “Economic Reconstruction and Development in Myanmar”, Yangon Institute of Economic, 2012
[image:25.595.79.522.453.618.2]In 1991, Myanmar economy depends mostly on agriculture by 47%. It is followed by service sector and industry sector by 39.4%, 15.6% respectively. In 1995, it still depends mostly on agriculture but the share of agriculture in GDP gradually declined to 45%. The share of services declined to 39.4% while the industry sector’s share rose slightly to 15.6%. In 2000, Agriculture sector’s share continued to decline to 42.8% while industry sector kept increasing to 17.7%. This trend of agriculture sector and industry sector continued until 2009. The agriculture sector fell to 39.9% while share in GDP in industry sector has been increasing to 22.6%. The service sector shared 37.5% in GDP. In the next future, share in GDP in industry sector will be increase sharply while agricultural share will decline as a result of openness of country. New technology and science will come to country. Mass production or economy of scale will occur in factory. The process of product cycle will go to Myanmar with increasing international trade. In my own opinion, the situation of Myanmar in the next 10 year will be similar to Thailand. Multinational companies, for example, Toyota, Honda, Sony will open the plant at Myanmar to absorb the low-paid labor. Trade with China will dramatically grow after the road to Yunnan – southern China is more available. After Dawei port opens in the near future, Myanmar economic structure may change again by a sharp increasing in share of industry sector in Myanmar’s Gross Domestic Product. In trading, according to Hecksher – Ohlin model, Myanmar is definitely endowed with natural resource and unskilled labor. So, Myanmar should specialize in and export the product the intensively use the abundant factor, for example, petroleum product, children’s outer wear, nonrubber footwear, wool, leather tanning and finishing, textile bag, gray iron foundries, special dyes, tools, jigs, and fixtures, elevators and moving stairways, rolling mill machinery, ship building and repairing,Schiffli machine embroideries, electronic computers, and leather gloves and mittens.
Figure12 The Composition of Industry in the Economy in ASEAN in 2009
Source: Kyaw Min Hton, “Economic Reconstruction and Development in Myanmar”,
Yangon Institute of Economics,2012
Indonesia and Thailand. For Myanmar, it ranked the 9th. However, in the near future, from the trend in figure10, industrial sector will have a larger share in national GDP.
According the trade theory, the effects of trade by H – O model can be divided by two parts, Short run and Long run. Again, Myanmar is abundant in natural resources and unskilled labor.so, it should specialize in and export the commodities made from natural resources and unskilled labor. In this case, supposed that Myanmar specialize in and export textile bag. For the effects on distribution of income, firstly, short run, by specific - factor model (labor is free to move between industries but capital is specific to industry), when Myanmar starts export textile bag to Thailand. Myanmar producers face a higher cost of production when they produce more textile bag. As a result, they have to increase the price of textile bag. According to the VMP equation; VMP = MP*P, when the price rise, VMP rise proportionally with the price. This scenario will spur the wage for labor to rise. However, when wage in textile bag is higher than wage in other industry, supposed to be pin maker, the worker from pin maker factory will move to textile bag factory until the wage between two industries is equal. Wage in textile bag factory decline slightly. So, rise in price of textile bag is more proportionally than wage. About real wage in considering of distribution of income, if labors spend all income on textile bag, their of course purchasing power or real income will decrease because a rise in their wage is less than an increase in commodities. However, if labors spend all income in pin, their purchasing power will rise because the price in pin is declined (because pin has comparative disadvantage – we import pin and produce a fewer unit, pin producer face a lower cost; so, they can sell at lower price). About capital market, the return in capital owner used in textile bag will rise because the price of bag increases as the VMP equation. However, when the labor from pin maker factory move to textile bag factory, capital in bag factory has more labor to work with; so, it raises the marginal product and contributes to VMP to increase more. So, the return to capital owner increases more proportionally than the price of textile bag. Welfare of owner of capital increases regardless of their consumption pattern. For the owner of capital in pin factory, when the labors leave from factory, its marginal product fell; so, VMP declined and lead to a decrease in return to owner of capital in pin factory. This effect combines with a reduction in price of pin after opening trade. So, the real return to owner of capital in pin factory will decline more proportionally than the price of pin. Of course, regardless of consumption pattern, owners of capital factory in pin factory will worse off due to a loss in their purchasing power. In conclusion, for Myanmar economy, owner of capital in natural resources-based industries and unskilled labor intensive factories will experience an increasing in their purchasing power. In the other hand, owner of capital in any production that producer intensively uses the input that is not abundant in Myanmar may experience a lower in their purchasing power and well-being. For the labor in Myanmar, it depends on consumption pattern.
overall will experience the higher wage rate while owner of factor intensively used in pin factory will face a lower real return.
Consequently, either short run or long run, the destination of foreign investor is not unskilled labor industry but natural resources industry, especially natural gas and oil. So, to be more sustainable, Myanmar government should carefully issue the investment law by two objects including to attract foreign investor and to protect Myanmar’s abundant natural resources, simultaneously.
[image:28.595.98.519.246.525.2]Government Revenue and Tax
Figure 13 Government Revenue by Tax as Percentage of GDP in 2010
Source: Asian Development Bank, “ADB Key Indicators for Asia and the Pacific Toward Higher Quality Employment in Asia”. Manila: ADB, 2011
Trade
In the 20th century, we cannot deny trade. Our world becomes international economic interdependence. In the past, some socialist countries are closed – people consume what they produce. However, after decades of attempting to isolate themselves from world markets, many development countries have now opened their borders and pursued policies designed to integrate themselves into international economic activity. Countries have recognized the importance of open international of goods, services, and investment and recued their restrictions on international transactions. Also, international market is not limited to goods and services but also bonds, stocks, bank loans, foreign exchange that provide mechanism for international investment, which play a vital role in the world economy. In general, the economic interdependence among nations has been increasing over the years. We live in globalized world and we cannot deny the influx of international trade. For Myanmar, in this paper, data is collected from many sources as followed;
Table1 Value of Myanmar’s Export, Import, and Balance of Trade (Kyat Million)
Year Export Import Balance of Trade
1990-1991 2961.9 5522.8 (-) 2560.9
1995-1996 5043.8 10301.6 (-) 5257.8
2000-2001 12736 15073.1 (-)2337.1
2002-2003 19955.1 14910 (+)5045.1
2003-2004 14119.2 13397.5 (+)721.7
2004-2005 16697.3 11338.6 (+)5358.7
2005-2006 20646.6 11514.2 (+)9132.4
2006-2007 30026.1 16835 (+)13191.1
2007-2008 35296.8 18418.9 (+)16877.9
2008-2009 37027.8 24873.8 (+)12154.0
Source: This study (data from http://www.myanmararchives.com/)
Figure1 Times Series of Myanmar’s Export, Import, and Balance of trade
Source: This study (data from http://www.myanmararchives.com/)
The figure illustrates that, at initial, import value of import is greater than the value of export. So, it causes trade deficit. After that, import falls short of export. So, balance of trade becomes positive and there is, of course, trade surplus. When there is trade surplus, overall, it means we buy foreign commodity less than we gain from foreign consumer.
Table2 AEC’s Export Value Index 1980 – 2010
Source: This study (data from World Bank)
This table shows the time-series analysis about value of export in Asian Economic Community. When we consider “mean” of export value index, surprisingly, Laos does a good job more than Singapore or Malaysia. However, Laos’s standard deviation is relatively high, it indicates the improvement of Lao economy from 1980 to 2010. However, when we consider about maximum export value index, Myanmar’s value is highest. Its performance is outstanding more than other countries in AEC.
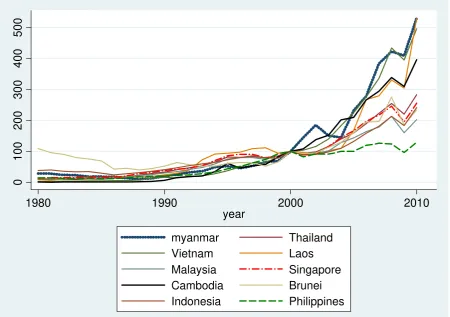
Figure2 Times Series of AEC’s Export Value Index 1980 – 2010
Source: This study (data from World Bank)
[image:31.595.74.525.113.430.2]From the figure2, between 1980 to 1990, Indonesia’s economy is outstanding. Up to 2000, Laos does a good job in export. Since 2000, Myanmar is rising star. Its export value outpaces other economies in the same region. When the export value increase, balance of trade tend to rise and the potential welfare should increase.
Table 3 AEC’s Import value index 1980-2010
Source: This study (data from World Bank)
This table shows the statistics about import value index in AEC since 1980. Overall, it seems that Brunei has the highest mean of import value. The highest standard deviation is
0
100
200
300
400
500
1980 1990 2000 2010
year
myanmar Thailand
Vietnam Laos
Malaysia Singapore
Cambodia Brunei
Indonesia Philippines
Vietnam and maximum value index belongs to Vietnam. For the Myanmar’s economy, import value index is not too high or too low. It is similar to Malaysia.
Figure3Time Series of AEC’s Import value index 1980 -2010
Source: This study (data from World Bank)
From the figure3, from 1980 – 2000,Brunei is leading of importing in the region(it explain the reason why means is highest). And Cambodia’s import value index is lowest in AEC. In the lately 2010, Myanmar imported lower than Vietnam, Cambodia (dramatically rise since 2000), Laos, Thailand, Singapore but better than Philippines and Malaysia.
Table4 AEC’s Terms of Trade 1980 - 2010
Source: This study (data from World Bank)
0
200
400
600
1980 1990 2000 2010
Year
myanmar Thailand
Vietnam Laos
Malaysia Singapore
Cambodia Brunei
Indonesia Philippines
The table4 shows the comparison of terms of trade (TOT) among AEC countries. In this case, 2000 is the base year that the TOT index is equal to 100 in all countries. TOT can calculate by price of export over price of import. On the average, Myanmar’s TOT is highest – it is referred that Myanmar export price might be high or its import price might be low. When we deliberately consider the maximum value of terms of trade, Myanmar reached the highest and it is followed by Brunei, Indonesia, and Thailand, respectively.
Figure3 Time series ofAEC’s Terms of Trade 1980 - 2010
Source: This study (data from World Bank)
From the figure3, it indicates that Myanmar since 1980 has experienced the sharp fall in terms of trade – we can refer to either lower export price commodity or higher import price commodity. If the TOT falls, followed the theory of offer curve, domestic producer is willing to export fewer units. And the welfare in nations may be downgraded. However, it is not the case of vice versa because there is an exception of offer curve. If the shape of offer curve is backward-bending, the higher TOT leads to a fewer units domestic producer desires to export. Furthermore, if you consider Malaysia – the dash green line, it shows an increase in TOT since 1980, we can refer to either an increase in export price commodity or a decrease in import price commodity.
Trading Partner
There are two fields of trading partner including export trading partners and imports trading partner. Trading partner is important because it indicates the influx of goods and services and it is important for policy marker to consider elaborately about trading intimacy.
0
200
400
600
800
1980 1990 2000 2010
Year
Myanmar Thailand
Vietnam Laos
Malaysia Singapore
Cambodia Brunei
Table 5 Myanmar’s Major Export Partner
1980 1988 1990
Singapore 14.3% Africa 19.7% Africa 14.3%
Africa 10.6% Singapore 9.7% Thailand 11.0%
Japan 9.9% Hong Kong 9.1% Singapore 11.3%
Indonesia 9.5% Japan 8.4% India 10.8%
Hong Kong 7.6% Indonesia 7.0% China 8.1%
1995 2000 2006
Singapore 16.0% USA 22.4% Thailand 49.0%
India 12.2% Thailand 11.8% India 12.1%
China 11.3% Africa 8.6% Africa 5.8%
Hong Kong 9.3% India 8.2% China 5.3%
Indonesia 8.0% China 5.7% Japan 5.1%
Source: IMF (Direction of Trade)
From the table5, it shows the change in Myanmar’s major export trading partner. However, the major country that always imports goods from Myanmar is Africa. Since 1990, Thailand became one of the export partners of Myanmar especially, the border market. Moreover, China’s trade with Myanmar increases – I found from many literatures that the major of trade between Myanmar and China has done through Yunnan Province in Southern China – one of the provinces of China that plan it to be the gate to Southeast Asia. And now, China is constructing the road and infrastructure to enhance the trade with Southeast East Asia.
and its potential will enhance the strength of Chinese economy. Now, E.U. is the largest trading partners of China and China, in my own opinion, now, is finding the new market for their domestic commodity.
The figure shows road construction in Yunnan province, southern China. When it is completely done, the influx of commodities will sharply rise.
Table6 Myanmar’s Major Import Partners
1980 1988 1990
Japan 43.70% Japan 39.00% China 20.60%
UK 8.80% UK 9.10% Singapore 18%
Germany 7.40% Germany 6.70% Japan 16.60%
Singapore 6.10% USA 6.00% Germany 4.80%
USA 5.00% Singapore 5.80% Malaysia 4.70%
1995 2000 2006
Singapore 30% Thailand 18.80% China 49%
China 29.00% China 18.00% Thailand 12.10%
Malaysia 10.80% Singapore 15.80% Singapore 5.80%
Japan 7.40% South Korea 10.50% Malaysia 5.30%
South Korea 4.10% Malaysia 8.40% South Korea 5.10%
Source: IMF (Direction of Trade)
future, with the economic growth in Myanmar, the west may become the trading partner with Myanmar again after easing sanction.
For the border trade, it is growing. If political is stable, of course, it will contribute to Myanmar economic indicator and lead to economic prosperity
Table7 Myanmar’s Border Trade by Country
(US$ Millions)
Source: Toshihiro Kudo, “Myanmar’s Border Trade With China: Situation, Challenge, and Prospect”, 2010
From the table7, the border trade with China accounted for 70 percent of Myanmar’s total border trade. It was followed by Thailand with 20 percent as show in the table6. The share of border trade with Bangladesh and India comprised a few percent. Indeed, China is the greatest importance of Myanmar’s border trade.
Table8 China’s Border Trade with Myanmar
(US$ Millions)
Source: Toshihiro Kudo, “Myanmar’s Border Trade With China: Situation, Challenge, and Prospect”, 2010
country, especially in the west, have an attention in Burmese economy but China,
economically and politically, has started considering the advantage of Myanmar and trading under border trade contract since 1994, more than 15 years ago.
When we consider Myanmar’s Terms of Trade, Import, Export, the result seems peculiar from the theory as followed;
Figure4 Myanmar’s Terms of Trade, Import, Export from 1981 – 2010
Source: This study (data from World Bank)
The figure4 shows the time series data in Myanmar’s TOT, export, and import. Theoretically, in offer curve, export and terms of trade should be delineated in the same direction but this show the inverse relationship. The conclusion is not clear but there may be some efforts or impulse that causes the terms of trade and export value seems peculiar. Backward-bending offer curve, a trading policy in tariff and quota, sanction from other countries, all of these may combine together and result in the framework which is not familiar in the international economics theory.
Table9: Outcome of regression model : Export and TOT during 1981 - 2010
Dependent Variable: EXPORT Method: Least Squares
Date: 09/10/12 Time: 16:56 Sample: 1981 2010
Included observations: 30 Variable Coefficien
t
Std. Error t-Statistic Prob.
C 138.5773 20.90180 6.629923 0.0000 TOT -0.245903 0.073196 -3.359531 0.0023 R-squared 0.287286 Mean dependent var 82.73436
Adjusted R-squared 0.261832 S.D. dependent var 80.78614 S.E. of regression 69.40880 Akaike info criterion 11.38224 Sum squared resid 134892.3 Schwarz criterion 11.47566 Log likelihood -168.7337 F-statistic 11.28645 Durbin-Watson stat 0.178198 Prob(F-statistic) 0.002267 Source: This study
From the table9, we get the linear regression model as Y= a+bX by OLS method. The linear equation is Export = c + bTOT (C stands for vector of coefficient) and the model is as written;
Export = 138.5773 – 0.2459TOT
Table10 Outcome of regression model : Import and TOT during 1981 - 2010
Dependent Variable: IMPORT Method: Least Squares
Date: 09/10/12 Time: 16:57 Sample: 1981 2010
Included observations: 30 Variable Coefficien
t
Std. Error t-Statistic Prob.
C 80.97693 9.332169 8.677182 0.0000 TOT -0.041614 0.032680 -1.273361 0.2134 R-squared 0.054739 Mean dependent var 71.52674
Adjusted R-squared 0.020980 S.D. dependent var 31.31970 S.E. of regression 30.98942 Akaike info criterion 9.769509 Sum squared resid 26889.64 Schwarz criterion 9.862923 Log likelihood -144.5426 F-statistic 1.621448 Durbin-Watson stat 0.319228 Prob(F-statistic) 0.213360 Source: This study
From the table10, we get the linear regression model as Y= a+bX by OLS method. The linear equation is Import = c + bTOT (C stands for vector of coefficient) and the model is as written;
Export = 80.9769 – 0.0416TOT
It means that if TOT is zero, export value index will equal to 80.9769. If TOT rises by one unit, Import value index will decline by 0.04. However, when we consider probability value to check the relationship between dependent variable and independent variable, I found that Prob. Of TOT is 0.2134. It indicates the significant relationship ≈ (1-0.2134)*100 ≈ 78.66%. When the Prob. value is small, it means that coefficient of dependent variable is significantly different from zero or we can reject null Hypothesis that b = 0. When we consider R-squared or coefficient of determination, its value is 0.0547. It is very low. It tells us that the result of Y (Import Equation) is influenced by TOT around 5.47% and other factors about 94.53%. So, the accuracy of prediction (estimated equation of representation of all population) about this outcome is very weak even though this equation is significant.
Table11 Outcome of regression model : TOT and Economic growth during 1981-2010
Dependent Variable: GDPGROWTH Method: Least Squares
Date: 09/10/12 Time: 17:03 Sample: 1981 2004
Included observations: 24 Variable Coefficien
t
Std. Error t-Statistic Prob.
C 8.007428 2.039249 3.926655 0.0007 TOT -0.008966 0.006491 -1.381279 0.1811 R-squared 0.079803 Mean dependent var 5.717251
Adjusted R-squared 0.037976 S.D. dependent var 5.929945 S.E. of regression 5.816257 Akaike info criterion 6.438846 Sum squared resid 744.2346 Schwarz criterion 6.537017 Log likelihood -75.26615 F-statistic 1.907932 Durbin-Watson stat 0.689565 Prob(F-statistic) 0.181063
Source: This study
From the table11, we get the linear regression model as Y= a+bX by OLS method. The linear equation is GDPGROWTH = c + bTOT (C stands for vector of coefficient) and the model is as written;
GDPGROWTH = 8.007428 – 0.0089TOT
It means that if TOT is zero, export value index will equal to 8.01. If TOT rises by one unit, GDP growth rate will decline by 0.0089. However, when we consider probability value to check the relationship between dependent variable and independent variable, I found that Prob. Of TOT is 0.1811. It indicates the significant relationship ≈ (1-0.1811)*100 ≈ 81.89%. When the Prob. value is small, it means that coefficient of dependent variable is significantly different from zero or we can reject null Hypothesis that b = 0. When we consider R-squared or coefficient of determination, its value is 0.0798. It is very low. It tells us that the result of Y (GDPGROWTH Equation) is influenced by TOT around 7.98% and other factors about 92.02%. So, the accuracy of prediction (estimated equation of representation of all population) about this outcome is very weak even though this equation is significant.
Welfare in Myanmar
Gross Domestic Product – popular economic indicator – cannot tell us a deliberate situation in country but superficial situation. In other word, it tells us potential well-being of people not an actual well-being of people. We cannot conclude that overall citizens experience higher living standard when GDP rises – it should be so but only GDP is inefficient to achieve an effective statement about welfare improvement in country. The problem of “Growth without Development” in Brazil, oil sheikdoms, Bangladesh and so on emphasizes us that the country with high GDP cannot guarantee amelioration in living standard. According to Human Development Report 2011 by UNDP, there is an indicator measured three dimensions of human development including life expectancy, literacy and years of schooling, and standard of living by per capita GNI at PPP. To ensure as much cross-country comparability as possible, the HDI is based primarily on international data from the UN Population Division, the UNESCO Institute for Statistics (UIS) and the World Bank. However, the data in old Human Development Report (1990 - 2010) uses an old methodology. So, it may mislead us if we use the unarranged data with old methodology from HDR directly. So, with the new formula, UNDP calculated HDI in the past including 1980, 1985, 1990, 1995, 2000, 2005, 2010 and 2011 that available in UNDP website and HDR as well. In Myanmar, HDI value for 2011 is 0.483 – in low human development category – positioning the country 149 out of 187 countries. HDI value ranks between zero and one. The closer to one country experiences, the more development citizen faces. Between 1980 and 2011, Myanmar’s HDI value increased from 0.279 to 0.483, an increase of 73.0 per cent or average annual increase of about 1.8 per cent as followed;
Table1: Myanmar’s HDI Trends Based on Consistent Time Series Data
Component Indicators of HDI
Year Life
Expectancy
Means years of schooling
GNI per capita
(2005 PPP$) HDI Value
1980 55.1 1.7 364 0.279
1985 55.5 2.2 409 0.307
1990 57.3 2.4 340 0.298
1995 60.1 2.7 420 0.34
2000 61.9 3.1 576 0.38
2005 62.9 3.5 1,018 0.436
2010 64.7 4 1,484 0.479
2011 65.2 4 1,535 0.483
Source: UNDP
Figure1: Trends in Myanmar’s Life Expectancy
Source: This study (data from UNDP)
[image:42.595.109.500.518.724.2]Figure shows about a sharp increase in life expectancy in Burmese citizens from 1980 to 2011. Initially, health deprivation is severe and, by the time, it is improved because of government provision and other international organization in Myanmar, for example, UN and World Bank office. Moreover, the modern medicine and new science and technology can expand lifespan. However, life expectancy in developing country is lower than developed country. It indicates the better situation in sanitation and disease. There are more modern medicine and effective doctors so as to help expand citizen’s life.
Figure 2: Government Expenditure Share on Health during 1995 – 2009 (% of GDP)
Source: Asian Development Bank, “Myanmar in Transition”, 2012 Life Expectancy
55
60
65
Li
feExpectancy
1980 1990 2000 2010
From the figure2, it shows that Myanmar has relatively small share of government expenditure on health compared to selected countries including Viet Nam, Cambodia, Laos. Needless to say, health and sanitation in Myanmar is low because to be in a good condition of health needs an effective government project. In developed countries, the largest share of government expenditure is on health, for instance, the United States, England, and Norway. So, government should more concentrate on health dimension because it can contribute to human capital. When citizens are deprived, they cannot work well and got the low salary. There is no light of development. If Myanmar citizen’s health is good and there are many program subsidized in medicine cost, it is anticipated that the productivity will improve. People can work more hours and gain more income.
Figure3: Trends in Myanmar’s means years of Schooling
Source: This study (data from UNDP)
Figure3 shows means years of schooling in Myanmar – one of the most problems in development. As we know, education gives positive or spillover benefit to society rather than merely student. Society as a whole is improved. It is easier for government to control because people are educated and abided the law or regulations. Human capital is important because it not only increase individual productivity and the real reward (wage) but also encourage country overall to progress in the era of capitalism. So, we can anticipate from this figure that Burmese society is improved because people are more educated in the thirty years as we concerned. I have a chance to ask Professor Shigeru Otsubo about the policy to help eliminate poverty in long term, he informed me that education policy is the most important for policy makers to be concerned but to design a good education system is very difficult.
Means Years of Schooling
1.5
2
2.5
3
3.5
4
SchoolYear
1980 1990 2000 2010
Figure4: Trends in Myanmar’s per capita GNI (PPP)
Source: This study (data from UNDP)
Figure4 shows the per capita GNI in Burma. We can expect that the individual living standard might increase as a result of sharp improvement in income. However, it may mislead us because per capita income comes from the method of mean – we divide the national income by the number of population. It masks inequality in society. For example, suppose that a country composes of two people. Each gets $50 per year. So, per capita income is $50. While other country has two citizens as well but one gets $100 and another gets nothing. So, the latter’s per capita income is $50. So, we should to be more careful when consider only GDP and per capita income. We have to concern about S.D. and Gini Coefficient that reflect the income inequality in country distribution. PPP that using in estimating GNI stands for purchasing power parity, the criterion for an appropriate exchange rate between currencies among countries. Actual exchange rates in market will vary from the PPP levels for various reasons, such as the demand for imports or investments between countries. It asks how much money would be needed to purchase the same goods and services in two countries, and uses that to calculate an implicit foreign exchange rate. Using that PPP rate, an amount of money has the same purchasing power in different countries. Among other uses, PPP rates facilitate international comparisons of income, as market exchange rates are often volatile, are affected by political and financial factors that do not lead to immediate changes in income and tend to systematically understate the standard of living in poor countries because the majority of commodities in poor countries are not traded with other countries, for example, wild product – it is not through exchange rate system while PPP involves every commodities in countries which means than it reflects the true rate in transforming the data in one country into international dollar. So, it is more correct to use PPP instead of exchange rate in calculating GNI or GDP across the countries.
GNI per capita (2005 PPP$)
0
500
1000
1500
GNI
1980 1990 2000 2010
Figure5: Trends in Myanmar’s HDI
Source: This study (data from UNDP)
This figure5 shows the Burmese Human Development Index integrating longevity, knowledge, and income. From 1980 to 2011, it shows a good sign of economic development. Even though HDI declined in 1985 to 1990 but, after that, it dramatically rises. Now, Burma is in the range of low human development category with the 1.8 per cent annual increase. So, in the future, if Burmese government concentrates on the policy encouraging the standard of living of Burmese citizens, it will contribute to HDI and the real increase in people’s well-being can take place. It is possible that HDI can go up to medium development category if there is an intensity of economic development not solely economic growth.
Table2: Myanmar’s HDI and Other Category of Development Index
Year
HDI VALUE in each category Very
High High Medium Low Myanmar
1980 0.766 0.614 0.42 0.316 0.279 1985 0.786 0.63 0.45 0.334 0.307 1990 0.810 0.648 0.48 0.347 0.298 1995 0.834 0.662 0.517 0.363 0.340 2000 0.858 0.687 0.548 0.383 0.380 2005 0.876 0.716 0.587 0.422 0.436 2006 0.879 0.721 0.595 0.430 0.448 2007 0.882 0.728 0.605 0.437 0.459 2008 0.885 0.733 0.612 0.443 0.468 2009 0.885 0.734 0.618 0.448 0.474 2010 0.888 0.739 0.625 0.453 0.479 2011 0.889 0.741 0.630 0.456 0.483
Source: UNDP
.3
.35
.4
.45
.5
HDI
Figure6: Comparison of each Human Development Category
Source: This study ( data from UNDP)
This table2 and figure6 show the comparison in Myanmar’s HDI and other development category including very higher development, high development, medium development and low development. It is of course easy to anticipate that very high development countries will have high literacy rate, high life expectancy and high GNI at PPP. But the important thing in this figure is that Burma is ranked in low development category but since 2005, Myanmar’s HDI outpace the average value of HDI in low development category. It is nearer than the past for Myanmar to become medium development country. To achieve the next category, Burma needs effective reform in health system, education system, and economic system simultaneously. An improvement in infrastructure helps strengthen economy and increase the possibility to trade with the other region like China (Yunnan) and especially, Thailand (border trade). If telecommunication does a good job, it helps reduce business cost; so, it attracts foreign investors to locate their plants, factory, or offices.
Burma needs to strengthen the regional integration programs in ASEAN Vision 2020, The Hanoi Plan of Action, Hanoi Declaration on Narrowing Development Gap for Closer ASEAN Integration, and Initiative for ASEAN Integration. And also it needs focus the private property among the ethnic groups in Burma (135 different ethnic groups). Life without property is similar to a house with no roof. To rent the land with uncertain agricultural product is the important issue that Burmese government must concern elaborately. When the income is uncertain, it is difficult to invest in anything not only child education but also housing. With the new era of Burma, economics is, as you know, impossible to distribute evenly. It is duty of government to take care of country and citizen to improve their well-being until they have ability to function their life (Sen’s).
Labor Migration
Labor migration is one of the most important issues when we consider about Myanmar. We get used to see the news about labor migration in the border, especially in the Northern Thailand and Southern Thailand. In the paper of “Labor migration in the greater Mekong sub-region”, it said that the numbers of labor migration vary greatly, with conservative estimates in 2005 ranging from 1.8 to 4 million among intra-regional cross border migrants in the GMS. It is generally accepted that the largest migration flow to Thailand. In Thailand, the country with the major influx of migrants from neighboring countries, there are claims that 90 percent of the estimated two to three million migrants from Myanmar, Cambodia and Laos are irregular (not recorded and eludes statistical coverage) and about half are without any legal and valid travel documents.
the applicants were between 15 and 25 years old, with another seven percent under the age of 15. Of those aged less than 15, 20 percent were 12–14 years old and the remaining 80 percent under the age of 12. This young migrant work force caters to the growing demand for unskilled labor to support industrialization, substituting for local labor. In Thailand, as in other newly industrialized countries, relatively high incomes in the expanding manufacturing, commercial and service sectors render jobs that are paying, lower-status and that involve harder physical work less attractive to an increasingly more educated and smaller Thai population with broader work opportunities at its disposal. At the same time, harsh competition in the regional and global market inspires labor- intensive industries to economize by suppressing wages for lower-level jobs for which there is abundant labor supply, thus making those jobs even less interesting to the Thai population. However, the wage is relatively high compared to those in the countries where the cross-border migrants originate. intra-regional migrants come to fill the shortage of cheap labor in Thailand as well as other more industrialized countries in the sub-region, their lower skill levels and more modest financial expectations being a match to the so-called “3Ds” jobs—Dirty, Dangerous and Difficult that are on offer.
Figure 1 Irregular labor came to Thailand by ship
Burmese workers in Thailand
Table1 2010 Quantities of Burmese Labor in Thailand
It’s divided into two categories, legal and illegal, respectively.
Burmese workers Legal Workers Illegal Workers
amount 128,824 815,472
total 944,296
Source: Office of foreign workers administration (Thailand)
From the table, it indicates that, in Thailand, the majority of Burmese workers who contribute to our economy are illegal. And of course, their welfare features will be less than registered labors who immigrate legally.
Table2 Number of Illegal Worker in Thailand from 2006 to 20101 in Thailand
Year Amount
2006 568,878
2007 498,091
2008 476,676
2009 1,078,767
2010 812,984 Source: Office of foreign workers administration (Thailand)
From the table, it indicates that the number of Burmese illegal labor sharply increased from 2006 to 2010. The more industrial and manufactured sector in Thailand expand, the more demand for cheap-paid labor increases so as to reduce the cost and be more competitive.
This mass internal migration (in GMS) is spurred by industrialization and infrastructural growth, increasingly consists of people moving from rural and often remote areas to cities and other industrial and tourism destinations. Thai government indicated that in 2004 Thai employers requested work permits for nearly 1.6 million undocumented migrant employees, though only 1.2 million registered and only 815,000 were actually issued work permits. Of those registered, 610,000 were from Burma, 105,000 from Cambodia and 100,000 from Laos. The main industries employing migrant labor in Thailand are domestic work, construction, commercial agriculture, fishing, and service industries.
1
Table3 The Distribution of Registered Labor in Thailand in 2004
Sector Employer Burmese Laos Cambodia Total
Agriculture 44,811 143,793 16,795 18,816 179,404
Domestic work 88,059 88,319 31,449 8,746 128,514
Construction 10,387 81,554 8,442 24,463 114,459
Fisheries 6,518 33,178 2,634 22,874 58,686
Fish processing 2,548 62,923 1,013 4,666 68,602
Others 43,228 183,155 37,711 22,508 243,374
Rice mill 778 6,471 266 186 6,923
Mining 846 5,963 433 373 7,615
Ice making 572 3,642 485 387 4,514
Transportation 57 1,108 124 1,770 3,002
Total 197,804 610,106 99,352 104,789 815,093
Source: Therese Caouette, Rosalia Sciortino, Philip Guest, Alan Feinstein, “labour migration in the grater Mekong sub-region”
From the table, it indicates that most Burmese workers are employed agriculture sector. And it’s followed by domestic work, construction, fish processing, and fisheries, respectively. While workers from Laos are mostly employed in domestic work sector and people from Cambodia are mostly employed in construction sector.
Table4 Illegal Burmese Workers by the Sectors in Thailand in 2010
Burmese Workers (Illegal) Categories
Total Male Female 812,984 443,601 369,383 Unskilled Labor 741,213 430,336 310,877
Agriculture and Livestock 149,333 91,329 58,004
Construction 129,353 82,061 47,292
Fishery 120,812 62,926 57,886
services 68,671 41,518 27,153
Cloth Product salesperson 61,211 23,410 37,801 Agricultural related job (factory) 53,633 33,876 19,757
Clerk 39,863 20,425 19,438
retail shop 32,900 19,640 13,260
Plastic product salesperson 17,376 10,679 6,697
Construction tools salesperson 12,991 8,746 4,245