An Experimental Study of Microbial Fuel Cells for
Electricity Generating: Performance Characterization and
Capacity Improvement
Jessica Li
Kent Place School, Summit, New Jersey, USA. Email: [email protected]
Received June 30, 2013; revised July 28, 2013; accepted August 5, 2013
Copyright © 2013 Jessica Li. This is an open access article distributed under the Creative Commons Attribution License, which per- mits unrestricted use, distribution, and reproduction in any medium, provided the original work is properly cited.
ABSTRACT
This paper studies the electricity generating capacity of microbial fuel cells (MFCs). Unlike most of MFC research, which targets the long term goals of renewable energy production and wastewater treatment, this paper considers a niche application that may be used immediately in practice, namely powering sensors from soils or sediments. There are two major goals in this study. The first goal is to examine the performance characteristics of MFCs in this application. Specifically we investigate the relationship between the percentage of organic matter in a sample and the electrical ca- pacity of MFCs fueled by that sample. We observe that higher percentage of organic matter in a sample results in higher electricity production of MFCs powered by that sample. We measure the thermal limits that dictate the temperature range in which MFCs can function, and confirm that the upper thermal limit is 40˚C. The new observation is that the lower thermal limit is −5˚C, which is lower than 0˚C reported in the literature. This difference is important for powering environmental sensors. We observe that the electricity production of MFCs decreases almost linearly over a period of 10 days. The second goal is to determine the conditions under which MFCs work most efficiently to generate electricity. We compare the capacity under a variety of conditions of sample types (benthic mud, top soil, and marsh samples), temperatures (0˚C, 40˚C, and room temperature), and sample sizes (measuring 3.5 cm × 3.5 cm × 4.6 cm, 10.2 cm × 10.2 cm × 13.4 cm, and 2.7 cm × 2.7 cm × 3.8 cm), and find that the electricity capacity is greatest at 0˚C, powered by benthic mud sample with the largest chamber size. What seems surprising is that 0˚C outperforms both room tempera- ture and benthic mud sample outperforms marsh sample, which appears to be richer in organic matter. In addition, we notice that although the largest chamber size produces the greatest capacity, it suffers from efficiency loss. The reasons of these observations will be explained in the paper. The study demonstrates that the electricity production of MFCs can be increased by selecting the right condition of sample type, temperature, and chamber size.
Keywords: Microbial Fuel Cells; Sustainable Energy Source; Renewable Electricity Production Capacity; Power Source of Environmental Sensors
1. Introduction
Our society is constantly in search of sustainable, re- newable, and alternative energy sources. Often when people think about these energy sources, they think of solar cells or wind mills. Microbial fuel cells (MFCs) may also be part of the picture. A microbial fuel cell (MFC) is a bio-electrochemical system that harnesses the natural metabolisms of microbes to produce electrical power. Within the MFC, microbes consume the nutrients in their surrounding environment and release a portion of the energy contained in the food in the form of elec- tricity.
The idea of using MFCs for producing electricity dates back to 1911 [1]. Research on this subject and the crea- tions of MFCs occurred sporadically throughout the rest of the 20th century. Recently the need of renewable and clean forms of energy and the need of wastewater treat- ment have triggered wide research interest in developing the MFC technology to address both of these human needs. For example, Scientific American had a popular article introducing the MFC technology [2]. In the aca- demic community, the authors in [3] proposed domestic wastewater treatment using multi-electrode continuous flow MFCs.
treatment are two long term goals of developing the MFC technology, real-world applications of MFCs are yet lim- ited because of their low power density level of several thousand mW/m2 [4]. Efforts are being made to improve the performance and reduce the construction and operat- ing costs of MFCs. Meanwhile, finding niche applica- tions in which the technology can be used immediately in practice will certainly help technology advances and eventually achieve these long term goals [5]. In the paper, we will investigate the electricity generating capacity of MFCs in one such niche application, namely powering sensors, such as environmental sensors, from soils or sediments [6,7].
Microbes are ubiquitous throughout virtually all soils, sediments, and streams on the planet. This makes MFCs very attractive for this sensor application that only re- quires low power but where replacing batteries may be time consuming and expensive. Specifically, sensors can be used to collect data on the natural environment for understanding and modeling ecosystem responses. How- ever, the sensors require power for the operations of measurement and communications. MFCs can possibly be used to power sensors particularly in the river and deep- water environments where it is difficult to replace batteries. Powered by MFCs, the sensors can be left alone in re- mote areas for many years without maintenance.
To facilitate the use of MFCs in this niche application, in the paper, we will examine the performance character- istics of MFCs, in particular the performance with sam- ple types commonly found in those environments, the
thermal limits that dictate the temperature range in which MFCs can function, and the electricity production varia- tion over time. On the basis of the performance charac- teristics, we will then determine the conditions under which MFCs work most efficiently to generate electricity. We hope that the result of this study can be used to create more efficient MFCs on a large scale as a new sustain- able energy source.
2. MFC Experiment System
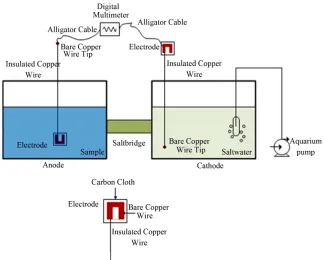
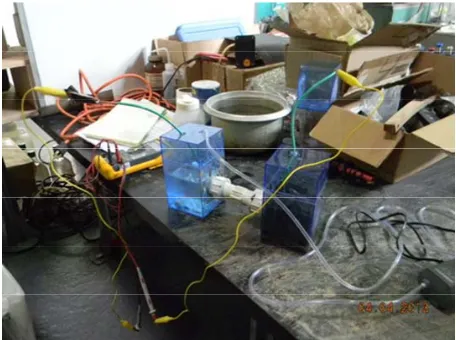
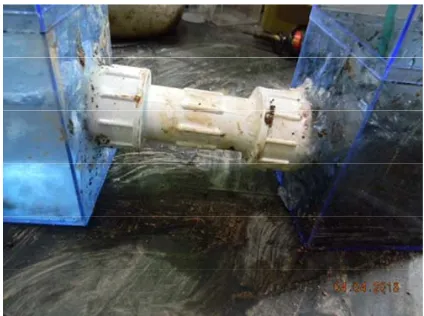
Figure 1 shows the diagram of the MFC experimental system used in this study, which was built from the scratch using generic off-the-shelf components. Figure 2 is a picture of the actual MFC system. We next explain the system setup.
The MFC is made of the following four parts:
Anode chamber, which holds the bacteria and organic matter in an anaerobic environment;
Cathode chamber, which holds a conductive saltwater solution;
Proton-exchange membrane, also known as salt bridge, which separates the anode and cathode and allows protons to move between the two chambers; External circuit, which allows electrons to enter the
[image:2.595.135.459.457.717.2]cathode and functions as a path for electrons to travel through when pulled out of the solution in the anode. Bacteria in the anode chamber create protons and elec- trons during oxidation as part of their digestive process. The electrons are pulled out of the solution in the anode
Figure 2. Picture of MFC system setup.
and placed onto an electrode. The electrons are then conducted through the external circuit and into the cath- ode chamber by way of the cathode’s electrode. The electrode is made of bare copper wire glued with nickel epoxy on carbon cloth. The protons from the solution in the anode travel through the proton-exchange membrane to meet with the electrons at the cathode.
3. Study Items of MFC Experiment
The MFC is powered primarily by the bacteria in the anode chamber. Thus, it is expected that the electricity production is affected by a number of factors that influ- ence the metabolic process of bacteria and are particu- larly relevant in the sensor application of interest:
The type of bacteria in the anode and the organic matter that the bacteria digest;
The temperature at which the metabolic process takes place;
The amount of bacteria used and the size of anode chamber.
We next elaborate on how these factors are investi- gated in the experiment.
For the sensor application, we chose to study three different types of samples, namely, benthic mud sample, top soil sample, and marsh sample, which exist in the environments where sensors are commonly placed to monitor environment ecosystems. The benthic mud sam- ple collected was first filtered so that it would only con- tained rich mud and a minimum amount of rocks or twigs. However, even after filtration, the benthic mud sample still contained some small rocks. The top soil and marsh samples were also filtered in the same way. Unlike the benthic mud sample, neither of these samples contained a visible amount of small rocks after filtration. The benthic mud, top soil, and marsh samples most likely held dif- ferent amounts of bacteria. Since the benthic mud sample contained the most percentage of small rocks, it was ex-
pected that this sample contained the lowest percentage of organic matter. The marsh sample seemed to contain the richest, thickest mud, and was expected to have the highest percentage of organic matter such as bits of de- caying leaves. However, this initial belief was solely based upon qualitative data. It was possible that a higher percentage of organic matter existed in the benthic mud and top soil samples. It is believed that a sample with higher percentage of organic matter, which presumably contains more bacteria and bacterial food sources per a unit of sample, allows for the production of more elec- trons and thus electricity, a hypothesis we will examine in this experiment. In addition, the type of bacteria may play a role as well. For example, the types of bacteria found in the benthic mud and top soil samples may be more effective in producing electricity. Hence, before the completion of this experiment, it was unclear which bac- teria sample would produce the greatest amount of elec- tricity.
Bacteria grow and the metabolic process takes place with equal efficiency at all temperatures between the freezing point of water (0˚C) and the temperature at which protein or protoplasm coagulates (40˚C) [8]. The metabolic process of bacteria slows down and the growth of the organism ceases when bacteria are placed in an environment below the freezing temperature of water, but the bacteria present are not killed. However, when bacteria are in an environment above the temperature at which protein or protoplasm coagulates, most are killed. Based on our extensive literary search, no MFC effi- ciency test has been performed at a temperature below 0˚C or above 40˚C. For the sensor application of interest, it is important to test beyond these upper and lower thermal limits so that we can understand how MFCs would performance under extreme temperature condi- tions. Indeed, as will be discovered in this experiment, at −5˚C, surprisingly the MFC is able to produce a decent amount of electricity, thereby potentially being able to power sensors below the freezing point of water.
A large scale MFC system will not only need to oper- ate with a large amount of sample but also operate for a long period of time. In this experiment, we chose to ob- serve the electricity production over a period of 10 days. Over this period, bacteria reproduced and died out. It was expected that initially when there was enough food the bacterial colony would grow, and that after some period of time, as the food source depleted, and the remaining bacteria would die out leaving little or no bacteria to produce electricity. Before the completion of this ex- periment, it was unclear whether the electricity produc- tion would change gradually (linearly) or drastically (exponentially) over time. Clearly, a good understanding of time variation of electricity production will be impor- tant to predict the performance of the sensor application in the real world.
In summary, the study items were to:
Find the ideal combination of temperature, sample type and sample size to achieve the greatest electricity production;
Determine the thermal limits that dictate the tem- perature range at which the MFC can function; Discover time variation of the electricity production; Determine the relationship between the percentage of
organic matter in a sample and the electricity produc- tion.
4. Summary of Experiment Results
Before the experiment, we hypothesized that the room temperature, marsh sample, and the largest size of sam- ple would generate the most electricity, that the thermal limits would be 0˚C and 40˚C, that the efficiency would be lost in size change, that a higher percentage of organic matter would lead to higher electricity production, and that the electricity production would initially increase and then drop drastically over a period of 10 days.
We conducted a few series of experiments to test these hypotheses respectively. In each series, three trials were conducted for consistency and accuracy. In summary, the experiment results show that:
The combination of 0˚C, the benthic mud sample, and the larger sample size generated the most electricity; The thermal limits were −5˚C and 40˚C; that is, the
lower limit was −5˚C, which is lower than commonly believed 0˚C;
A higher percentage of organic matter in a sample led to higher electricity production of a MFC powered by that sample;
Electricity production decreased gradually (linearly) over a period of 10 days.
In the first series of experiments, the independent variable being studied was the type of sample—benthic mud sample versus top soil sample versus marsh sample. We created MFCs placed in room temperature (23˚C)
and measuring 3.5 cm × 3.5 cm × 4.6 cm for each type of sample. Thus, 36 cm3 of each type of sample was used in one trial. Three trials for each type of sample were con- ducted at once for accuracy. In each trial and for each sample, we measured the electricity production with a digital multi-meter less than one minute after the con- struction of the MFC.
Table 1 provides the measured data from the first se- ries of experiments, and shows that the MFC powered by the top soil sample has the lowest electricity production and the MFC powered by the benthic mud sample has the highest electricity production. The results contradict the initial hypothesis.
[image:4.595.307.539.367.439.2]In addition, we completed a test to measure the per- centage of organic matter in each sample. The results are provided in Table 2. Figure 3 combines Tables 1 and 2, and plots electricity production versus percentage of organic matter. The benthic mud sample had the highest percentage of organic matter and electricity production, followed by the marsh sample and then the top soil sam-ple. We conclude that higher percentage of organic
Table 1. Electricity production versus sample type.
Type of Sample First Trial (mV) Second Trial (mV) Third Trial (mV)
Benthic Mud 162 168 170
Top Soil 108 110 99
[image:4.595.308.538.467.709.2]Marsh 143 135 134
Table 2. Percentage of organic matter versus sample type.
Type of Sample
Percentage of Organic Matter,
First Trial
Percentage of Organic Matter, Second Trial
Percentage of Organic Matter,
Third Trial
Benthic
Mud 21% 19% 20%
Top Soil 8% 8.5% 8.2%
[image:4.595.307.538.469.707.2]Marsh 13.2% 13% 13.3%
matter corresponds to higher electricity production. How- ever, the initial guess that the marsh sample had the highest percentage of organic matter was false.
In the second series of experiments, the independent variable was the temperature—0˚C versus 40˚C. The dependent variable was the electricity production of the MFC. For comparison, we also used the room tempera- ture (23˚C). We created MFCs using top soil and meas- ureing 3.5 cm × 3.5 cm × 4.6 cm for each temperature. Three trials were completed at each temperature at once for accuracy. In each trial and for each sample, we meas- ured the electricity production with a digital multi-meter less than one minute after the construction of the MFC.
Table 3 provides the measured data from the second series of experiments, and shows that electricity produc- tion was greatest at 0˚C and lowest at 40˚C, which con- tradicts the hypothesis that the greatest electricity pro- duction would occur at the room temperature.
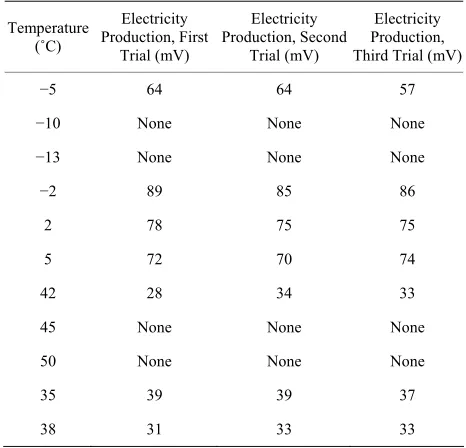
Furthermore, we tested temperatures slightly above and below 0˚C and 40˚C. We ran three trials for each temperature tested for accuracy. Table 4 provides the measured data, and shows that a MFC cannot function at temperatures at or below −10˚C or temperatures at or above 45˚C. On the low temperature end, electricity pro- duction increases from −5˚C to −2˚C and to 0˚C, and then decreases from 0˚C to 2˚C and then to 5˚C. Inter- estingly, 0˚C is a peak. On the high temperature end, electricity production monotonically decreases from 35˚C to 38˚C, 40˚C and finally 42˚C. Because we did not control the temperature in the enclosed environment, we were unable to test the performance at a temperature very close to −10˚C or 45˚C. Thus, for the purpose of this study, we considered −10˚C and 45˚C the thermal limits.
[image:5.595.306.539.363.587.2]In the third series of experiments, the independent variable was the size of the anode chamber of the MFC and thus the amount of sample that fills the chamber— 10.2 cm × 10.2 cm × 13.4 cm versus 2.7 cm × 2.7 cm × 3.8 cm. The MFC of medium size measuring 3.5 cm × 3.5 cm × 4.6 cm was used for comparison. We built the MFCs with top soil placed at the room temperature for each anode chamber size. Three trials were completed at the same time for each sample size for accuracy. In each trial and for each sample, we measured the electricity
Table 3. Electricity production versus temperature (normal range).
Temperature (˚C)
Electricity Production, First
Trial (mV)
Electricity Production, Second
Trial (mV)
Electricity Production, Third Trial (mV)
0 130 125 127
40 86 79 86
23 106 110 110
production with a digital multi-meter less than one min- ute after the construction of the MFC.
Table 5 provides the measured data from the third se- ries of experiments, and shows that electricity production increases with sample size, which is expected. More in- terestingly we observe that the efficiency of electricity production decreases with sample size. The volume of the largest MFC is 24.8 times the volume of the medium MFC, but the electricity production of the largest MFC is approximately 1.3 times the electricity production of the medium MFC. Similarly, the volume of the medium MFC is 2.2 times the volume of the smallest MFC, but the electricity production of the medium MFC is only 1.2 times the electricity production of the smallest MFC. Therefore, we conclude that the amount of electricity production is not directly proportional to the sample size used to power the MFC. Although electricity production does increase with sample size, the efficiency is lost, therefore implying that simply increasing the MFC size may not be very effective because of diminishing returns.
Table 4. Electricity production versus temperature (ex- tended range).
Temperature (˚C)
Electricity Production, First
Trial (mV)
Electricity Production, Second
Trial (mV)
Electricity Production, Third Trial (mV)
−5 64 64 57
−10 None None None
−13 None None None
−2 89 85 86
2 78 75 75
5 72 70 74
42 28 34 33
45 None None None
50 None None None
35 39 39 37
[image:5.595.310.538.615.737.2]38 31 33 33
Table 5. Electricity production versus sample size.
Anode Chamber Size (Sample Size)
Electricity Production,
First Trial (mV)
Electricity Production, Second Trial
(mV)
Electricity Production, Third Trial
(mV)
3.5 cm × 3.5
cm × 4.6 cm 102 108 107
10.2 cm × 10.2
cm × 13.4 cm 139 138 143
2.7 cm × 2.7
[image:5.595.58.289.639.735.2]In the fourth series of experiments, the independent variable was time elapsed since the construction of the MFC. The dependent variable was the electricity produc- tion. We used a MFC that had just been constructed less than one minute prior to testing to compare the electricity productions of the MFC at different time periods after construction. We constructed a MFC using top soil, placed at the room temperature, with an anode chamber measuring 3.5 cm × 3.5 cm × 4.6 cm. Three identical MFCs were used and tested over the same period of time for accuracy.
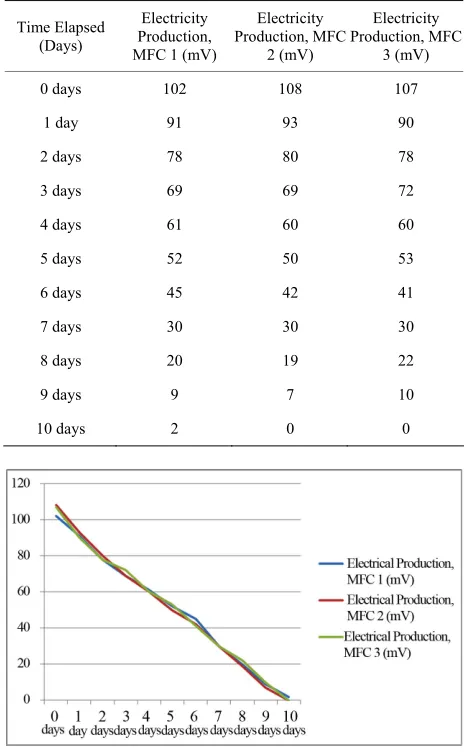
Table 6 provides the measured data from the third se- ries of experiments, which are plotted in Figure 4. Fig- ure 4 shows that the electricity production of a MFC gradually decreases over a period of 10 days.
[image:6.595.55.288.344.721.2]It should be pointed out that the above observation may only hold true for the MFCs powered by top soil, measuring 3.5 cm × 3.5 cm × 4.6 cm, and at the room temperature. To see whether it was applicable to other
Table 6. Electricity production versus time elapsed.
Time Elapsed (Days)
Electricity Production, MFC 1 (mV)
Electricity Production, MFC
2 (mV)
Electricity Production, MFC
3 (mV)
0 days 102 108 107
1 day 91 93 90
2 days 78 80 78
3 days 69 69 72
4 days 61 60 60
5 days 52 50 53
6 days 45 42 41
7 days 30 30 30
8 days 20 19 22
9 days 9 7 10
[image:6.595.55.290.350.719.2]10 days 2 0 0
Figure 4. Electricity production versus time elapsed.
MFCs, we completed the same test for all combinations of temperature, sample size, and sample type. To save the space, we next include a description of the data in- stead of graphs or tables.
Immediately after the construction of the MFCs, the MFC powered by benthic mud sample, measuring 10.2 cm × 10.2 cm × 13.4 cm, at 0˚C had the highest electric- ity production of 183 mV. The MFC powered by top soil, measuring 2.7 cm × 2.7 cm × 3.8 cm, at 40˚C had the lowest electricity production of 64 mV. The electricity productions of all other MFCs fell evenly within this range. Throughout the first three days, the electricity productions of all MFCs decreased steadily and gradually by 1 or 2 mV each hour. After the first three days, the electricity productions of all the MFCs were very similar within a range of 5 mV of each other. From the 4th to the 8th day, this range remained the same as the electricity productions of all MFCs continued to decrease gradually by approximately 10 mV each day. On the 9th day, the electricity productions of all MFCs were at or close to 0 within a range of 3 mV of each other. The result shows that although the MFC powered by benthic mud sample, measuring 10.2 cm × 10.2 cm × 13.4 cm, at 0˚C had the highest electricity production initially, the decrease in the electricity production of this MFC was the greatest of all MFCs because on the 4th day, its electricity production was only 5 mV higher than the MFC powered by top soil, measuring 2.7cm × 2.7cm × 3.8cm, at 40˚C. The differ- ence between the electricity productions of these two MFCs had initially been 119 mV. Hence, the conclusion is that the time variation of electricity production re- markably depends on temperature, sample size, and sam- ple type of the MFC. Moreover, the rate of decrease of some MFCs drops as time elapses, indicating that the decrease is closer to exponential than to linear.
5. Conclusions, Reflections and Areas of
Future Research
By extracting bioenergy from environments, the MFC technology exhibits a promising potential of powering sensors in remote locations where it is difficult to replace batteries. This experimental study investigates the per- formance of MFCs and provides ways of increasing the efficiency for such an application.
greater electricity production. In this study, the benthic mud sample has the highest percentage of organic matter and leads to the greatest electricity production. An MFC can function at a temperature ranging from −5˚C to 42˚C, an operational range wider than what was previously conjectured. However, because we were unable to test temperatures below −5˚C or above 42˚C, we were unable to determine the exact thermal limits. It should be pointed out that these limits may vary change for differ- ent MFCs.
There are some explanations for the parts of the con- clusion that contradicts our initial hypothesis.
Because the samples were used several hours after collection, the bacterial colony might have already grown exponentially. By the time the samples were used to power the MFC, the bacteria might have al- ready begun depleting their resources. The depletion process might have been more gradual than we ini- tially expected, which would explain the fact that the electricity production decreased steadily over the pe- riod of 10 days.
A sample that has a higher percentage of silt is not a necessary sample with a lower percentage of organic matter. The initial belief that the marsh sample had the highest percentage of organic matter was solely based on that observation, thereby resulting in the misconception.
At and below 0˚C, bacteria discontinue reproducing, which might have prevented the bacterial colony from growing exponentially and thus slowed the depletion of the food source. When the electricity production of an MFC placed at the room temperature was measured, the bacterial colony might have already been near the total depletion of their food source. However, the electricity production of an MFC powered by the same sample at the same time but placed in a 0˚C environ- ment was higher because the bacterial colony had not yet come close to depleting their food source. On the other hand, extreme temperatures much colder than 0˚C might have stopped the bacteria activity. Tem- peratures much higher than 0˚C resulted in exponent- tial growth of bacteria and rapid depletion of food sources, and thus less bacteria and lower electricity production.
There are a few areas that could be further improved on in this study. If possible, we would have used an ap- paratus that could steadily increase or decrease tempera- ture in an enclosed environment in order to definitively determine the thermal limits for an MFC. Also, we could have determined whether or not the thermal limits dif- fered for MFCs powered by different samples and of different sizes. We could have tested to see how the effi- ciency varies with sample size for MFCs placed at a va- riety of possible temperatures and sample types. Addi-
tionally, we could have tested other sources of sample types such as bacteria obtained commercially, for exam- ple, Rhodospirillum Rubrum.
6. Acknowledgements
I would like to thank Professor X. Meng of Environ- mental Engineering at Steven Institute of Technology for supervising my project and providing lab space and equipment. I would like to thank Professor D. A. Vaccari for providing department funds for my experimental re- search. I would like to thank Stevens Institute of Tech- nology for allowing me to complete my experiment at the Nicoll Environmental Lab. I would like to thank Mr. Robert Cashel from Kent Place School for advising my project. Finally, I would like to thank Ms. Wendy Hall from Kent Place School for allowing me to complete this project as part of the independent student research pro- gram.
REFERENCES
[1] M. C. Potter, “Electrical Effects Accompanying the De- composition of Organic Compounds,” Royal Society B, Vol. 84, No. 571, 1911, pp. 260-276.
doi:10.1098/rspb.1911.0073
[2] K. Tweed, “Fuel Cell Treats Wastewater and Harvest Energy,” Scientific American, 2012.
[3] Y. Ahn and B. E. Logan, “Domestic Wastewater Treat- ment Using Multi-Electrode Continuous Flow MFCs with a Separator Electrode Assembly Design,” Applied Micro- biology and Biotechnology, Vol. 97, No. 1, 2013, pp. 409-416. doi:10.1007/s00253-012-4455-8
[4] Z. Du, H. Li and T. Gu, “A State of the Art Review on Microbial Fuel Cells: A Promising Technology for Wastewater Treatment and Bioenergy,” Biotechnology Advances, Vol. 25, No. 5, 2007, pp. 464-482.
doi:10.1016/j.biotechadv.2007.05.004
[5] B. E. Logan and J. M. Regan, “Microbial Fuel Cells— Challenges and Applications,” Environmental Science & Technology, Vol. 40, No. 17, 2006, pp. 5172-5180. doi:10.1021/es0627592
[6] A. Shantaram, H. Beyenal, R. Veluchamy and Z. Le- wandowski, “Wireless Sensors Powered by Microbial Fuel Cells,” Environmental Science & Technology, Vol. 39, No. 13, 2005, pp. 5037-5042. doi:10.1021/es0480668 [7] K. G. Cooke, M. O. Gay, S. E. Radachowsky, J. J.
Guzman and M. A. Chiu, “BackyardNetTM: Distributed Sensor Network Powered by Terrestrial Microbial Fuel Cell Technology,” Proceedings of SPIE 7693, Unat-tended Ground, Sea, and Air Sensor Technologies and Applications XII, Vol. 76931, 2010.
doi:10.1117/12.853930 [8] “Microbiology,” 2012.
Appendix: Procedure of Constructing the
MFC Experiment System and Conducting
the Experiment
First, we used standard transparent plastic storage con- tainers with lids to create the anode and cathode cham- bers. Using a solder, we made a hole in one side of each chamber where the compression fitting that would hold the salt bridge would be placed. We also drilled holes at the lids of both containers for the electrodes to go through when the fuel cell was assembled. We drilled an additional hole in the lid of the cathode chamber for the aquarium pump tube that would function as a part of an air bubbler.
For the salt bridges, we boiled water, added agar, and stirred. When the agar was dissolved, we added salt and stirred. Afterwards, we poured the solution into a com- pression fitting placed on a petri dish. To prevent the solution from spilling onto the petri dish, we securely covered one end of the compression fitting with alumi- num foil. Then, we placed the filled compression fitting and petri dish in the refrigerator overnight. The next day, we connected the compression fitting to the anode and cathode chambers using epoxy. Figure 5 provides a pic- ture showing the details of the anode, cathode chambers and salt bridge.
To make the electrodes, we stripped a section of insu- lator off a roll of copper wire. We bent the stripped sec- tion of bare copper wire into a rectangular shape. Then, we used nickel epoxy to glue the section of bare copper wire to the perimeter of a square of carbon cloth. When the nickel epoxy dried, we used a digital multi-meter to test the connection between the carbon cloth square and the copper wire. The resistance was low for each elec- trode made, around 2 ohms, so there was no need to make any additional electrodes. Figure 6 provides a pic-ture showing two electrodes.
To collect the top soil sample, we used a shovel to dig away the first inch of dirt and grass from the ground. We dug up the next two inches of soil to be used as my top soil sample. We collected the benthic mud sample and marsh sample at different sections of a first order stream on the Watchung Reservation in Watchung, New Jersey, USA. We collected the samples by simply using a bucket to scoop large chunks of organic matter off the sides and bottoms of the stream.
[image:8.595.317.529.84.242.2]When assembling the entire fuel cell, we filled the cathode chamber with saltwater. We turned the aquarium pump on and pushed the tubing through a hole in the lid of the cathode chamber. We filled the anode chamber with the freshly collected sample. Then, we threaded an electrode with the carbon cloth end facing downwards through the hole in the lid of the anode chamber. We threaded another electrode with the carbon cloth end
[image:8.595.314.532.281.441.2]Figure 5. Picture of anode, cathode chambers and salt bridge.
Figure 6. Picture of two electrodes.
facing up through the hole in the lid of the cathode chamber. To test the fuel cell, we clipped one end of an alligator cable to the carbon cloth of the electrode in the cathode chamber; we clipped the other end of the alliga- tor cable to a probe of the digital multi-meter. Then, we clipped one end of another alligator cable to the bare copper wire tip of the electrode in the anode chamber; we clipped the other end of the alligator cable to the other probe of the digital multi-meter. We turned the digital multi-meter on and selected mV to determine the electricity production.
To find the percent of organic matter, we first massed the samples and then heated each sample at 110˚C for 60 minutes. Next, we massed each sample, continued to heat the samples for 10 minutes, and then massed each sam- ple again. We repeated this process 3 times to find the constant mass of the dry sample. Afterwards, we heated each sample at 440˚C overnight to combust all organic matter present. Lastly, we massed the samples and then calculated the percentage of organic matter for each sample based on the data collected. We repeated the en-