ISSN Online: 2327-6053 ISSN Print: 2327-6045
The Impact of Clay Loading on the Relative
Intercalation of Poly(Vinyl Alcohol)-Clay
Composites
Moustafa M. Zagho
1,2*, Mahmoud M. Khader
31Center for Advanced Materials, Qatar University, Doha, Qatar
2Materials Science and Technology Master Program, College of Arts and Science, Qatar University, Doha, Qatar 3Gas Processing Center, College of Engineering, Qatar University, Doha, Qatar
Abstract
Polymer clay nanocomposites (PCN) materials are industrially applied because of their unique properties. However many of their physical and chemical properties have not been determined. The formed structures of polymer/clay nanocomposite depend on the nature of interactions between polymer chains and clay platelets. Ac-cording to the possible modes of interactions between polymer matrix and clay sheets, these nanocomposites can be classified into: intercalated, flocculated and ex-foliated nanocomposites. In this work, the morphology of the nanocomposite was studied using X-ray diffraction (XRD) and nanoscaning electron microscopy (NSEM). XRD and NSEM measurements confirmed the intercalation between poly(vinyl al-cohol) chains and cloisite® 20A sheets. Because of the intercalation between the clay platelets and the PVA chains, as the clay concentration increases as the band intensi-ties in FT-IR spectra increase. On the other hand, the XRD did not provide clear shift of any of the clay peaks for PVA/cloisite® 10A nanocomposites and confirm the non-intercalation between PVA matrix and cloisite® 10A platelets. The relative in-tercalation (RI) of PVA/Cloisite® 20A nanocomposites declined with increase in the clay loadings. In contrast, for PVA/Cloisite® 10A, RI values slightly increased with increasing the clay loading.
Keywords
Poly(Vinyl Alcohol), Cloisite, Nanocomposites, Relative Intercalation, FT-IR Spectra
1. Introduction
Polymers are hardly used in their pure form in industrial applications; therefore they How to cite this paper: Zagho, M.M. and
Khader, M.M. (2016) The Impact of Clay Loading on the Relative Intercalation of Poly(Vinyl Alcohol)-Clay Composites. Jour- nal of Materials Science and Chemical En-gineering, 4, 20-31.
http://dx.doi.org/10.4236/msce.2016.410003
Received: September 8, 2016 Accepted: October 8, 2016 Published: October 11, 2016
Copyright © 2016 by authors and Scientific Research Publishing Inc. This work is licensed under the Creative Commons Attribution International License (CC BY 4.0).
are vastly modified with fillers like fire retardants, plasticizers, colorants and organotin compounds. The nanocomposite materials are critically important from both the aca-demic and industrial point of views. Many of the recently published literatures are fo-cusing on polymer-nanoclay composite materials due to its performance characteris-tics.
The fabrication of polymer nanocomposites is an integral aspect of polymer nano-technology. By inserting the nanometric inorganic fillers, the properties of polymers will be improved; consequently, several industrial applications have been initiated de-pending on the inorganic material added to the polymers. Solution technique is one of the most common and less time consuming methods for the preparation of polymer nanocomposites. Polymer nanocomposites are structures in which nanoscopic inor-ganic particles, typically 10 - 100 Å in at least one dimension, are finely dispersed in an organic polymer chains to modify the thermal and mechanical properties of the poly-mer.
Structures in which the inorganic particles are the individual layers of a lamellar compound like smectite clay or a nanocomposite of a polymer (such as nylon) embed-ded among layers of silicates exhibit different physical characteristics relative to the pure polymer. A case in point, polymer-silicate nanocomposites have stiffness, strength, and dimensional stability in two dimensions rather than one. Because of nanometer length scale which minimizes scattering of light, nanocomposites are usually transpa-rent. Polymer nanocomposites offer a new alternative to traditional polymers. Filler dispersion nanocomposites exhibit significantly improved when compared to the pris-tine polymers or their conventional composites because of their nanometer sizes.
In these materials, nanofillers are dispersed in polymer network providing improve-ment in the performance characteristics of the pristine polymer. Nanocomposite mate-rials consisting of inorganic nanolayers of montmorillonite (MMT) clay and organic polymers have unique characteristics like thermal [1], mechanical [2], molecular barrier [3], flame retardant [4] and corrosion protection properties [5]-[7] of polymers at low clay loading compared to polymer composites containing common fillers and these properties can be noticed when two dissimilar chemical components combine at the molecular level.
addi-tion, these modified polymers produce well-organized nanocomposites. MMT forms stable suspensions in water and good dispersion of these inorganic crystalline platelets in water soluble polymers, such as poly(vinyl alcohol) and poly(ethylene oxide). In this paper, PVA-Cloisite® 20A and PVA-Cloisite® 10A nanomposites are studied. Moreover, this paper includes a study of the effect of clay concentration on the relative intercala-tion of poly(vinyl alcohol)-clay nanocomposites.
2. Methodolgy
2.1. Source of Chemicals and Materials
PVA was purchased from Sigma-Aldrich. Cloisite® 20A and cloisite® 10A were pur-chased from Southern Clay Products and used in the preparations without any modifi-cation. For cloisite® 20A, the quaternary ammonium used as an organic modifier for the clays is dimethyl, dihydrogenated tallow (2M2HT), where HT stands for a tallow-based compound (~65% C18, ~30% C16, ~5% C14) in which a majority of the double bonds have been hydrogenated. The modifier concentration of cloisite® 20A is 95 mequiv/100 g clay. Cloisite® 10A contains dimethyl, benzyl, hydrogenated tallow, quaternary am-monium salt (2MBHT). The modifier concentration of cloisite® 10A is 125 mequiv/100 g clay. Ethanol (95.1% - 96.9% Riedel-deHaen).
2.2. Synthesis of Polymer Nanocomposites (PNCs) Using Solution
Technique
PCN materials can be prepared using different techniques. In this article, poly(vinyl al-cohol)-clay nanocomposite (PVACN) materials were fabricated using solution method. This synthesis helped in dispersing the inorganic nanolayers of MMT sheets homoge-neously in PVA network and the PVA chains between MMT silicate layers. In this technique, PVA was dissolved first in deionized water by heating at 60˚C, the clays were dispersed in a solution of water and ethanol (in a 3:2 volume ratio). PVACN material was fabricated by adding the clay suspension to the dissolved PVA in different quanti-ties that gave varied wt% clay loadings on the final product with continuous stirring at 60˚C for 2 hr. The mixture was then left to dry out at 40˚C for several days. Then the resulted PVACN materials were finely grinded into powders using cryomil grinder in which the sample was cooled down in liquid nitrogen. The cold PVACN materials were grinded at a frequency of 0.5 Hz for 20 minutes [8]. Finally, the formed compounds can be used for morphology measurements including XRD, NSEM, and FT-IR.
3. Instruments and Methodology
3.1. X-Ray Diffraction (XRD)
in-ter-planar spacing d is calculated by the Bragg’s law (nλ = 2d sinθ) where n is an integ-er, λ is the wavelength of incident wave (1.5404 Å), and θ is the angle between the inci-dent X-ray and the scattering planes. A relative intercalation (RI) of the clay in the po-lymeric matrix has been computed as a percentage increase of the d-spacing according to the following equation:
100 o o d d RI d − = ×
where, do is the d-spacing of the pristine clay and d is the d-spacing of the clay in the nanocomposites.
3.2. Nano Scanning Electron Microscopy (NSEM)
NSEM “NOVA NANOSEM 450” was employed to study the surface morphology of PVA, pristine clays, and PCN materials. The PVA, clays, and PVACN were both dis-persed in water before spreading over the SEM holder, also were coated by a thin film of gold after drying out. Coating of dry samples with a thin film of gold was performed in a gold sputtering chamber. This technique was employed by voltage of 500 V to 30 KV.
3.3. Fourier Transform Infrared Spectroscopy (FT-IR)
Fourier Transform Infrared (FT-IR) spectroscopy is used to identify functional groups of organic or inorganic compound. FTIR analysis was conducted using the BX Perkin Elmer-FTIR Spectrometer. The samples were grounded with KBr powder. The pow-dered mixture was then filled into a press where a thin and transparent pellet was made. The pellets were placed into the sample holder for scanning.
4. Results and Discussion
4.1. Structural Morphology (XRD & SEM)
The morphology of the clay-containing PVA systems was evaluated using a combina-tion of XRD and NSEM. The XRD analysis and SEM observacombina-tions are used to study the dispersion and exfoliation of nanoparticles. XRD analysis determined the interlayer spacing of the silicate layers in the original layered silicates and in the intercalated na-nocomposites. NSEM defined qualitatively the internal structure, spatial distribution and dispersion of the nanoparticles within the polymer matrix.
clay silicate layers stacking) [9].
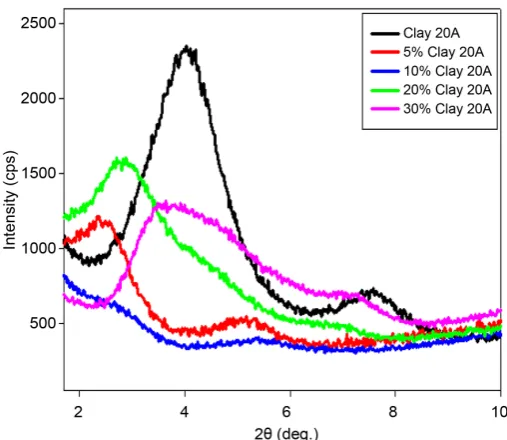
The XRD patterns of the Cloisite® 20A powder and nanocomposite powders are shown in Figure 1. The peak at 2θ = 3.8˚ is attributed to the basal spacing (~23 Å) of the Cloisite® 20A. The observed increase in the basal spacing of the PVA/Cloisite® 20A samples explains the formation of intercalated structures, due to the polymer chains penetrating into the clay sheets (Table 1). This expansion of the clay’s basal spacing is due to strong interactions between the modified clay’s surface and the polymer groups via the formation of hydrogen bonding with the clay platelets [8].
It should be noted that there is a decrease of the clay’s basal spacing of Cloisite® 20A in PVA-Cloisite® 20A composites as the clay loading increases from 5 wt% to 30 wt% as shown in the Figure 1 and this can be due to that the polymer chains concentration decreases from 95 wt% to 70 wt% respectively, so the polymer chains can’t penetrate into the clay galleries and lead to weak intercalations.
[image:5.595.246.500.322.542.2] [image:5.595.193.553.595.704.2]Contrary to PVA/Cloisite® 20A PNC, the XRD of PVA/Cloisite® 10A clay mixture did not show significant shift of any of the clay’s XRD peaks due to adding PVA; indi-cating that Cloisite® 10A did not intercalate with the PVA chains. Because the molecular
Figure 1. XRD patterns of Cloisite® 20A and PVA/Cloisite® 20A at clay loading of 5 wt% - 30 wt%.
Table 1. d-spacing of Cloisite® 20A in PVA composites at loading rate of 5 wt% - 30 wt%.
Sample 2θ (deg.) d-spacing (Å)
Cloisite® 20A 3.80 23.2
PVA/Cloisite® 20A, 5% 2.50 35.3
PVA/Cloisite® 20A, 10% 2.67 33.0
PVA/Cloisite® 20A, 20% 2.87 30.8
structure of Cloisite® 10A contains a benzyl moiety, it is unlikely to promote the inte-ractions with a polar polymer like PVA, as signified from the XRD results (Figure 2). In this case, the interactions between the clay particles and the polymer were very weak and thus, the polymers could not enter into clay galleries. A phase separated composite was instead formed [8].
It can be seen that there is no increase of the clay’s basal spacing of Cloisite® 10A in PVA/Cloisite® 10A composites (Table 2) as the clay loading increases from 5 wt% to 40 wt% and a slight increase of the clay’s basal spacing in case of 50 wt% of clay loading as shown in Figure 2. This is due to the polymer chains can’t penetrate into the clay galle-ries where the molecular structure of Cloisite® 10A contains a benzyl moiety leading to poor interactions.
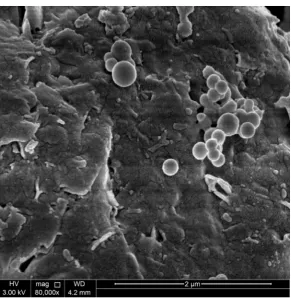
[image:6.595.246.503.356.575.2] [image:6.595.195.554.626.705.2]Another important evidence for the intercalation of PVA with Cloisite® 20A is shown from the SEM images. The presented Figures 3-7 show the NSEM of pure PVA, bulk Cloisite® 20A, bulk Cloisite® 10A, PVA/5 wt% Cloisite® 20Ananocomposite, and PVA/5 wt% Cloisite® 10A nanocomposite. Figure 6 shows well-dispersed clay 20A flakes within the polymeric chains. Both the XRD and the SEM results indicated that PVA/Cloisite® 20A composites had structures in which the polymeric matrix were inter-calated between the clay platelets resulting in a multilayer morphology, built up with
Figure 2. XRD patterns of Cloisite® 10A and PVA/Cloisite® 10A at clay loading of 5 wt% - 50 wt%.
Table 2. d-spacing of Cloisite® 10A in PVA composites at loading rate of 5 wt% - 50 wt%.
Sample 2θ (deg.) d-spacing (Å)
Cloisite® 10A 4.80 18.4
PVA/Cloisite® 10A, 5% 4.80 18.4
PVA/Cloisite® 10A, 20% 4.80 18.4
Figure 3. NSEM micrograph of the pure PVA.
[image:7.595.228.520.390.689.2]Figure 5. NSEM micrograph of the bulk Cloisite® 10A.
[image:8.595.227.521.394.684.2]clay layers, well separated from one another and individually dispersed in the conti-nuous polymer matrix [10].
[image:9.595.226.522.159.451.2]It should be noted that the characteristic peak of PVA of about 2θ = 19.4˚ is not af-fected when PVA interact with different types of clay such as Closite® 20A and Closite® 10A and at loading rate of 5 wt% as seen in Figure 8.
Figure 7. NSEM micrograph of PVA/5 wt% Cloisite® 10A nanocomposite.
[image:9.595.254.497.484.685.2]The relative intercalations (RI) of PVA/Clay nanocomposites at different clay loading rates are summarized in Table 3. For PVA/Cloisite® 20A nanocomposites with increase in clay loading, a decrease in RI was observed. For PVA/Cloisite® 10A, RI values slightly increased with increase in the clay loading. The decrease in the intercalation of Cloisite® 20A could possibly be due to the decrease in the concentration of PVA chains in the nanocomposites which are responsible for the formation of hydrogen bonding with the clay platelets and so resulted in a weak interaction between the polymer matrix and the clay platelets. Whereby the increase in RI of Cloisite® 10A at low concentration of PVA was presumably due to the presence of small crevices in this clay which would have got saturated even with a small amount of added PVA and so the intercalation slightly in-creases.
4.2. Fourier Transform Infrared (FT-IR) Measurements
The FT-IR spectra of pure PVA, organophilic clay Cloisite® 20A and PCN materials are illustrated in Figure 9. The characteristic vibration bands of PVA are shown at 3420 cm−1 (-OH), 2943 cm−1 (-CH
3), 2891 cm−1 (-CH2), 1450 cm−1 (O=C-OR), 1110 cm−1 (C-O-C) and 862 cm−1 (-CH
2). Due to the intercalation between the clay platelets and the polymer matrix, as the clay loading increases as the band intensities in FT-IR spec-tra increases [11].
The FT-IR spectra of pure organophilic clay Na-rich MMT and pure Cloisite® 20A are presented in Figure 10. It is clear that there are more bands in Cloisite® 20A than Na-rich MMT. These bands were found at 2921.38, 2849.57, 1467.42 cm−1. Cloisite® 20A is a modified clay of Na-rich MMT, where the quaternary ammonium used as an organic modifier for the clays is dimethyl, dihydrogenated tallow (2M2HT). Therefore, these bands are due to the replacement of Na+ ion of Na-rich MMT by quaternary am-monium group (2M2HT for Cloisite® 20A) as illustrated in Figure 10.
5. Conclusion
[image:10.595.196.554.536.707.2]In this work, the research on different PVA silicate nanocomposites has been presented.
Table 3. Relative intercalation (RI) of PVA/clay nanocomposites at different loading rates.
Sample d-spacing (Å) RI (%)
Cloisite® 20A 23.2 -
PVA/Cloisite® 20A, 5% 35.3 52.2
PVA/Cloisite® 20A, 10% 33.0 42.2
PVA/Cloisite® 20A, 20% 30.8 32.8
PVA/Cloisite® 20A, 30% 23.4 0.86
Cloisite® 10A 18.4 -
PVA/Cloisite® 10A, 5% 18.4 0
PVA/Cloisite® 10A, 20% 18.4 0
Figure 9. Representative FT-IR spectra of PVA, PVA/Cloisite® 20A nanocomposites and bulk Cloisite® 20A.
Figure 10. Representative FT-IR spectra of pure Na-rich MMT and pure Cloisite® 20A.
[image:11.595.247.502.322.551.2]within the PVA gallery, presumably, due to intercalation. In FT-IR spectra, because of the intercalation between the clay platelets and the polymer matrix, as the clay loading increases as the band intensities increase. For the second one, PVA/Cloisite® 10A na-nocomposites, the XRD did not show significant shift of any of the clay peaks which confirm that there is no intercalation.
Acknowledgements
The financial support of this research by NPRP Grant # 09-260-1-048 from the Qatar National Research Fund (a member of Qatar Foundation) is gratefully acknowledged.
References
[1] Lan, T., Kaviratna, P.D. and Pinnavaia, T.J. (1994) On the Nature of Polyimide-Clay Hybrid Composites. Chemistry of Materials, 6, 573-575. http://dx.doi.org/10.1021/cm00041a002
[2] Tyan, H.-L., Liu, Y.-C. and Wei, K.-H. (1999)Thermally and Mechanically Enhanced Clay/ Polyimide Nanocomposite via Reactive Organoclay. Chemistry of Materials, 11, 1942-1947.
http://dx.doi.org/10.1021/cm990187x
[3] Wang, Z. and Pinnavaia, T.J. (1998) Nanolayer Reinforcement of Elastomeric Polyurethane. Chemistry of Materials, 10, 3769-3771. http://dx.doi.org/10.1021/cm980448n
[4] Gilman, J.W., Jackson, C.L., Morgan, A.B., Hayyis, J.R., Manias, E., Giannelis, E.P., Wu-thenow, M., Hilton, D. and Philips, S.H. (2000) Flammability Properties of Polymer- Layered-Silicate Nanocomposites. Polypropylene and Polystyrene Nanocomposites. Che-mistry of Materials, 12, 1866-1873. http://dx.doi.org/10.1021/cm0001760
[5] Yeh, J.-M., Liou, S.-J., Lai, C.-Y., Wu, P.-C. and Tsai, T.-Y. (2001)Enhancement of Corro-sion Protection Effect in Polyaniline via the Formation of Polyaniline-Clay Nanocomposite Materials. Chemistry of Materials, 13, 1131-1136. http://dx.doi.org/10.1021/cm000938r
[6] Yeh, J.-M., Chen, C.-L., Chen, Y.-C., Ma, C.-Y., Lee, K.-R., Wei, Y. and Li, S. (2002) En-hancement of Corrosion Protection Effect of Poly(o-Ethoxyaniline) via the Formation of Poly(o-Ethoxyaniline)-Clay Nanocomposite Materials. Polymer, 43, 2729-2736.
http://dx.doi.org/10.1016/S0032-3861(02)00005-8
[7] Yeh, J.-M., Liou, S.-J., Lin, C.-Y., Cheng, C.-Y., Chang, Y.-W. and Lee, K.-R. (2002) Anti-corrosively Enhanced PMMA-Clay Nanocomposite Materials with Quaternary Alkylphos-phonium Salt as an Intercalating Agent. Chemistry of Materials, 14, 154-161.
http://dx.doi.org/10.1021/cm010337f
[8] Al-Marri, M.J., Masoud, M.S., Nassar, A.M.G., Zagho, M.M. and Khader, M.M. (2015) Synthesis and Characterization of Poly(Vinyl Alcohol): Cloisite® 20A Nanocomposites. Journal of Vinyl and Additive Technology.
[9] www.clays.org
[10] Chin, I.-J., Thurn-Albrecht, T., Kim, H.-C., Russell, T.P. and Wang, J. (2001) On Exfolia-tion of Montmorillonite in Epoxy. Polymer, 42, 5947-5952.
http://dx.doi.org/10.1016/S0032-3861(00)00898-3
[11] Yu, Y.-H., Lin, C.-Y., Yeh, J.-M. and Lin, W.-H. (2003) Preparation and Properties of Poly(Vinyl alcohol)-Clay Nanocomposite Materials. Polymer, 44, 3553-3560.
Submit or recommend next manuscript to SCIRP and we will provide best service for you:
Accepting pre-submission inquiries through Email, Facebook, LinkedIn, Twitter, etc. A wide selection of journals (inclusive of 9 subjects, more than 200 journals)
Providing 24-hour high-quality service User-friendly online submission system Fair and swift peer-review system
Efficient typesetting and proofreading procedure
Display of the result of downloads and visits, as well as the number of cited articles Maximum dissemination of your research work