Model of the singular current source—The indicator
of geodynamic processes in Japan in 2009-2011
Ludmila F. Moskovskaya
Saint Petersburg Branch of the Institute of Terrestrial Magnetism, Ionosphere, and Radio Wave Propagation, Russian Academy of Sciences, Saint Petersburg, Russia; [email protected]
Received 13 June 2013; revised 13 July 2013; accepted 20 July 2013
Copyright © 2013 Ludmila F. Moskovskaya. This is an open access article distributed under the Creative Commons Attribution Li-cense, which permits unrestricted use, distribution, and reproduction in any medium, provided the original work is properly cited.
ABSTRACT
The calculation method of the location of the singular generalized current source according to synchronous measurements of the magnetic field in the remote points is proposed. It is de- signed for the continuous monitoring of chan- ges of the degree of electromagnetic heteroge- neity of the geophysical environment. Regular fluctuations of the apparent distance to the ef- fective single source were recorded according to the magnetic data of the observatories in Ja- pan 2009-2011. They are connected with the rhythm of the geodynamic processes in the vi- cinity of the station Kakioka. The most signifi- cant decrease in the apparent distance was registered in connection with the seismic acti- vation of the region, including the catastrophic earthquake of March 11, 2011 with a magnitude of M = 9.1. The anomalous behavior of the ap- parent parameters of the generalized source was displayed not less than two weeks before the earthquake. Characteristic changes of the curves were registered in the period of three months.
Keywords:Precursors of Earthquakes; Processing of Magnetic Field Measurement; Geodynamics
1. INTRODUCTION
Tectonic activity is associated with the transformation and the release of enormous energies and is accompanied by abnormal changes of different physical fields. A wide complex of geophysical research is applied to studying the phenomena occurring and diagnostics of seismic activa- tion of the region. It is primarily direct method: seismic survey and registration of radiation associated with the deformation and crushing of rock—the acoustic and
low-frequency electromagnetic radiation, gas emanations [1-5] Preparation processes are reflected variations of anomalies of temperature and pressure, electrical resis- tivity of the earth's crust [6-11]. Due to the close interac- tion of geophysical shells, the Earth abnormal physical fields of the lithosphere in the process of earthquake preparation excite anomalies in the atmosphere and ionosphere. Precursor of large earthquakes was detected by satellite measurements [12-14]. Long-term monitor- ing of various fields in earthquake-prone regions gives an opportunity to develop new and improve the tradi- tional approaches to data analysis, based on the real field experiment. We can speak about the methods of registra- tion fields of direct change in the environment and changes in the fields-consequences caused by primary. So anomalies of pressure, temperature, gas emanations can be considered as the core of electromagnetic re- sponse.
In this article, we proposed a model of the singular source for the joint processing of synchronous measure- ments of the magnetic field in spatially separated points. This approach in a sense is similar to the mediated regis- tration of changes in the environment. It simplifies the analysis of the material. The apparent distance to the singular source is connected with electromagnetic proc- esses occurring in the environments of the earth. This transformation reduces the decision dimension and thus simplifies the analysis of temporal intervals of anoma- lous behavior.
2. THE INITIAL DATA AND THEIR
PRIMARY PROCESSING
2.1. Data and Sources
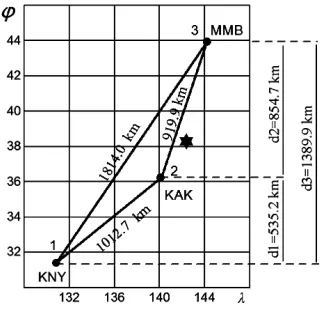
log-search.html). We analyzed the time series of the vec- tor of the magnetic field (H, Z-component) of the three observatories Japan: Kanoya, Kakioka, Memambetsu. The sample rate is 1 second, an accuracy of 0.01 nT. The stations form a triangle, extending in the meridional di- rection (Figure 1). Seismic catalog contains medium and
large earthquake M ≥ 4. The paper presents the results of studies of monitoring from 1 January 2009 to 30 Sep- tember 2011.
2.2. Pre-Processing of the Measurements of the Magnetic Field
The problem was to detect changes in magnetic fields associated with seismic activity of the region. We used night segments of the time series, minimally contami- nated by man-made noise. On a three-hour interval of the day (from 1:30 to 4:30 hours local time) were calculated average values of the horizontal (H) and vertical (Z) component. Each function of the mean values was di- vided into the time trend and anomalous components, that contains the local variations of the field. The split- ting was made by the method of adaptive robust filtration [15,16] in a sliding window 61 days. It turned out that the horizontal projection of the anomalous fields has the form is functionally identical index Dst-variation of the magnetic field (http://wdc.kugi.kyoto-u.ac.jp). Verti- cal components of anomalous field at all three stations are also functionally similar. Amplitude component of anomalous field decreases with increasing distance of the station from the equator.
The discovery of a close functional relationship anomalous components at all stations made us try to analyze the material using a single model of interpreta- tion.
3. SINGULAR CURRENT SOURCE
3.1. Rationale Model of InterpretationThe ring current is the leading physical process which specifies the form of variation of the anomalous fields. Variations of the magnetic field penetrate all the physical space, initiating secondary currents in the environment. Physical carrier of current systems can be electromag- netically active environments of the Earth: plasma, ionosphere, lithosphere. The distance between the ob- servatories is 900 - 1800 km. Distance to the nearest ob- servatories conducting environment, the crust of the earth and the ionosphere, much less. Electromagnetic properties of environment change as a vertically so later- ally. Large spatial dimensions of the electromagnetic disturbances, their proximities to surface observations re- quire to describe the electromagnetic characteristics of conducting environments of the use of multivariate model. At the same time the number of registration points of field very little. It is known that the solution of
inverse problems of geophysics not single [17]. There are equivalent distributions of anomalous sources, creating a specified morphology of the field. For example, the po- tential field of the layer can be simulated by object of another class models—singular source. In result, the number of model parameters is reduced.
The geometry of the current systems of planetary scale for the low latitudes: the ring current, equatorial current have a latitudinal direction. Diurnal variation of the magnetic field is modulated Sq - current variations that are connected with a wind movement of air masses. Ac- cording to the experimental data in 4 hours local time on the latitude 40˚, vector wind currents are mainly directed to the West with a small projection on the North [18].
We used a simple model of interpretation: a homoge- neous nonconducting space where parallel to the plane of observation (in the latitudinal direction) flows horizontal current. The magnetic field is measured in points located perpendicular to the current stream (on meridian). Effec- tive singular source we call horizontal line current, which is equivalent to the real current distribution relative se-lected parameters of the magnetic field in the given points of observation. The problem consists in determin- ing the coordinates of a source in the plane perpendicular to the line current. We used in the calculations only ver- tical (Z) and horizontal (H) anomalous components.
The practical application of such a schematic model lies in the transformation of several signals of the anomalous magnetic field to the functions of the coordi- nates of the effective current source. And investigation of the regularities of changes of parameters of the model over time.
3.2. Ways to Calculate the Coordinates of the Singular Current Source
We used three ways of calculation. We will briefly the main ideas.
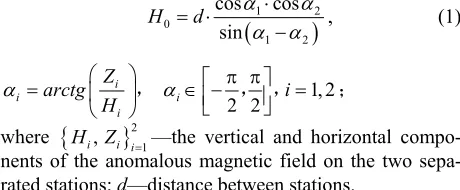
1) Geometric method (Figure 2(a)). Line current gen-
erates a magnetic field lines which lie in the perpendicu- lar plane. The magnetic field lines lie on the tangent to a circle perpendicular to the radius of the source. The height H0 of the line current is determined by the ex-
pression:
1
0
1 2
cos cos sin
H d 2
, (1)
1, 2 2 2
i
i i
i
Z arctg
H i
, , , ;
where
H Zi, i
i21—the vertical and horizontal compo-nents of the anomalous magnetic field on the two sepa- rated stations; d—distance between stations.
[image:2.595.308.538.626.721.2]Figure 1. The layout of magnetic observato-ries Japan. KNY—Kanoya (φ = 31.424˚, λ = 130.880˚), KAK—Kakioka (φ = 36.232˚, λ = 140.186˚), MMB—Memambetsu (φ = 43.910˚,
λ = 144.189˚). The asterisk marks the earth- quake M=9.1, 11 March 2011.
cing of observation points fields 1.2 left to right and the position of the source above.
2) The energy method (Figure 2(b)). Determination of
the position of a concentrated source can be based on the hypothesis on the rate of decreasing fields, depending on the distance to a source. We postulate the law downturn field F R
R. The decay rate for the point singular source (Biot-Savart law) is equal to two: 2. The integral over the length of the infinite straight line gives the decay rate 1.The real distribution of the hori- zontal current in the volume will lead to the fact that the provisions of the apparent centres effective current sources will be shifted closer to the observation points of the magnetic field. Thus, effective distance to the com- mon source will become weaker vary. This is equivalent to reducing the rate of decay of the field. The height H0of the line current is determined by the expression:
2 20 2 0 1 2
2 2
0
2 2
0 3 0 3 3
3
1
, 1
1
1 , 1
1
X r X d r
r H
X r X d r
r (2)
where
2 2 2 2
3 2 1 3 2 3
0 2 2 r3 2
1 3 3 2 1 1
1 1
1 ; , ;
2 1 1
d r d r R R
X r
d r d r R R
31
1, 2,3.
, , 1
i i i i i
R F i H Z
components of the ano-
malous magnetic field in three spaced stations;
di i31 – the distance between the stations. -exponential quan- tity of field decay in dependence of distance from the source: FR , where F H H Z Z —the module of the magnetic field.3) Geometrically-energy method (Figure 2(a)). Coor-
dinates effective source is evaluated based on the rate of decay for the fields depending on the distance to the source and raster corner of the output of an electromag-
netic wave from efficient source.
The height H0 of the line current is determined by
the expression:
0
0 2
0 sin
1 2 cos
r H d r r
, (3)
where
1 2
1
, i i ,i
R
r R F
R
1, 2.
2
Angle, which is opposite the base of the triangle
0 1
, where i
i i Z arctg H
, i 2 2,
,
i = 1, 2;
H Zi, i
i21—the vertical and horizontalcomponents of the anomalous magnetic field on the two separated stations; d—distance between stations. -exponential quantity of field decay in dependence of distance from the source: F R
R , whereF H H Z Z —the module of the magnetic field.
3.3. Indexes Spatial Homogeneity
Model interpretation assumes that current source is the same for all three stations. In reality, in the vicinity of a station may experience additional electromagnetic het- erogeneity lithospheric or ionospheric. This will cause the displacement of the estimation of the parameters of a generalized source. If the field of spatial rather homoge- neous and can be simulated a singular source, then geo- metrical orderliness is necessary. For sequence of the registration points of fields (1, 2, 3) values of the angle of the direction to the source are an ordered:
1 2 3
or 123. Angles are measured
from the vertical. The possibility to solve the problem of determining the coordinates of a common source ac- cording to three stations in the energy method is deter- mined by the energy criterion of spatial uniformity of the field.
[image:3.595.92.253.84.239.2]We introduced indexes geometric and energetic ho- mogeneity to describe the spatial uniformity of the mag- netic field. If the in current day criterion of homogeneity was correct or not correct, then the index relies equal to
[image:3.595.307.540.125.312.2] [image:3.595.311.535.587.698.2]either 1 or 0. We also used the generalized index of ho- mogeneity is defined as the arithmetic average of the first two.
3.4. Comment about the Choice of the Model of Interpretation
The homogeneous space is extremely schematic model of the enclosing environment. In reality, we are dealing with a system spatially separated electroconductive lay- ers of the Earth carries of current systems. The solution to problem of determining the magnetic field from the source in the environment can be approximated by the composition of multiple reflections from the boundary layers [19]. The lithosphere and the ionosphere are the closest to the points of measurements of the magnetic field. They are electromagnetically active environments. Currents generated by a variety of physical processes can occur here. Current configuration in conducting shells defines the main energy contribution to the cumulative result in the given time. Effective singular source can be either in the lower half-space, or the top.The position of the generalized source relative to the plane of observa- tion of the magnetic field is determined by the order of the changes in angles: 123
3
—the upper half- space and 12 – the lower.
4. THE RESULTS OF DATA
PROCESSING
4.1. The Apparent Distance of the Generalized Singular Source to the Earth
We estimated the effective distance to the singular current source for three variants of calculations. Indicator field decay with distance was set equal to 1. The calculations were performed using projections of dis- tances between the stations at the meridian (Figure 1).
We carried out a separate analysis of the functions of the distance to sources, caught up in the upper and lower half space, and the function module distances. It turned out that the average logarithmic levels for the years 2009-2010 the same name pairs of evaluation differ not more than 3%. This value significantly is less than the local fluctuations of the functions.
Generalized source is often in the upper half-space. The boundary surface-to-air is a physical border, defin- ing the main geometry reflection. In this article we show module function of distance to the surface of the earth. Short-term variations of the magnetic field of the Earth are generated by external causes: solar-terrestrial relation- ships. Field changes caused by variations of geoelectrical parameters of the lithosphere-atmosphere-ionosphere associated with geodynamic processes are characterized by longer periods of course. For the best selection of
search effects of geodynamic processes on the fields, the functions of the apparent distances singular source and spatial uniformity indexes have been smoothed using a robust filtering. We used a logarithmic scaling of the distance signal at the filtering. The average levels of the apparent distances differ for different ways of solving problem (Figure 3). Logarithmic average (km) is
calcu-lated for 2009-2010 are: lg H
1.KNY-KAK
3.4;
1.KAK-MMB
lg H 3.7; lg H
1.KNY-MMB
3.8;
2.KNY--KAK-MMB
lg H 3.1; lg H
3.KNY--KAK
3.1;
3.KAK--MMB
lg H 3.1; lg H
3.KNY--MMB
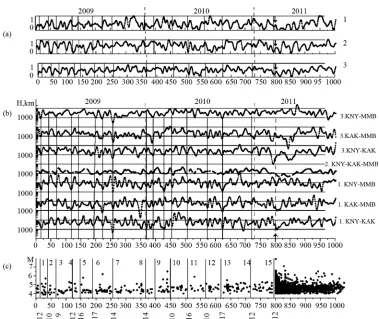
3.25.The dynamic range of the signal changes the functions of distances is one order for a relatively quiet seismic period of the first two years. Generally more functional similarity of the apparent distance charts is found for different pairs of stations of one and the same variant of estimation. The nature of the behavior functions of the apparent distances, defined by measurements of fields at various stations, was found to be significantly different in the period immediately preceding the explosion of seismic activity 11 March 2011, and during its highest level.
The apparent distances calculated for the neighbouring stations Kanoya-Kakioka (KNY-KAK), Kakioka-Me- mambetsu (KAK-MBB) revealed the sharp anomalous reduction of the level in the form of several long deep local minima of a function during the time interval of seismic activation, while the estimates, made according to the distant stations Kanoya-Memambetsu (KNY-MMB) found no such tendency. An abnormal decrease the ap-parent distance in the period of seismic activation also clearly manifested in the energy method calculation while using measurements of three stations.
4.2. Variations of the Apparent Distance to the Singular Source Pre-Earthquake on March 11, 2011 and Related Subsequent Seismic Activation Zone
11 March 2011 corresponds to 800 monitoring day. Days are counted from 1 January 2009. Most strongly the effect of reducing the apparent distances manifested in the ways of calculation, involving energy assumptions about the rate of decay of the field (Figure 3(b)). For
energy-geometrical estimation for a pair of stations (KNY-KAK) abnormal decline apparent distance to the generalized source is distinctly registered since 776 days, and reaches the first minimum (52 km) in 794 day moni- toring (6 days before EQ). Thus, anomalous trend was found to 24 days before the event. Signal crosses the level of 1000 km in 784 day, 16 days before the catas- trophic earthquake. The second deep minimum of the curve (140 - 150 km) is recorded in 845 - 855 day. Re- turn to the level of 1000 km occurs in 869 day. The dura- tion of the anomalous behavior of the function is 85 days.
Figure 3. The parameters of the singular source and seismic activity. (a) Average indexes field homoge-neity on the three stations: geometric index 1), energetic index 2), the arithmetic average of the two 3). Averaged window is 7 days. (b) The distance to the singular source. Version of the estimation and sta-tions, whose measurements were used to calculate, marked on the right. The results of all variants were filtered with window 7 days. Graphics consistently shifted relative to the previous on two orders of magnitude. The vertical lines mark the minima of functions. (с) The time sequence of earthquakes in a radius of 300 km around the station Kakioka. Vertical lines indicate a pauses of seismic activity. Num-bers show the duration in days.
MMB) revealed a decline signal since 778 day. The level of less than 1000 km was traversed in 783 day (17 days before). The first minimum of H = 262 km is fixed in 791 day (9 days before). The second (global) minimum apparent distance is detected on 844 day, another mini- mum H = 240 km on 858 day. Crossing the level of 1000 km occurs in 864 day. The duration of the anomalous behavior of the functions of the apparent distance is 81 day.
Activization of seismic activity zone manifested in the perturbation fields, indices homogeneity fall to zero in some intervals (Figure 3(a)).
Reduction of the apparent distance of the generalized source, the most violent manifestation of the effect in the estimates, including the energy component signals, no effect when processing data pair remote observatories (KNY-MMB)—all this suggests that the reason for this behaviour change assessments is the local electromag- netic heterogeneity. It is concentrated in the vicinity of the central observatory Kakioka and increases in connec- tion with the activation of the seismic zone.
When energy method of distances definition simulta- neously by the fields of the three stations is used, esti- mates are functionally more sustainable. Anomalous re- duction of the apparent distances H < 1000 km kept most long—108 days: on the interval 784 - 891 days. A de- crease is recorded 16 days before. Three minimum stand out: H(802) = 331 km, H(822) = 672 km, H(886) = 615 km. It should be noted that in this version of the estima- tion a large number of points was excluded because of an incompatibility of a system of equations. The decision became possible only for 517 data points from 1002.
4.3. Correlation of Variations of the Apparent Distance to the Singular Source with the Rhythm of Seismic Activation of the Geological Structure
Visual analysis of the number of seismic events of medium and high energy during the time has shown, that in the vicinity of the station Kakioka clearly manifested by the rhythmic nature of tectonic processes. Time intervals of seismic activation interspersed with pauses. The nature of dynamics of seismic events is saved when you increase the area under consideration of the radius of 300 to 500 km. For stations Kanoya and Memambetsu was not revealed such a pulsation. Se- quence of seismic events within a radius of 300 km around the observatory Kakioka is shown in Figure 3(c).
It turned out that the reduction in the extent or another, apparent distances to the effective current source pre- cedes almost all the launches of a series of earthquakes. Reduction accompanied by a decrease field homogeneity (Figure 3(a)). Vertical lines are plotted on the local
minima in figure. The most powerful seismic shocks
(M > ), occurring within the series, also may be pre-
ceded by the apparent distance reduction (interval 6-7, 9-10).
M 4
6
5. RESULTS DISCUSSION
The results of mathematical modeling can be genera- lized to the two main assertions. Estimation of the ap- parent distance to the singular generalized current source, which can be matched to the anomalous magnetic field, was obtained. The apparent distance greatly changes in time. And these variations are associated with geody- namic processes in the region.
5.1. The Apparent distance to the Generalized Source
The question arises: what is the sense to invest in the distance to the generalized source? For understanding, let remind the main sources of magnetic variations of the planetary origin. Variations of the currents flowing in the environments of the Earth are the cause of the variations of the magnetic field. Carriers of current systems are spatially separated.
For low and mid-latitudes they are: a circular electric current trapped particles in the radiation belts (height range
4 6
RE, —radius of the Earth km), ionospheric currents (≈100 to 1000 km), the most inten-sive at altitudes between 100 and 400 km, Sq variation and equatorial electrojet, currents in plasma [20], the currents in the lithosphere. Interaction of the magneto- sphere with the solar wind causes variations in the ring current, accompanied by variations of the magnetic field, which in turn induce electric currents in the downstream6371 E
R
areas of increased conductivity.
A set of continuously existing coordinated currents distributed in environment is normal or background. Depth (or height) of penetration and density of the nor- mal currents in the shells may vary with time. Currents of the lithosphere and ionosphere will considerably in- fluence the result of the estimations, as the distance from the observatories to them much less. Generalized current source is the mathematically equivalent solution (in terms of creating the anomalous magnetic field in points observations) to the system of currents, distributed on a set of spatially separated physical carrier. Effective dis- tance reflects a measure of the intensity of the electro- magnetic excitation of the environment.
5.2. Variations of the Apparent Distance to the Generalized Current Source
Local space-time electromagnetic variations, associ- ated with geodynamic processes, are imposed on the en- ergy main carrier signal. The share of these processes in the aggregate result of the calculation is significant due to the proximity of sources of anomalies to the points of registration of the magnetic field.
Model of the singular source registers phenomenon. The real reasons can be varied. We can speak about pas- sive variations are associated with variations of the inte- gral parameters of the environment, and active – caused by existence of current systems. Variations of pressure, humidity, temperature, structural changes or rock de- struction are reflect in the geoelectric characteristics of the geological section [6,8,11]. Active sources of electric current, generated under pressure in the course of rock failure, may also be the causes of electromagnetic anomalies [9,10]. Perturbations of atmosphere and iono- sphere are associated with seismic activation of the earth's crust [12,14]. Change column resistance over an area of seismic preparation leads to a change in the ionospheric potential. Variations of atmospheric electric- ity cause variations of ionospheric parameters: electron and ion concentrations, electron and ion temperature, ionic composition, scale heights of the ionospheric lay- ers.
Thus, the model of an effective singular source of cur- rent works as a detector and the amplifier response func- tion on the electromagnetic processes in the environ- ments of the earth and caused by tectonic movements of the earth’s crust.
6. CONCLUSIONS
tance to the singular source. Space-time local anomalies are superimposed on the background level of the carrier signal, which is determined by the global processes of electromagnetic dynamics of shells of the Earth. The cause of local variations may be associated with elec- tromagnetic phenomena accompanying the geodynamic processes in the lithosphere-atmosphere-ionosphere.
Important characteristics of the anomalous phenome- non are the spatial and temporal scale of variations. The anomalous behavior of the apparent distance to the gen-eralized source in the energy methods of calculation manifested not less than two weeks before the catastro- phic earthquake. Changes curves were recorded during the three months. Regular declining of the apparent dis- tances and decrease field homogeneity, coinciding with the lull seismic activity time intervals, can be interpreted as the emergence in these periods, and an additional per- turbation of the magnetic field. This effect is registered synchronously at all stations, and has a spatial dimension not less than the size of the entire structure. In turn ab- normal manifestations, which are caused by activization zones 11 March 2011, localized in the vicinity of the station Kakioka, in the measurements of the remote sta- tions are manifested weaker.
The main result of the study is the fact that, according to the measurements of the magnetic field of three ob- servatories in Japan for 2009-2011, the regular variations of the apparent distances to the effective singular source, associated with the rhythm of the geodynamic processes in the vicinity of the station Kakioka, were recorded. Most strongly the apparent distance decrease manifested in connection with the activation of seismicity of the region, including the catastrophic earthquake on March 11, 2011 with the magnitude M = 9.1.
Singular generalized source diagnoses measure elec- tromagnetic heterogeneity of lithosphere and the iono- sphere in the vicinity of the magnetic observatories. The system of three observatories proved itself as a kind of magnetic locator electromagnetic phenomena associated with seismic activity in the vicinity of the observatory Kakioka.
7. ACKNOWLEDGEMENTS
I must express my deep appreciation to the scientific communities of the supporting scientific sites, for the opportunity to use data of mag- netic observatories Japan and Seismic catalogue California. And thank Professor Yu. A. Kopytenko for constructive discussion of the results.
REFERENCES
[1] Sobolev, G.A. and Lyubushin, A.A. (2006) Microseismic impulses as earthquake precursors, Izvestiya, Physics of the Solid Earth, 42, 721-733.
doi:10.1134/S1069351306090023
[2] Kopytenko, Yu.A., Ismagilov, V.S., Kopytenko, E.A., Vo- ronov, P.M. and Zaitsev, D.B. (2000) Magnetic location of geomagnetic disturbance sources. Doklady Earth Sci- ences, 371A, 569-571.
[3] Moskovskaya, L.F. (2012) Directional and correlation analysis from the geomagnetic monitoring and seismic data on the Boso Peninsula in 2000. Izvestiya, Physics of the Solid Earth, 48, 532-546.
doi:10.1134/S1069351312060043
[4] Gorbatikov, A.V., Molchanov, J.F., Hayakawa, M., Uyeda, S., Hattori, K., Nagao, T., Tanaka, H., Nikolaev, A.V. and Maltsev, P. (2002) Acoustic emission possibly related to earthquakes, observed at Matsushiro, Japan and its im- plications. In: Hayakawa, M. and Molchanov, O.A., Eds., Seismo Electromagnetics: Lithosphere-Atmosphere-Ionos- phere Coupling, TERRAPUB, Tokyo, 1-10.
[5] Guglielmi, A.V., Tsegmed, B., Potapov, A.S., Kultima J. and Raita, T. (2006) Seismomagnetic signals from the strong Sumatra earthquake. Izvestiya, Physics of the Solid Earth, 42, 921-927. doi:10.1134/S106935130611005X [6] Moroz, Yu.F. and Moroz, T.A. (2012) Correlation of the
anomalies in the electric field and electric conductivit of the lithosphere to earthquakes in Kamchatka. Izvestiya, Physics of the Solid Earth, 48, 287-296.
doi:10.1134/S1069351312010090
[7] Moskovskaya, L.F. (2007) Impedance-admittance regres- sion analysis of magnetotelluric fields. Izvestiya, Physics of the Solid Earth, 43, 148-160.
doi:10.1134/S106935130702005X
[8] Moskovskaya, L.F., Kopytenko, Yu.A. and Hayakawa, M. (2010) Magnetotelluric and seismic monitoring in a sub- duction zone of the Japan, Problems of geophysics. 43. SPb, St. Petersburg University, 108-125.
[9] Vallianatos, F. and Tzanis, A. (1999) A model for the generation of precursory electric and magnetic fields as-sociated with the deformation rate of the earthquake focus. In: Hayakawa, M., Ed., Atmospheric and Ionospheric Elec- tromagnetic Phenomena Associated with Earthquakes, TERRAPUB, Tokyo, 287-305.
[10] Teisseyre, R. and Nagahama, H. (1999) Dislocational models of electric field generation in a seismic source zone. In: Hayakawa, M., Ed., Atmospheric and Ionosphe- ric Electromagnetic Phenomena Associated with Earth- quakes, TERRAPUB, Tokyo, 271-285.
[11] Feng, R., Hao, J. and Zhou, J. (2002) Resistivity tomo- graphy: Observation and earthquakes monitoring. In: Hayakawa, M. and Molchanov, O.A., Eds., Seismo Elec- tromagnetics: Lithosphere-Atmosphere-Ionosphere Cou- pling, TERRAPUB, Tokyo, 91-97.
[12] Molchanov, O.A., Hayakawa, M., Afonin, V.V., Akenti- eva, O.A. and Mareev, E.A. (2002) Possible influence of seismicity by gravity waves on ionospheric equatorial anomaly from data of IK-24 satellite 1. Search for idea of seismo-ionosphere coupling. In: Hayakawa, M. and Mol- chanov, O.A., Eds., Seismo Electromagnetics: Lithosphere- Atmosphere-Ionosphere Coupling, TERRAPUB, Tokyo, 275-285.
In: Hayakawa, M. and Molchanov, O.A., Eds., Seismo Elec- tromagnetics: Lithosphere-Atmosphere-Ionosphere Coupl- ing, TERRAPUB, Tokyo, 173-176.
[14] Pulinets, S. and Ouzounov, D. (2011) Lithosphere-At- mosphere-Ionosphere Coupling (LAIC) model—An uni- fied concept for earthquake precursors validation. Journal of Asian Earth Sciences, 41, 371-382.
doi:10.1016/j.jseaes.2010.03.005
[15] Moskovskaya, L.F. (2000) Filtering transient fields on the basis of robust estimation, Russian Geophysical Journal, SPb, 19-20, 71-78.
[16] Moskovskaya, L.F. (2003) Preprocessing measurements transient electromagnetic fields with a high space-time density on the example of marine electrical soundings,
geophysics. Moscow, EAGO, 4, 25-29.
[17] Zhdanov, M.S. (2002) Geophysical inverse theory and regularization problems. University of Utah, Salt Lake City.
[18] Nishida, A. (1978) Geomagnetical diagnosis of magneto- sphere. Springer-Verlag, Berlin, Heidelberg, New York.
doi:10.1007/978-3-642-86825-2
[19] Zhdanov, M.S. (1986) Elektrorazvedka (electrical pros- pecting). Nedra, Moscow City.