Variance ratios, structural breaks and
nonrandom walk behaviour in the Indian
stock returns
Hiremath, Gourishankar S and Bandi, Kamaiah
Indian Institute of Technology Jodhpur, University of Hyderabad,
Hyderabad
2012
Online at
https://mpra.ub.uni-muenchen.de/48710/
1
Variance Ratios, Structural Breaks and Non-Random Walk Behaviour in the Indian Stock Returns
Gourishankar S. Hiremath,
Assistant Professor,
Indian Institute of Technology Jodhpur, Jodhpur – 342 011. India
Bandi Kamaiah,
Professor,
Department of Economics, University of Hyderabad, Hyderabad – 500 046. India
Abstract
The paper investigates the issue of behaviour of stock returns in India. A non-parametric variance ratio test is used to examine the issue. Largely the results indicate non-random walk behaviour of Indian stock market. However, the sub-sample analysis of stock returns based on structural breaks show an increasing mean-reverting tendency after occurrence of structural breaks in the series. The events associated with break dates mainly are volatile exchange rate movements, oil shocks, internet bubble burst, sub-prime crisis, global economic meltdown and political uncertainties. Rejection of random walk is relatively stronger for smaller and medium indices than larger indices implying that market capitalization and liquidity play a greater role in improving efficiency of the market.
JEL Code: G14, C 14, C58.
Key words: Variance ratio, random walk, market efficiency, mean-reversion, BSE, NSE, Indian stock market.
Acknowledgement:
2
Variance Ratios, Structural Breaks and Non-Random Walk Behaviour in Indian Stock Returns
1. Introduction
Market efficiency has been a focal point of research in finance literature. An efficient
equity market plays a vital role in the economy. In the absence of an efficient market, allocation
of capital would not be according to the demand of the economy and consequently economic
growth would be retarded. A market is said to be efficient if it is informationally efficient. In an
informationally efficient market, current prices reflect all the available and relevant information
(Fama, 1970). Such markets do not provide consistent abnormal returns. This is known as the
Efficient Market Hypothesis (EMH), which is quite prominent in neoclassical finance literature.
The weak form of the EMH suggests that the future returns cannot be predicted based on the past
history of the stock returns. The random walk hypothesis (RWH) has been one of the important
and effective models employed to examine the behaviour of stock returns in the empirical
research. Let
. . . (1)
where is stock returns at time t , is stock returns at time t-1, δ is the drift parameter (or
expected change in the return), is error term. The stochastic variable of stock returns is
said to be random walk, with a drift parameter δ, if
. . . (2)
where white noise term, is independent and identically distributed with mean zero and
constant variance . Thus the value of at time t is equal to its value at time t-1 plus a
3
noise process. However, this definition practically less useful as its rejection does not tell
anything about predictability of returns (Taylore, 2005). Hence, a martingale difference sequence
is sufficient to say that market is efficient. is a martingale if
. . . (3)
Thus, returns follow a martingale difference sequence (mds) if drift is zero and error term
uncorrelated. Based on the past history of returns, tomorrow’s returns cannot be predictable as it
is expected to be equal to the today’s return. In short, it is not possible to ‘beat the market’.
In this backdrop, present paper examines the behaviour of stock returns in the Indian
equity market during the period June, 1997 to March, 2009. The present study differs from the
earlier studies on the following lines. First, the study makes use of new, diverse and larger data
set on India. Second, it employs non-parametric test proposed by Wright (2000). The test is
preferable to traditional Lo and MacKinlay (1988) variance ratio test when returns are
non-normal. To best of our knowledge, the existing studies in India have not applied this test. Most
of the previous studies focused on BSE Sensex Index and stocks constituting Sensex, with the
notion that rest of the Indian market follows BSE Sensex. In the last decade, NSE emerged as
the leading stock exchange in India with 90 per cent of market capitalization. The present study,
hence, covers two major exchanges in India namely, Bombay Stock Exchange (BSE) and
National Stock Exchange of India (NSE). The results of the study are therefore robust.
The rest of the paper is organized as follows: A brief review of previous studies is
presented in section 2 and section 3 describes data and testing methods. The empirical
4
2. Brief Review of Previous Studies
Literature on EMH has been truly abundant. Here an attempt is made to present a brief
review of previous work. Bachelier (1900) is perhaps the first who theorized the concept of
market efficiency. The seminal works of Samuelson (1965) and Fama (1965, 1970) triggered
much interest in this area. The early studies have found evidences in favour of RWH [Fama,
1965, 1970; Working, 1960; Niederhoffer and Osborne, 1966; Jennergeen and Korsvold 1974;
Solnik, 1973]. In later period, however, studies have found mean reversion and anomalies [Keim
and Stambaugh, 1986; Fama and French, 1988; Jagadeesh, 1990; Frennberg and Hansson, 1993].
The early studies on market efficiency used serial correlation, runs and spectral tests to
examine the issue of random walk. The conventional techniques such as serial correlation seem
to suffer from restrictive assumptions. They tend to be less efficient to capture the patterns in
returns. Lo and MacKinlay (1988) proposed a variance ratio test which is capable of
distinguishing among several interesting and competing alternative hypotheses. The test is robust
to heteroscedasticity. In their study of weekly stock returns, Lo and MacKinay (1988) rejected
the earlier evidences of random walk characterization of the stock returns in the US. The
variance ratio test proposed by Lo and MacKinlay (1988) (LMVR) is one of the most popular
tests in empirical literature as numerous studies employed it [Ojah and Karemera, 1999; Grieb
and Reyes, 1999; Darrat and Zhong, 2000; Dias et al, 2002; Al-Khazali et al, 2007, Eitelman and
Vitanza, 2008; Fifield and Jetty, 2009 among others].
The sampling distribution of LMVR test is approximated based on its limiting
distribution and therefore is biased and right-skewed in finite samples (Wright 2000, Charles and
Darne, 2008), For mean-reverting alternatives, the LMVR test is found to be inconsistent (Deo
5
the test assumes that returns are normally distributed which of late, is quite uncommon in case of
financial returns.
An alternative variance ratio test using ranks and signs has been proposed by Wright
(2000). The test has better power properties than the LMVR test. The subsequent studies have
used the Wright’s (2000) ranks and signs variance ratio test (WRSVR) to examine the issue of
weak form of market efficiency. Ma and Barnes (2001) performed this test on Shenzhen and
Shanghai stock exchanges in China and found that individual shares were more efficient than
indices. Buguk and Brorsen (2003) reported inconsistent results for different k values (holding
periods) for Istanbul stock exchange (Turkey). Using WRSVR test, Belaire-Franch and Opong
(2005) attempted to present some evidence on anomalies. The study refuted RWH for FTSE
100, FTSE 250, FTSE 350 and FTSE All Shares. However, they pointed that the rejection of
RWH for indices having higher market capitalization and liquidity was relatively less than their
lower counterparts. This view was further supported by Hung et al (2009) who carried out the
WRSVR test to check the behavior of TOPIX and FTSE returns.
In a similar fashion, Segot and Lucey (2005) assessed market efficiency of Middle East
and North African (MENA) markets1. It was observed that small markets such as Tunisia and
Jordon empirically proved to be inefficient whereas Israel and Turkey were weak form efficient.
In a reply to this, Al-Khazali et al (2007) empirically showed that the MENA markets (Bahrain,
Egypt, Jordon, Kuwait, Morocco, Oman, Saudi Arabia and Tunisia) were weak form efficient.
The earlier rejection of weak form efficiency, the study argues, has been because of thin and
infrequent trading. The study applied WRSVR test after correcting for thin and infrequent
trading and found that the MENA markets were weak form efficient. This view has drawn
1
6
further support from the study of Hoque et al (2007) which concluded that thin trading has been
one of the important factors responsible for the rejection of RWH in the emerging markets.
Further, Hoque et al (2007) pointed out that information asymmetry and lack of well developed
financial institutions were the other reasons for such a rejection. Based on WRSVR test results,
the study concluded that astute investors could exploit the emerging markets as their stock
returns are inter-temporally predictable. The stock exchanges of Barbados, Jamaica, Trinidad and
Tobago and CARICOM Regional exchanges were also found to be inefficient (Watson, 2009)2.
For Chinese markets, studies by Fifield and Jetty (2008), and Zhang and Xindan (2008),
and Hung (2009) documented that Chinese Share A was relatively more efficient than Share B.
However, these studies also noted that the efficiency improved for both the shares due to
deregulation, liberalization and the improved liquidity. The hypothesis that liquidity improves
market efficiency found further empirical support from Hung et al (2009).
The evidences from the WRSVR test show that various markets do not follow random
walk (or martingale process). Though there is a large volume of research on the issue of weak
form of efficiency, but the studies on Indian stock markets are limited. The quest for study of
stock market efficiency in India began with early work of Rao and Mukherjee (1971). Later, in a
comparative study between BSE and NYSE, Sharma and Kennedy (1977) by using runs test and
spectral technique found that monthly returns in the BSE followed RWH. Similar evidences of
random walk behaviour for stock returns were also noted by Barua (1981), Gupta (1985) and
Chawla et al (2006)3. Furthermore, Amanulla and Kamaiah (1998) examined the behavior of
stock returns in India. In addition to serial correlation and rank correlation tests, they used
2
CARICOM is a Caribbean Community and Common Market consisting 14 countries.
3
7
ARIMA (0, 1, 0) model to examine distribution pattern of increments which received less focus
on weak form efficiency studies in India. They concluded that equity market in India was weak
form efficient. Hiremath et al (2009) used LMVR test to understand the behavior of stock
returns and found mixed evidence for the Indian equity market.
Although, the literature on market efficiency is vast, there is no consensus among the
researchers regarding efficiency of the market. Most of the studies focused on well developed
markets and a limited number of studies addressed the issue in the emerging markets. Thin
trading or non-synchronous trading, various restrictions and incomplete reforms are cited as
important factors for the rejection of random walk characterization of the returns in the emerging
markets.
3.1 Data
The present study uses daily stock returns of six indices from BSE and eight indices from
NSE. The data span from June 1997- March 2009 and the data range is different for different
indices. (See table 1). The BSE Sensex accounts for 46 per cent of total market capitalization and
represents large and financially sound 30 companies. BSE 100 is made up of 100 companies
based on market capitalization and BSE 500 covers all 20 industries of the economy. The BSE
Midcap and BSE Small cap represent medium and small stock indices. Similarly, CNX Nifty
represents most liquid 50 stocks traded at NSE and it accounts for 65 percent of market
capitalization. The CNX Nifty Junior consists of next 50 liquid stocks. CNX 100 is a diversified
100 stock index accounting for 35 sectors of the economy and CNX 500 equity index is
disaggregated into 72 industry sectors. Further, CNX Defty is nothing but CNX Nifty, measured
in dollars. Considering the importance of Information Technology (IT), Banking, and
8
Nifty and CNX Infrastructure are considered. Companies that have more than 50 percent of their
turnover from IT related activities are included in CNX IT while CNX Bank Nifty is an index
comprised of the most liquid 12 Indian Banking stocks. CNX Infrastructure Index includes
companies belonging to Telecom, Power, Port, Air, Roads, Railways, shipping and other Utility
Services providers. The set of indexes serve the purpose of unmasking variation in the behaviour
of stock returns of different indices and reveal sensitiveness of results to the composition of
indices. The daily values of indices are collected from official websites namely,
www.bseindia.com and www.nseindia.com of BSE and NSE respectively.
Table 1: Sample Indexes – Time Period Covered
S.No Index Time Period % of Total Market Capitalization
1 BSE Sensex 01/01/1998 – 31/03/2009 46.53
9
3 BSE 200 01/01/1998 – 31/03/2009 85.24
4 BSE 500 03/01/2000 – 31/03/2009 93.51
5 BSE Midcap 01/01/2004 – 31/03/2009 12.8
6 BSE Smallcap 01/01/2004 – 31/03/2009 3.7
7 CNX Nifty 02/06/1997 – 31/03/2009 65.34
8 CNX Junior 02/06/1997 – 31/03/2009 9.89
9 CNX Defty 02/06/1997 – 31/03/2009
10 CNX 100 01/01/2003 – 31/03/2009 75.24
11 CNX 500 07/06/1999 – 31/03/2009 95.11
12 CNX IT 02/06/1997 – 31/03/2009 6.97
13 CNX Bank Nifty 01/01/2000 – 31/03/2009 7.74
14 CNX Infrastructure 01/01/2004 – 31/03/2009 21.43
3. 2. Ranks and Signs Variance Ratio Test
Wright (2000) proposes ranks (R1 and R2) and signs (S1 and S2) based variance ratio test.
He demonstrates that the non-parametric test has better power properties than conventional
variance ratio test. Let r (yt) be the rank of ytamong y1. . . yT. Define,
. . . (4)
Under the null hypothesis that ytis generated from i.i.d sequence, r (yt) is random permutation of
the numbers 1 . . ., T with equal probability. Wright (2000) proposes the statistics
. . . (5)
which follows an exact sampling distribution. Further, he proposes use of an alternative
10
. . . (6)
where Φ is the standard normal cumulative distribution function. This gives rise to the R2
statistics as given in equation (7):
. . . (7)
The R2 test shares the same sampling distribution as R1. The critical values of these tests can be
obtained by simulating their exact distributions. In a similar fashion, a signs based variance ratio
test is given in equation (8):
. . . (8)
Under the null hypothesis, yt is a martingale difference sequence (mds) whose unconditional
mean is zero, St is an i.i.d sequence with mean zero constant variance equal to 1, which takes the
value of 1 and -1 with equal probability of ½. Thus, S1 assumes a zero drift value.
4. Empirical Analysis
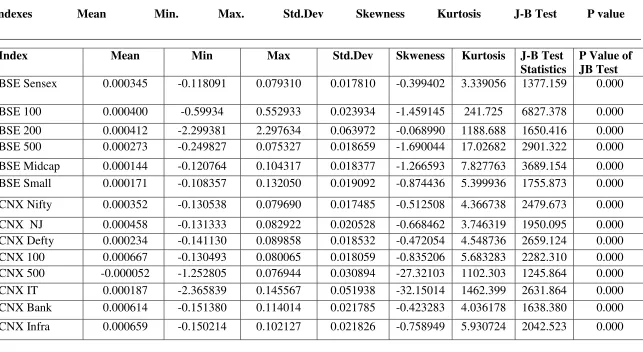
The descriptive statistics for the fourteen indices are given in table 2. The highest average
returns are obtained in CNX 100. The CNX Infrastructure and CNX Bank Nifty are the other
11
the considerable growth of infrastructure sector in India because of the significant increase in the
government outlay along with encouraging private investment. However, the CNX 500
registered negative mean returns. This may be attributed to the small stocks which constitute the
index from wide range of industries where the output growth has remained below for a decade.
Further, the BSE 200 has the highest standard deviation (0.0639) which represents higher
volatility and lowest is of CNX Nifty (0.0174) and the BSE Sensex (0.0178). The returns of all
indices are negatively skewed implying that the returns are flatter to the left compared to the
normal distribution. The significant kurtosis indicates that return distribution has sharp peaks
compared to a normal distribution. The significant Jarque-Bera statistic confirmed that index
returns are non- normally distributed. This suggests that a non-parametric test like Wright (2000)
is more appropriate.
The RWH is based on the premise that returns are unpredictable and it is not possible to
earn abnormal profits. Rejection of RWH indicates possibility of predictable returns on past
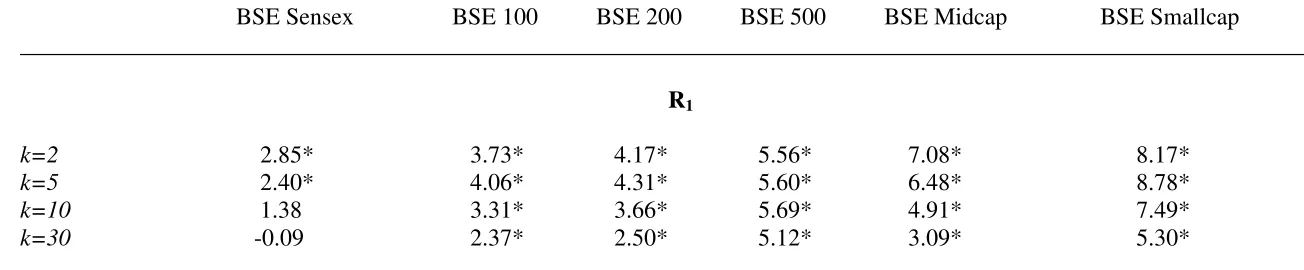
memory. The RWH or mds is tested in this paper by using the WRSVR test. Table 3A and 3B
report test statistics, R1, R2 and S1 at different k values namely, 2, 5, 10 and 30 for BSE and NSE
respectively. The R1 and R2 tests possess better power properties than the conventional M1 and
M2 of LMVR test. The tables report only S1 as it is shown by Wright (2000) that, if S1 rejects the
null, S2 must reject as well.
It is evident from table 3A that with the exception of BSE Sensex, the RWH is clearly
rejected by all other indices namely, BSE 100, BSE 200, BSE 500, BSE Midcap and BSE
Smallcap. This suggests that the stock returns are not generated by random walk process. The R1
test statistics for BSE Sensex at k = 2 and 5, and R2 statistics at k = 1, are significant and thus
12
period) increases. The iid assumption can be relaxed as it is difficult to find the iid because of
regulatory and structural changes in the market over a period of years. Therefore, the non
rejection of mds is sufficient to say market is weak form efficient.
Besides, R1 and R2 tests are not robust to heteroscedasticity. The results of S1 test which is
robust to heteroscedasticity are given in the last panel of table 3A. The statistics clearly rejects
the null of mds for all the BSE indices. However, similar to R1 and R2 test statistics given in the
table, the S1 statistics for BSE Sensex become weaker as the holding horizon increases. This
suggests that BSE Sensex may be moving towards weak form efficiency at the longer holding
periods. It may be because of the existence of abnormal profits in short horizons which
disappear in longer horizons as the information begins to reflect in the current returns.
Furthermore, it can be inferred from table 3A that indices having lower market
capitalization and liquidity such as BSE Smallcap and BSE Midcap show stronger rejection of
RWH than the relatively higher market capitalized indices such as BSE 100, BSE 200 and BSE
500. The results are consistent with the findings of Belaire-Franch and Opong (2005) and Hung
et al (2009).
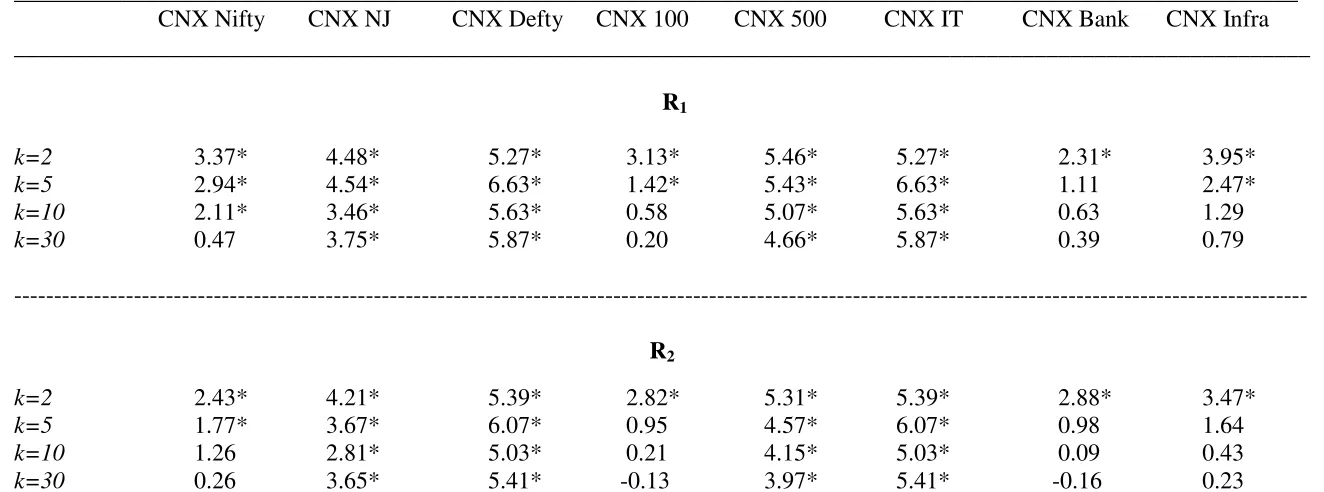
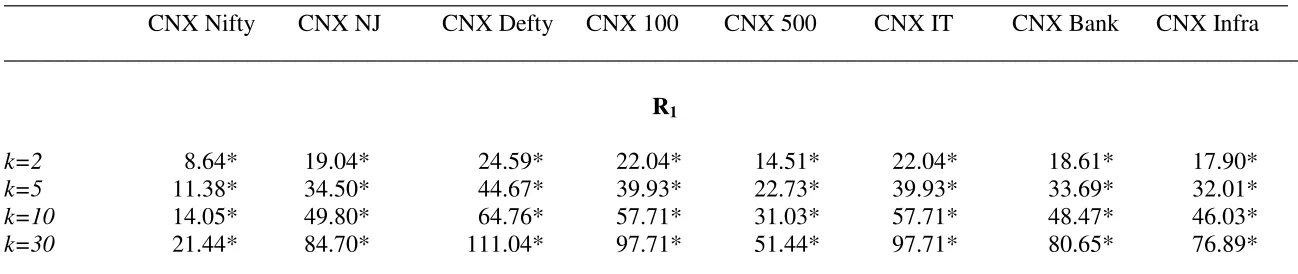
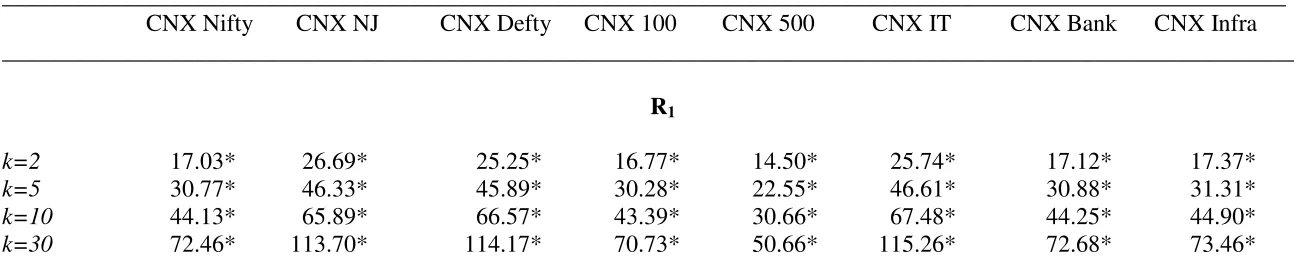
The test statistics (R1, R2 and S1) for the NSE are furnished in table 3B. The results
consistently support rejection of the null of iid for CNX Nifty Junior, CNX Defty, CNX 500,
CNX IT. The evidences for CNX Nifty, CNX 100 and CNX Infrastructure are not consistent. It
can be seen from the table that the R1 and R2 test statistics reject the null of RWH at short
horizons and as k values increase, rejection increasingly becomes weak. It is to be noted that the
13
consistently significant reject the null of mds for all the indices indicating that returns are
unpredictable based on the past memory of the returns.
Broadly, it is observed that evidences against RWH for CNX Nifty and CNX 100 for
longer horizons (k = 30) are weaker than for short holding periods (k = 5, 10). However, in the
presence of significant S1 statistics, these indices are not weak form efficient. Largely, stock
returns of the indices traded at NSE exhibit non-random behaviour and thus provide space for
speculation and resulting excess returns. The results for CNX Bank Nifty suggest that the stock
returns do follow random walk at all holding periods as the test statistics cannot reject the null of
iid (or mds).
The behaviour of stock returns of BSE and NSE largely do not follow random walk (or
martingale). The possible explanation for the stock returns of the BSE Sensex, and to some
extent CNX Nifty and CNX 100 appear to follow random walk at longer horizons, is that the
information in short-horizon is not instantly reflected in returns and thus provide opportunity for
excess returns to those who have access to such unrevealed information. Later, as time horizon
increases, information begins to get reflected in the returns leading market towards the
efficiency.
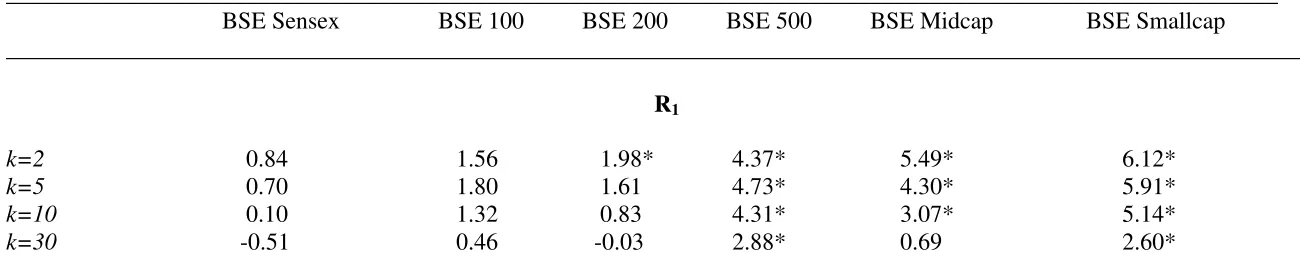
Structural breaks occurring due to financial and economic events may have bearing on
the variance ratios. To examine such possibilities, multiple breaks test proposed by Lee and
Strazicich (2003) is employed to identify breaks in the series. The test found significant breaks in
the returns series. However, the break dates were different for different indices. The whole
sample is divided into three sub-sample periods based on the break dates. Period 1 consists of
14
second break is considered as Period 2 and the post second break period is named as Period 3. 4
Then, WRSVR test is carried out on three different sample periods. The test statistics for Period
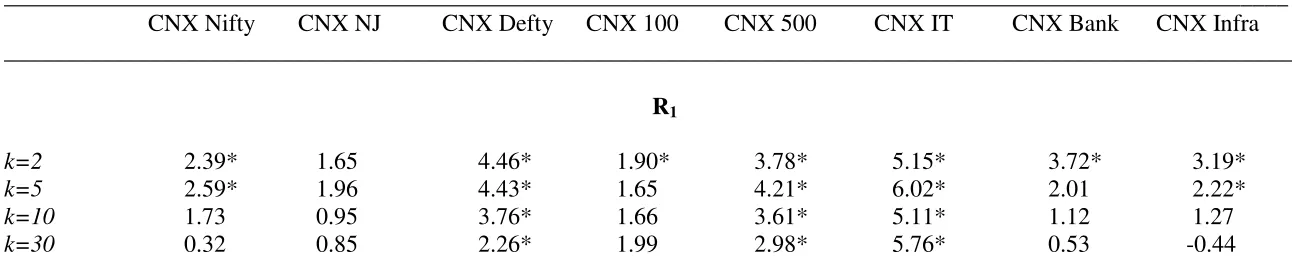
1 are furnished in table 4A and 4B for BSE and NSE respectively. The results (R1, R2 and S1)
given in table 4A for BSE Sensex, BSE 100 and BSE 200 are insignificant across the holding
periods. It is to be noted that for the full sample, null of iid and mds were rejected for these
indices. Rest of the indices from BSE in period 1 rejected the null of random walk as in case of
full sample period. However, the test statistics are less strong for these indices compared to
those reported for the full sample period furnished in table 3A. The RWH and mds for indices
namely, CNX Defty, CNX 500, CNX Infrastructure is rejected at most of the holding periods
(see table 4B). This is true even in case of full sample period. Similar to BSE indices, the
statistics are less significant during period 1 compared to the full sample period. For other
indices namely CNX Nifty, CNX NJ, CNX Bank the RWH and mds cannot be rejected as the
statistics are weak and insignificant. CNX 100 though cannot reject null of iid but still not
support weak form of EMH as S1 test rejects the null of mds. It is to be noted that evidences
against weak form of efficiency for period 1 are either weak or insignificant. In case of rejection
of null of random walk, the statistics are relatively less significant during period 1 where no
structural breaks occurred, than during the full sample period.
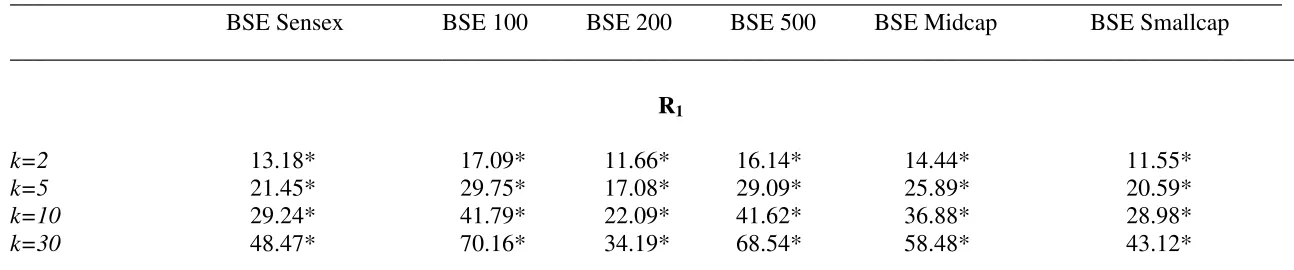
Further, table 5A and 5B report test statistics of BSE and NSE for the Period 2, which
consist sample from first break date to the second break. It is evident from both the tables that
test statistics are highly significant. The values of test statistics are higher than the statistics
reported for the period 1. It can be inferred that during period 2, the stock returns exhibited a
non-random walk behavior. The values of S1 are less compared to R1 and R2 but still greater
4
15
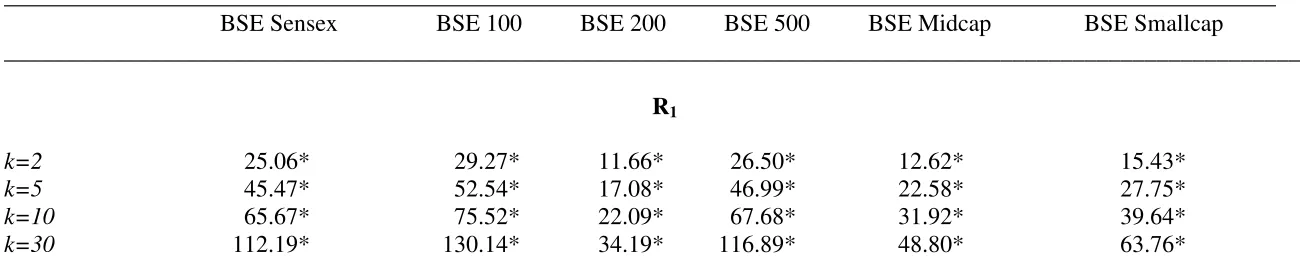
than statistics reported for period 1. Finally, test statistics for period 3 are reported in table 6A
and 6B for BSE and NSE respectively. The test statistics show higher significance than those
reported for period 2. Nevertheless, evidence supports martingale process for BSE Sensex. This
indicates that after the second break, there was a stronger tendency in stock returns of all indices
to revert to its trend path. The results for different sub-periods indicate different kinds of
behavior of the stock returns in India. A random walk behavior is observed before occurrence of
structural breaks in the series. But, a non-random walk behavior is observed in the post
structural breaks period. It implies that Indian stock market is not weak form efficient for the
whole period and sensitive to the external shocks.
As mentioned earlier, Lee-Strazicich test results show break dates for various indices are
different. Most of the break dates appears to have occurred during 2000-03 and 2006-08. The
first break point for CNX Nifty, CNX Nifty Junior, BSE Sensex, BSE 100, BSE, 200, CNX 500
falls in between 1999 and 2001. This was a period of global economic recession originated in the
US, dot-com bubble burst and Air India hijack followed by war hysteria between India and
Pakistan. It may also be noted that in March 2000, the government notified to remove the ban on
future trading to pave the way for derivative trading in India. The sluggishness in foreign
institutional investors (FIIs), slip in consumer spending and bad monsoon during 2003 made the
market to move in a narrow range. This is the year when the first break point for CNX Defty,
BSE 500, CNX 100, detected. The rise in international oil prices during March-May, 2003 is one
of the possible factors for the break in these indices. The first structural break for BSE Midcap
and BSE Smallcap occurred in 2007 is associated with notorious sub-prime mortgage crisis.
The second structural break point identified by Lee-Strazicich test for BSE 100 and BSE
16
There was sustained pull out of FIIs from the market and unprecedented slide of rupee in
2006.The second break points for CNX Defty, CNX IT, and BSE Sensex occurred during this
year. The second break occurred in case of most indices such as CNX Nifty, BSE 200, CNX
Bank Nifty, CNX 100, CNX Infrastructure, BSE Midcap and BSE Smallcap during 2008. This is
the period of global meltdown triggered by sub-prime crisis, which spread to financial sector and
resulted in economic crisis. It is to be noted here that in late 2007, Securities and Exchange
Board of India (SEBI) announced ban on P-Notes meant for FIIs. The BSE Midcap, BSE
Smallcap, CNX Infrastructure, CNX Bank Nifty were more vulnerable to financial crisis and
market meltdown as they have low capitalization and compress less liquid stocks than other
indices
The WRSVR test results clearly rejected null of RWH and mds for most of the indices
from BSE and NSE for the full sample period. It indicates mean reverting behavior of stock
returns in Indian equity market. However, mean-reverting tendency in stock returns is not
observed throughout the sample period. The period 1 has shown weaker evidences against weak
form efficiency. The results suggest that stock returns exhibited stronger non-random walk
behavior during the period in which structural breaks occurred majorly due to external events.
The mean-reverting tendency in stock returns indicates possibility of predictability of stock
returns. It is to be noted that indices such as BSE Sensex, BSE 100, BSE 200, CNX Nifty, CNX
Nifty Junior which are having higher market capitalization exhibited weak evidences against
random walk than smaller indices such as BSE Midcap, BSE Smallcap, CNX Infrastructure etc
which provided strong evidences against random walk. However, it is to be noted that these
indices do not support the martingale process and thus are not weak form efficient.
17
The present paper examines the behaviour of daily stock returns in two premier stock
exchanges in India namely, BSE and NSE by using an alternative variance ratio test based on
ranks and signs proposed by Wright (2000). The test is known to be having better power
properties than the conventional variance ratios test. As the stock returns are non-normal, such a
non-parametric test is more appropriate. The results of the study broadly indicate that the stock
returns of different indices in both exchanges exhibit non-random walk behaviour. However,
evidences against null of random walk for BSE Sensex are weaker at longer holding period.
This can be attributed to the existence of excess returns in short period and as information begins
to reflect in returns, these profits disappear. Similar observations are made for CNX Nifty and
CNX 100. Although the results of the study indicate non-random walk behaviour of stock
returns in India for the whole period, the sub-sample analysis of stock returns shows that
structural breaks identified by Lee and Strazicich (2003) test have bearing on variance ratios.
The events associated with the significant dates were identified as turmoil in the international oil
prices, bubble burst, terrorist attack on World Trade Centre, Air India hijack followed by war
hysteria between India and Pakistan, slip in consumer spending due to bad monsoon during
2003, highly volatility exchange rates, sub-prime crisis and collapse of large investments banks
in the US followed by massive outflow of FIIs, and global economic recession of 2008. An
increasing mean-reverting tendency is observed in stock returns after structural breaks occurred
in the economy. It implies that the Indian stock market is sensitive to the shocks especially
because of external events. Rejection of random walk is relatively stronger for smaller and
medium indices than larger indices. This is because of the fact that the medium and small sized
indices are having lower market capitalization and are less liquid. This inference is consistent
18
Infrastructure are found to be against EMH. However, CNX Bank Nifty appears to follow
random walk (or mds). It may be because of the fact that the CNX Bank Index is an index
comprised of the most liquid and large capitalized Indian Banking stocks and the sector is
dominated by public sector banks and appropriately regulated by Reserve Bank of India (RBI).
Non-random walk behaviour of stock returns and vulnerability of stock market to the shock in
19
Table 2: Descriptive Statistics for Stock Index Returns
____________________________________________________________________________________________________________
Indexes Mean Min. Max. Std.Dev Skewness Kurtosis J-B Test P value
____________________________________________________________________________________________________________
Index Mean Min Max Std.Dev Skweness Kurtosis J-B Test Statistics
P Value of JB Test
BSE Sensex 0.000345 -0.118091 0.079310 0.017810 -0.399402 3.339056 1377.159 0.000
BSE 100 0.000400 -0.59934 0.552933 0.023934 -1.459145 241.725 6827.378 0.000
BSE 200 0.000412 -2.299381 2.297634 0.063972 -0.068990 1188.688 1650.416 0.000 BSE 500 0.000273 -0.249827 0.075327 0.018659 -1.690044 17.02682 2901.322 0.000
BSE Midcap 0.000144 -0.120764 0.104317 0.018377 -1.266593 7.827763 3689.154 0.000 BSE Small 0.000171 -0.108357 0.132050 0.019092 -0.874436 5.399936 1755.873 0.000
CNX Nifty 0.000352 -0.130538 0.079690 0.017485 -0.512508 4.366738 2479.673 0.000
CNX NJ 0.000458 -0.131333 0.082922 0.020528 -0.668462 3.746319 1950.095 0.000 CNX Defty 0.000234 -0.141130 0.089858 0.018532 -0.472054 4.548736 2659.124 0.000 CNX 100 0.000667 -0.130493 0.080065 0.018059 -0.835206 5.683283 2282.310 0.000 CNX 500 -0.000052 -1.252805 0.076944 0.030894 -27.32103 1102.303 1245.864 0.000 CNX IT 0.000187 -2.365839 0.145567 0.051938 -32.15014 1462.399 2631.864 0.000 CNX Bank 0.000614 -0.151380 0.114014 0.021785 -0.423283 4.036178 1638.380 0.000
CNX Infra 0.000659 -0.150214 0.102127 0.021826 -0.758949 5.930724 2042.523 0.000
____________________________________________________________________________________________________________
20
Table 3A: Wright (2000) Ranks and Signs Variance Ratio Tests for Bombay Stock Exchange (BSE)
__________________________________________________________________________________________________________ BSE Sensex BSE 100 BSE 200 BSE 500 BSE Midcap BSE Smallcap
____________________________________________________________________________________________________________
R1
k=2 2.85* 3.73* 4.17* 5.56* 7.08* 8.17*
k=5 2.40* 4.06* 4.31* 5.60* 6.48* 8.78*
k=10 1.38 3.31* 3.66* 5.69* 4.91* 7.49*
k=30 -0.09 2.37* 2.50* 5.12* 3.09* 5.30*
---
R2
k=2 2.06* 2.84* 3.35* 5.03* 6.73* 8.23*
k=5 1.60 2.92* 3.16* 4.37* 5.62* 8.19*
k=10 0.85 2.35* 2.66* 4.29* 3.72* 6.33*
k=30 -0.15 2.06* 2.16* 4.30* 2.12* 3.98*
---
S1
k=2 2.54* 3.35* 3.70* 5.60* 6.88* 7.34*
k=5 2.10* 3.41* 3.89* 5.35* 7.80* 8.96*
k=10 1.21 2.75* 2.88* 4.94* 8.46* 9.57*
k=30 -0.19 1.79* 1.86* 4.73* 10.29* 12.01*
___________________________________________________________________________________________________________
21
Table 3B: Wright (2000) Ranks and Signs Variance Ratio Test Results for National Stock Exchange (NSE)
___________________________________________________________________________________________________________ CNX Nifty CNX NJ CNX Defty CNX 100 CNX 500 CNX IT CNX Bank CNX Infra ____________________________________________________________________________________________________________
R1
k=2 3.37* 4.48* 5.27* 3.13* 5.46* 5.27* 2.31* 3.95*
k=5 2.94* 4.54* 6.63* 1.42* 5.43* 6.63* 1.11 2.47*
k=10 2.11* 3.46* 5.63* 0.58 5.07* 5.63* 0.63 1.29
k=30 0.47 3.75* 5.87* 0.20 4.66* 5.87* 0.39 0.79
---
R2
k=2 2.43* 4.21* 5.39* 2.82* 5.31* 5.39* 2.88* 3.47*
k=5 1.77* 3.67* 6.07* 0.95 4.57* 6.07* 0.98 1.64
k=10 1.26 2.81* 5.03* 0.21 4.15* 5.03* 0.09 0.43
k=30 0.26 3.65* 5.41* -0.13 3.97* 5.41* -0.16 0.23
---
S1
k=2 3.18* 4.28* 2.14* 3.76* 5.55* 2.14* 0.58 3.87*
k=5 3.24* 4.67* 3.85* 3.09* 5.60* 3.85* 0.37 4.44*
k=10 2.12* 3.67* 3.29* 4.03* 5.35* 3.29* 0.48 4.22*
k=30 -0.08 3.12* 4.41* 6.22* 6.23* 4.41* 0.80 5.78* ____________________________________________________________________________________________________________
22
Table 4A: Wright (2000) Ranks and Signs Variance Ratio Tests for Bombay Stock Exchange (BSE) Period 1
__________________________________________________________________________________________________________ BSE Sensex BSE 100 BSE 200 BSE 500 BSE Midcap BSE Smallcap
____________________________________________________________________________________________________________
R1
k=2 0.84 1.56 1.98* 4.37* 5.49* 6.12*
k=5 0.70 1.80 1.61 4.73* 4.30* 5.91*
k=10 0.10 1.32 0.83 4.31* 3.07* 5.14*
k=30 -0.51 0.46 -0.03 2.88* 0.69 2.60*
---
R2
k=2 -0.12 0.47 0.95 3.87* 5.41* 6.43*
k=5 0.10 0.88 0.80 3.59* 3.60* 5.54*
k=10 -0.19 0.60 0.36 3.09* 2.16* 4.29*
k=30 -0.56 0.17 -0.16 2.16* 0.11 1.74
---
S1
k=2 0.34 1.57 1.81 4.73* 5.79* 6.14*
k=5 0.11 1.86* 1.31 4.30* 6.48* 7.12*
k=10 -0.90 1.42 0.14 3.15* 7.53* 7.59*
k=30 -1.05 0.90 -0.55 2.37* 9.51* 9.83*
23
Table 4B: Wright (2000) Ranks and Signs Variance Ratio Test Results for National Stock Exchange (NSE) Period 1
___________________________________________________________________________________________________________ CNX Nifty CNX NJ CNX Defty CNX 100 CNX 500 CNX IT CNX Bank CNX Infra ____________________________________________________________________________________________________________
R1
k=2 2.39* 1.65 4.46* 1.90* 3.78* 5.15* 3.72* 3.19*
k=5 2.59* 1.96 4.43* 1.65 4.21* 6.02* 2.01 2.22*
k=10 1.73 0.95 3.76* 1.66 3.61* 5.11* 1.12 1.27
k=30 0.32 0.85 2.26* 1.99 2.98* 5.76* 0.53 -0.44
---
R2
k=2 1.47 0.85 3.36* 1.65 4.00* 5.35 4.20* 3.16*
k=5 1.43 1.00 3.06* 1.42 3.99* 5.86 1.86 1.71
k=10 0.92 0.40 2.63* 1.40 3.17* 4.87 0.67 0.76
k=30 0.11 0.73 1.73 1.50 3.05* 5.59 0.15 -0.75
---
S1
k=2 2.80* 2.81* 5.28* 3.10* 2.79* 2.02 1.73 2.92*
k=5 2.94* 3.42* 4.99* 2.65* 3.33* 3.41 1.05 4.01*
k=10 1.50 2.04 3.71* 2.83* 3.14* 2.81 0.85 4.19*
k=30 -0.45 1.49 1.64 4.41* 2.88* 3.75 0.79 5.03* ____________________________________________________________________________________________________________
24
Table 5A: Wright (2000) Ranks and Signs Variance Ratio Tests for Bombay Stock Exchange (BSE) Period 2
__________________________________________________________________________________________________________ BSE Sensex BSE 100 BSE 200 BSE 500 BSE Midcap BSE Smallcap
____________________________________________________________________________________________________________
R1
k=2 13.18* 17.09* 11.66* 16.14* 14.44* 11.55*
k=5 21.45* 29.75* 17.08* 29.09* 25.89* 20.59*
k=10 29.24* 41.79* 22.09* 41.62* 36.88* 28.98*
k=30 48.47* 70.16* 34.19* 68.54* 58.48* 43.12*
---
R2
k=2 13.07* 15.60* 12.94* 14.87* 13.66* 11.09*
k=5 22.03* 27.21* 19.54* 26.73* 24.10* 19.55*
k=10 30.41* 38.28* 25.78* 38.10* 34.26* 27.53*
k=30 49.89* 63.83* 39.78* 63.08* 53.65* 40.61*
---
S1
k=2 3.57* 2.76* 5.81* 3.74* 3.45* 2.29*
k=5 3.04* 3.01* 5.79* 4.65* 3.21* 1.86
k=10 2.24* 2.30* 5.58* 3.89* 3.08* 1.44
k=30 1.42 1.70 6.36* 2.51* 3.11* 0.69
25
Table 5B: Wright (2000) Ranks and Signs Variance Ratio Test Results for National Stock Exchange (NSE) Period 2
___________________________________________________________________________________________________________ CNX Nifty CNX NJ CNX Defty CNX 100 CNX 500 CNX IT CNX Bank CNX Infra ____________________________________________________________________________________________________________
R1
k=2 8.64* 19.04* 24.59* 22.04* 14.51* 22.04* 18.61* 17.90*
k=5 11.38* 34.50* 44.67* 39.93* 22.73* 39.93* 33.69* 32.01*
k=10 14.05* 49.80* 64.76* 57.71* 31.03* 57.71* 48.47* 46.03*
k=30 21.44* 84.70* 111.04* 97.71* 51.44* 97.71* 80.65* 76.89*
---
R2
k=2 9.79* 16.47* 22.09* 20.33* 15.36* 20.33* 17.34* 16.06*
k=5 13.74* 29.98* 40.16* 36.76* 23.99* 36.76* 31.26* 28.34*
k=10 17.69* 43.28* 58.16* 53.08* 32.56* 53.08* 44.88* 40.63*
k=30 26.86* 73.35* 99.69* 89.93* 52.76* 89.93* 74.77* 66.71*
---
S1
k=2 4.99* 2.73* 2.77* 1.63 5.85* 1.63 -0.79 1.40
k=5 4.62* 3.04* 2.88* 2.16* 5.66* 2.16* -0.58 1.95*
k=10 3.84* 1.49 1.42 2.51* 5.82* 2.51* -0.50 1.93
k=30 3.03* 0.29 -0.54 3.74* 6.99* 3.74* 0.14 2.22 ____________________________________________________________________________________________________________
26
Table 6A: Wright (2000) Ranks and Signs Variance Ratio Tests for Bombay Stock Exchange (BSE) Period 3
__________________________________________________________________________________________________________ BSE Sensex BSE 100 BSE 200 BSE 500 BSE Midcap BSE Smallcap
____________________________________________________________________________________________________________
R1
k=2 25.06* 29.27* 11.66* 26.50* 12.62* 15.43*
k=5 45.47* 52.54* 17.08* 46.99* 22.58* 27.75*
k=10 65.67* 75.52* 22.09* 67.68* 31.92* 39.64*
k=30 112.19* 130.14* 34.19* 116.89* 48.80* 63.76*
---
R2
k=2 22.79* 25.77* 12.94* 23.74* 12.13* 14.57*
k=5 41.37* 45.98* 19.54* 41.42* 21.47* 25.90*
k=10 59.48* 65.77* 25.78* 59.27* 30.31* 36.88*
k=30 101.54* 112.44* 39.78* 101.40* 45.93* 58.54*
---
S1
k=2 0.96 4.33* 5.81* 5.54* 2.88* 2.85*
k=5 0.73 4.01* 5.79* 5.32* 2.05* 3.56*
k=10 -0.38 3.20* 5.58* 4.97* 1.65 4.00*
k=30 -0.76 2.84* 6.36* 4.52* 1.52 5.33*
27
Table 6B: Wright (2000) Ranks and Signs Variance Ratio Test Results for National Stock Exchange (NSE) Period 3
___________________________________________________________________________________________________________ CNX Nifty CNX NJ CNX Defty CNX 100 CNX 500 CNX IT CNX Bank CNX Infra ____________________________________________________________________________________________________________
R1
k=2 17.03* 26.69* 25.25* 16.77* 14.50* 25.74* 17.12* 17.37*
k=5 30.77* 46.33* 45.89* 30.28* 22.55* 46.61* 30.88* 31.31*
k=10 44.13* 65.89* 66.57* 43.39* 30.66* 67.48* 44.25* 44.90*
k=30 72.46* 113.70* 114.17* 70.73* 50.66* 115.26* 72.68* 73.46*
---
R2
k=2 16.36* 24.46* 23.16* 15.75* 15.46* 23.85* 16.26* 16.16*
k=5 29.51* 41.78* 42.12* 28.29* 23.92* 42.60* 29.02* 28.84*
k=10 42.29* 59.21* 61.09* 40.34* 32.51* 61.20* 41.35* 41.27*
k=30 69.56* 101.08* 104.83* 64.85* 52.76* 103.53* 67.77* 66.30*
---
S1
k=2 2.09* 5.40* 2.77* 3.32* 5.85* 2.91* -0.35 1.56
k=5 2.19* 5.24* 2.96* 2.85* 5.66* 4.19* -0.27 2.06*
k=10 0.92 4.24* 1.54 3.51* 5.82* 4.02* -0.12 2.18*
k=30 -0.34 4.18* -0.54 6.12* 6.99* 5.44* 0.40 1.95 ____________________________________________________________________________________________________________
28
References:
Al-Khazali O. M., Ding D. K. and Pyun C. S. 2007. A new variance ratio test of random walk in emerging markets: A revisit. The Financial Review 42: 303-317.
Amanulla S., Kamaiah B. 1996. Stock market efficiency: a review of Indian evidence. Prajnan
24(3): 257-280.
Amanulla S, Kamaiah B. 1998. Indian stock market: is it informationally efficient. Prajnan
26(4): 473-485.
Bachelier L. (1900). Theory of speculation. A Thesis submitted to the Faculty of the Academy of Paris on March 29, 1900, and also in P. H. Cootner (1964) (Eds). The Random walk character of stock market prices. MIT Press.
Barua S. K (1981). The short run price behaviour of securities: Some evidence on efficiency of Indian capital market. Vikalpa, 16: 93-100.
Belaire-Franch J, Opong K. K. 2005. A variance ratio test of behaviour of some FTSE equity indices using rank and sign. Review of Quantitative and Accounting Finance 24: 93-107.
Buguk C., and Brorsen B. W. 2003. Testing weak form efficiency: Evidence from Istanbul stock exchange. International Review of Financial Analysis 12: 579-590.
Charles A., and Darne O. 2008. The random walk hypothesis for Chinese stock markets: Evidence from variance ratio tests. Economic Systems 32(2):117-126.
Chawla, D., Mohanty, P. K., Bhardwaj S. 2006. Random walk hypothesis and integration among the Indian stock market vis-à-vis some developed markets. Prajnan 34(2): 113-127.
Darrat A. F., Zhong, A. M, 2000. On estimating the random walk hypothesis: a model comparison approach. The Financial Review 35: 105-124.
Deo, R. S., Richardson, M. 2003. On the asymptotic power of the variance ratio test.
Econometric Theory 19(2): 231–239.
Dias J. C., Lopes P., Martins V., Benzinho M. J. 2002. Efficiency tests in the Iberian stock markets. [Online] Available: SSRN: http://ssrn.com/abstract=599926
Eitelman P. S., Vitanz J. T. 2008. A non-random walk revisited: short and long term memory in asset prices. Working Paper 956, Washington, International Finance Discussion Papers, Federal
Reserve Board.
29
Fama E. F (1970). Efficient capital markets: A review of theory and empirical work. Journal of Finance 25: 383-417.
Fama E. F., French, K. R. 1988. Permanent and temporary components of stock prices. Journal of Political Economy 98l: 247-273.
Fifield S. G. M., Jetty, J. 2008. Further evidence on the efficiency of the Chinese stock markets: A note. Research in International Business and Finance 22: 351–361.
Frennberg, P., Hansson, B. 1993. Testing the random walk hypothesis on Swedish stock prices: 1919-1990. Journal of Banking and Finance 17: 175-191.
Greib, T., Reyes, M. G. 1999. Random walk tests for Latin American equity indices and individual firms. Journal of Financial Research, 4: 371-383.
Gupta, O. P 1985. Behaviour of share prices in India: A test of market efficiency. New Delhi: National Publishing House.
Hiremath, G. S, Sadat, A, Kamaiah, B. 2009. On the random walk characteristics of stock returns in India. Artha Vijnana , 51(1): 85-96.
Hoque, H. A. A. B., Kim, J. H., Pyun, C. S. 2007. A comparison of variance ratio tests of random walk: A case of Asian emerging stock markets. International Review of Economics and Finance,16: 488-502.
Hung, Jui-Cheng. 2009. Deregulation and liberalization of the Chinese stock market and the improvement of market efficiency. The Quantitative Review of Economics and Finance 49: 843-857.
Hung, Jui-Cheng, Lee, Y., Pai, T. 2009. Examining market efficiency for large and small-capitalization of TOPIX and FTSE stock indices. Applied Financial Economics, 19: 735-744.
Jagadeesh, N. 1990. Evidence of predictable behavior of security returns. The Journal of Finance, 45: 881-898.
Keim, D., Stambaugh, R. 1986. Predicting returns in stock and bond markets. Journal of Financial Economics 7: 357-390.
Lamonica, G. R. 2007. Random walk and weak efficiency: Evidence from the Italian stock market. Available:http://sis-statistics.it/files/pdf/atti/sis%20intermedio_.pdf
Lo A, MacKinlay, A. C. 1988. Stock market prices do not follow random walks: evidence from a simple specification test. Review of Financial Studies 1: 41-66.
Ma S., Barnes M. L. 2001. Are China’s stock markets really weak form efficient? Discussion Paper, 0119. Centre for International Economic Studies, University of Adelaide, Adelaide
30
Ojah K, Karemera D. 1999. Random walks and market efficiency tests of Latin American emerging equity markets: a revisit. The Financial Review 34: 57-72.
Rao K. N, Mukherjee K. 1971. Random walk hypothesis: An empirical study. Arthaniti 14: 53-58.
Samuelson P. 1965. Proof that properly anticipated prices fluctuate randomly. Industrial Management Review 1: 41-49.
Segot T. L., Lucey B. M. 2005. Stock market predictability in the MENA: Evidence from new variance ratio tests and technical trade analysis. Discussion Paper, 92. Institute for International Integration, Trinity College, Dublin.
Sharma J. L, Kennedy R. E. 1977. Comparative analysis of stock price behavior on the Bombay, London and New York stock exchanges. Journal of Financial and Quantitative Analysis 31: 391-413.
Taylor S. J. 2005. Asset price dynamics, volatility, and prediction. Princeton University Press, Princeton.
Watson PK. 2009. The efficiency of the stock market in the CARICOM sub-region: An empirical study. Working Paper, 12. Sir Arthur Lewis Institute of Social and Economic Studies, St. Augustine.
Working H. 1960. Note on the correlation of first differences of averages in a random chain.
Econometrica 28: 916-918.
Wright J. H. 2000. Alternative variance-ratio tests using ranks and signs, Journal of Business and Economic Statistics 18(1): 1-9.
Zhang B, Xindan L. 2008. A variance ratio test of the behaviour of Chinese stock indices.