© 2017, IRJET | Impact Factor value: 5.181 | ISO 9001:2008 Certified Journal
| Page
254
Low Cost Temperature Logging System using Raspberry Pi
S.Natarajan
1, A.Deepika
2, I.Pradeeba
3, R.Chandramohan
4*1
Resarch scholar, PG and Research Department of Physics, Sree Sevugan Annamalai College, Devakottai.
Tamilnadu.
2,3
MSc Student, PG and Research Department of Physics, Sree Sevugan Annamalai College,Devakottai. Tamilnadu
4*Associate Professor, PG and Research Department of Physics, Sree Sevugan Annamalai College,Devakottai,
Tamilnadu
---***---Abstract: All laboratories needs temperature measurement and monitoring system. Instead of noting down every reading using an analog device, the implementation of digital data logging is a better and in-situ way. The temperature data is read from the sensor and it is been logged into an Excel file. In our lab this setup provides very good alternative for existing analog thermometers. The Raspberry Pi Temperature sensor kit provides low cost, and consistent temperature measuring solution.
Key Words: Raspberry Pi, Temperature Logger, Low cost Temperature measuring system, Linux, Python, Ubuntu
1.INTRODUCTION
Measurement of temperature is existing from development of thermometers. Output of the thermometer is shown usually by calibrated reading marks. For laboratory level an issue is raised. In an experiment if we ought to measure the temperatures for a long period of time, the difficulty to record is raised. The temperature needs to be noted in every period of time, also the system is to be monitored for this entire period. Hence it is decided to construct a temperature logger as an alternative for existing setups. The aim of this study is to constructed a Temperature logger that is low cost, versatile, and that has consistent performance efficiency. In this paper we discussed about constructing temperature logger with Raspberry Pi. The Raspberry Pi models are capable of performing general-purpose computing and for that reason they are most favourite candidates for introducing learners to general computing and computer programming [1]. Ping, L et al.,[ 2] explained about the temperature test system designed by DS18B20. Shinde, P. A et al.,[3] discussed about implementation of DS18B20 in vehicle monitoring system using Raspberry Pi. Raspberry Pi can be used as an integrated system for any purpose of measurement [4, 5]. For this project we used Raspberry Pi 2 Model B[6], and DS18B20. For coding purposes we used Python programming language.
2. Components Needed
We implemented our experimental setup with the help of following components
Raspberry Pi 2 Model B
DS18B20
Ethernet cable
Breadboard
Connecting wires3. Experimental setup
A setup for measuring temperature is constructed using Raspberry pi. We have booted raspberry pi with Noobs [7] which contain Raspbian Jessie with Pixel[8] operating system.
A constant voltage is supplied to the micro USB port. The monitor is powered with external power supply. We are now able to access the entire system within this graphical user interface. We prefer to work in terminal. With in the terminal itself we can control the entire system ,also with the super user privileges. Super user access is gained with “sudo” comment[9]. With “sudo raspi-config” comment we enabled ssh[10] and I2C console.
© 2017, IRJET | Impact Factor value: 5.181 | ISO 9001:2008 Certified Journal
| Page
255
3.1 Connecting DS18B20-Temperature Sensor
The DS18B20 digital thermometer provides 9-bit to 12-bit Celsius temperature measurements and has an alarm function with nonvolatile user-programmable upper and lower trigger points. The DS18B20 communicates over a 1-Wire bus that by definition requires only one data line (and ground) for communication with a central microprocessor. In addition, the DS18B20 can derive power directly from the data line (“parasite power”), eliminating the need for an external power supply [2, 12]. It Measures Temperatures from -55°C to +125°C (-67°F to +257°F). It is having an accuracy of ±0.5°C from -10°C to +85°C. The DS18B20 temperature sensor is connected to the Raspberry pi system by the following schematic diagram.
Fig-1: DS18B20 Temperature sensor connected with Raspberry Pi
Fig.1 explains the instrumental setup of temperature logger. In DS18B20 Pin 1 is connected with Ground of Rpi. Pin 2 is connected with GPIO 4 and Pin 3 is connected with 3.3V. We introduced a 4.7 k Ω resistor in between 2 and 3 pins of DS18B20.
3.2 The software-python code
To interface the device DS18B20 to Raspberry Pi, to obtain the data and to display the results some piece of code is needed. We implemented python code for this purpose. Python is a simple and powerful language. Python is a popular object-oriented language used for both standalone programs and scripting applications in a variety of domains. We use python 2.7[13] for this project.
We have imported time, glob, and OS libraries.
import os
import glob
Import time
os.system('modprobe w1-gpio')
os.system('modprobe w1-therm')
base_dir = '/sys/bus/w1/devices/'
device_folder = glob.glob(base_dir + '28*')[0]
device_file = device_folder + '/w1_slave'
def read_temp_raw():
f = open(device_file, 'r')
lines = f.readlines()
f.close()
return lines
def read_temp():
lines = read_temp_raw()
while lines[0].strip()[-3:] != 'YES':
time.sleep(0.2)
lines = read_temp_raw()
equals_pos = lines[1].find('t=')
if equals_pos != -1:
temp_string = lines[1][equals_pos+2:]
temp_c = float(temp_string) / 1000.0
temp_f = temp_c * 9.0 / 5.0 + 32.0
return temp_c, temp_f
while True:
print(read_temp())
time.sleep(1)
3.3 Integrated system
© 2017, IRJET | Impact Factor value: 5.181 | ISO 9001:2008 Certified Journal
| Page
256
[image:3.595.35.282.270.431.2]Fig - 2 The Raspberry Pi is connected with DS18B20
Fig-3: The integrated experimental setup
Fig-4?: DS18B20 is inside the water system. An additional thermometer is for calculating the accuracy of the
experiment
The system of water is fixed in a heater. The sensor DS18B20 is fixed in the water system. We accessed the GUI of Raspberry Pi with SSH console. The GUI was accessed remotely via remote Desktop client – Remmina.
4.Results and Discussion
We have designed temperature logger using DS18B20 and Raspberry Pi. By executing the Python script, the output data has been logged into a specific file. Temperatures have been measured for various ranges.
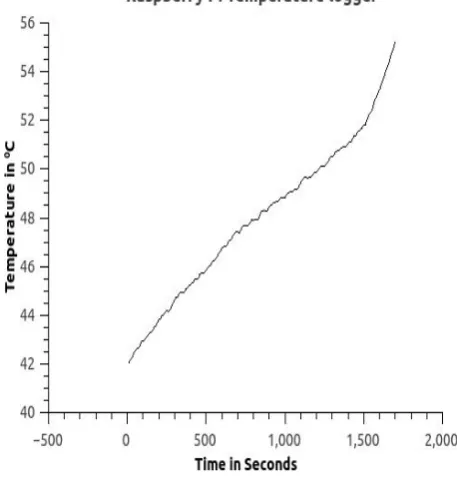
For the first set of experiment we analyzed the temperature of water for 1700 seconds which is approximately ~29 minutes. The stirrer was setup for gradual increment of temperature, as initially. After 1500 seconds, the stirrer was made to increase further range. The output data is logged and the graph has plotted.
Chart -1: The raspberry pi Temperature logger – increasing mode
[image:3.595.310.539.329.569.2]© 2017, IRJET | Impact Factor value: 5.181 | ISO 9001:2008 Certified Journal
| Page
257
Chart -2: Temperature logger Decreasing modeIn this set of experiment we prepared our system to log the temperature data of water for the range of 1650 sec (~ 28 minutes) in decrement mode. We started this experiment in hot water with initial temperature of 80.810C and it was
allowed to radiate in order to decrease. The decrement in temperature was happened due to the open environment. In this graph, raise in the peak up to 480 seconds is due to effect of heat which is already supplied to the system. After 480 seconds the temperature fell down gradually. The decrease in temperature continued over the entire range.
From this graph we calculated that the rate of decrease of temperature as 0.0100C per second
Chart- 3: Temperature logger increasing mode
In this set of experiment we prepared our system to log the temperature data of water for the range of 290 sec (~ 5 minutes) in increment mode. Logged output data is plotted as a graph. This graph shows increase in temperature over the range. There are some small spikes in this graph, shows that the measured data is slightly affected by the
environment. If the range of measurement small , even a small variations too will affect the output data.
From the graph we calculated the rate of increment of temperature is 0.02700C per second.
Chart-4: Temperature logger increasing mode
In this set of experiment we measured the temperature data of water for 2570 seconds (~43 minutes) with increment mode. There is a gradual increase in the graph. This graph shows linearity of the output. Very tiny spikes in the graph shows the effect of environment in the system. From the data we analyzed that the rate of increment of temperature is 0.01510C per second
5. Conclusion
By analyzing these various results we conclude that temperature logger which is made using Raspberry pi , works perfectly. Also the consistency of output is also obtained. From the above results we observe that, the environment plays a vital role on the linearity of output data. Heat loses to the environment causes those variations. These effects can be minimized by the isolated system.
Measurement of data over the higher range of timing is also a factor for linearity of the output data. From the graphs we conclude that the higher ranges of time produces linear output data.
© 2017, IRJET | Impact Factor value: 5.181 | ISO 9001:2008 Certified Journal
| Page
258
this project for low cost temperature logger solutions forlaboratories. In future we extend this project to cloud based logger system. We designed low cost temperature logging system with consistent performance. Designing of a versatile system is also achieved. This measuring system can also be used for studying the environmental effect on a hot system.
6. References
[1] Molloy, D. (2016). Exploring Raspberry Pi: Interfacing to the Real World with Embedded Linux. John Wiley & Sons.
[2] Ping, L., Yucai, Z., Zeng, X., & Ting-fang, Y. (2007, May). A design of the temperature test system based on grouping DS18B20. In Industrial Electronics and Applications, 2007. ICIEA 2007. 2nd IEEE Conference on (pp. 188-191). IEEE.
[3]Shinde, P. A., & Mane, Y. B. (2015, January). Advanced vehicle monitoring and tracking system based on Raspberry Pi. In Intelligent Systems and Control (ISCO), 2015 IEEE 9th International Conference on (pp. 1-6). IEEE.
[4] Upton, E., & Halfacree, G. (2014). Raspberry Pi user guide. John Wiley & Sons.
[5] Membrey, P., & Hows, D. (2015). Learn Raspberry Pi 2 with Linux and Windows 10. Apress.
[6] Pi, R. (2015). Raspberry pi 2 model b. Online]. Tillgänglig: https://www. raspberrypi.
org/products/raspberry-p3-model-b/[Använd 10 02 2016].
[7] https://www.raspberrypi.org/downloads/noobs/
[8] https://www.raspberrypi.org/downloads/raspbian/
[9] Negus, C. (2010). Linux Bible 2010 Edition: Boot Up to Ubuntu, Fedora, KNOPPIX, Debian, openSUSE, and 13 Other Distributions (Vol. 682). John Wiley & Sons. Chapter 8
[10] Ylonen, T., & Lonvick, C. (2006). The secure shell (SSH) protocol architecture.
[11] Nixon, R. (2010). Ubuntu: Up and Running: A Power User's Desktop Guide. " O'Reilly Media, Inc.". Chapter 8
[12] Shen, H., Fu, J., & Chen, Z. (2006, November). Embedded system of temperature testing based on DS18B20. In
Technology and Innovation Conference, 2006. ITIC 2006. International (pp. 2223-2226). IET.
[13] Lott, S. F. (2010). Building Skills in Python.