http://dx.doi.org/10.4236/ojapps.2014.414057
Latent Variable Modeling Approach for
Assessing Social Impacts of Mine Closure
Mallikarjun Rao Pillalamarry
1, Khanindra Pathak
21Department of Mining and Process Engineering, Polytechnic of Namibia, Windhoek, Namibia 2Department of Mining Engineering, Indian Institute of Technology, Kharagpur, India
Email: [email protected]
Received 2 September 2014; revised 23 October 2014; accepted 2 November 2014
Copyright © 2014 by authors and Scientific Research Publishing Inc.
This work is licensed under the Creative Commons Attribution International License (CC BY).
http://creativecommons.org/licenses/by/4.0/
Abstract
Mining stimulates environmental and economic impacts on the neighboring community right from the inception to the closure of its operations. The society in the neighborhood of mining gradually adopts a characteristic life-style that is highly influenced by the mining. In order to sustain the so-cietal development beyond the mine closure, it is necessary to plan post mining activities in the area. Thus, it is essential to predict the impacts of mine closure well before the closure. Many so-cietal and family attributes are affected by mine closure. Impact on these attributes is reflected on the overall quality of life of the neighboring community. There are no adequate indicators and/or methodology available to measure social impacts of mine closure on a neighboring community. This paper made an attempt to develop such methodology to predict the degree of adverse effects of mine closure on the quality of life of neighboring communities using the Structural Equation Modeling (SEM) and the Latent Variables Interaction Model (LVM).
Keywords
Mine Closure, Social Impacts, Structural Equation Modeling, Latent Variable Modeling
1. Introduction
on the mining company as well as on the government [1].
Mine closure is a complex issue involving numerous interrelated parameters and influencing factors. These include environment, socio-economics, sale of equipment and assets, water and waste management, etc. Of all the issues, managing the environmental impacts of mining and rehabilitation of mine land after mine closure have been major concerns for governments and mining companies [2]. In most of the countries, mining compa-nies are required to prepare rehabilitation and reclamation plans before starting of mining operations and require financial surety to ensure reclamation [3]-[5]. In some situations, special funding mechanisms are also devel-oped to clear up abandoned mine sites [6] [7]. However, such stringent regulations have not been imposed to address the local social and economic impacts of mine closure. Most of the companies, governments and coun-tries are now recognising that mine closure is much more than the stopping production and decommissioning of the mine. It is increasingly becoming clear that the socio-economic issues of mine closure and the impacts on workers and their families, communities, and the local economy must also be addressed.
2. Background
2.1. Socio Economic Impacts of Mine Closure
Each stage of mining is associated with specific environmental and social impacts, which are often significant after the closure. At the development stage, mining brings a sudden change in the social structure and supply/ demand scenarios. If a mineral deposit is found below grown-up areas, the mining project calls for rehabilitation of the project affected people (PAP). The site-specific characteristics of mining industry may force the commu-nity for relocation. During opening of a mine a large influx of population put strain on the existing services and business structure. Services and infrastructure such as power, sewage and housing are developed to meet in-creased population which often increase tax burden on the community [8].
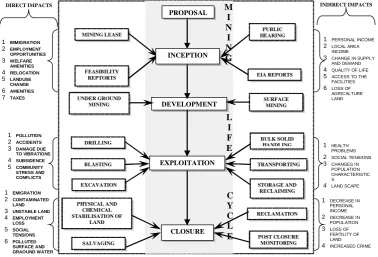
[image:2.595.110.489.447.704.2]On the other hand the impact of mine closure on the community is often severe. Mine closure may result in a sharp decline in their standard of living. Such experiences frequently induce anxiety and stress. The demoraliz-ing effects of mine closure on the wider mindemoraliz-ing communities are evident in the deterioration of the physical en-vironment, control over young people and participation in the community life. Mine closure brings the loss of community facilities such as recreation grounds and the withdrawal of a range of informal services such as housing maintenance and emergency services, which were provided by the mine management [9]. Figure 1
Figure 1. Socio environmental impacts of mining during its life.
1 IMMIGRATION
2 EMPLOYMENT OPPORTUNITIES
3 WELFARE AMENITIES
4 RELOCATION
5 LANDUSE CHANGE
6 AMENITIES
7 TAXES
RECLAMATION POST CLOSURE MONITORING SALVAGING PHYSICAL AND CHEMICAL STABILISATION OF LAND CLOSURE MINING LEASE PUBLIC HEARING FEASIBILITY
REPTORTS EIA REPORTS
DEVELOPMENT
UNDER GROUND
MINING SURFACE MINING
EXPLOITATION DRILLING BLASTING EXCAVATION TRANSPORTING BULK SOLID HANDLING STORAGE AND RECLAIMING
1 PERSONAL INCOME
2 LOCAL AREA INCOME
3 CHANGE IN SUPPLY AND DEMAND
4 QUALITY OF LIFE
5 ACCESS TO THE FACILITIES
6 LOSS OF AGRICALTURE LAND
1 POLLUTION
2 ACCIDENTS
3 DAMAGE DUE TO VIBRATIONS
4 SUBSIDENCE
5 COMMUNITY STRESS AND CONFLICTS
1 HEALTH PROBLEMS
2 SOCIAL TENSIONS
3 CHANGES IN POPULATION CHARACTERISTIC S
4 LAND SCAPE
1 EMIGRATION
2 COMTAMINATED LAND
3 UNSTABLE LAND
4 EMPLOYMENT LOSS
5 SOCIAL TENSIONS
6 POLLUTED SURFACE AND GRAOUND WATER
1 DECREASE IN PERSONAL INCOME
2 DECREASE IN POPULATION
3 LOSS OF FERTILITY OF LAND
4 INCREASED CRIME
DIRECT IMPACTS M INDIRECT IMPACTS
shows impacts at different phases of mining on social and natural environment.
Mining industry plays a major role in the diversified economy of the mining area by providing income, em-ployment and services. In such a context, mine closure will have significant impact on the well-being of the community. Such impacts are exacerbated in developing countries, where alternative economic activities may be more limited, and local government and communities often lack the capacity needed to help and structure a de-velopment process that would provide suitable alternatives. In most cases, the community and the mine have developed an interdependent relationship, in terms of employment, services, infrastructure, environment, taxes and royalties. The level of this integration depends on various factors, including the age and location of the mine, the company’s approach to the community and region, government policies, and the structure of the local and regional economy. Thus, minimizing mine closure impacts on the community is a complex process and demands participation of different stake holders. It is now established that trilateral consultations are very important to develop effective mine closure program.
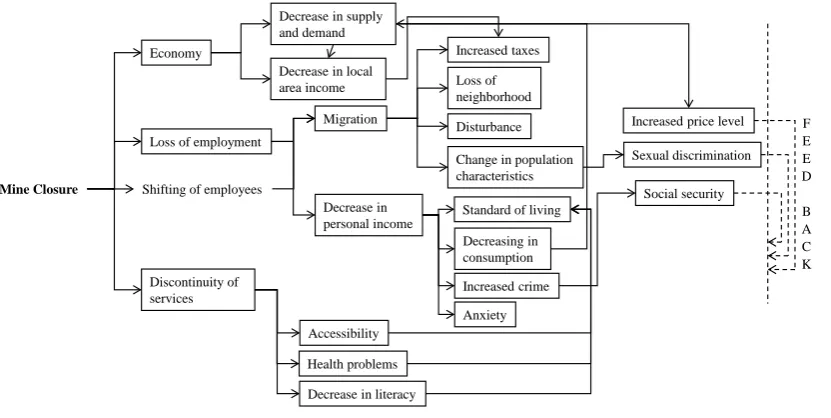
In most of the mining regions, a major portion of government tax revenue comes from mining. Thus, there is a natural question that after the mine closure will the government be able to maintain the same level of income. Mine closure may leave a severe impact on the government’s ability to sustain its services to its constituents. Similarly, mining communities that received direct income from the mine will see a sharp decline in their in-come. Thus, it is very important for governments and communities to understand and plan for the eventuality of mine closure. There is a great need to develop non-mining activities and other productive assets in every mining region that will last beyond the life of the mine and generate income for future generations. At the same time, it is typically not possible to replace the economic benefits of the mine completely; major adjustments will likely be required. Figure 2 shows the impacts network of mine closure which shows that there is a perpetual loop which makes the impacts a never ending phenomenon.
In a mining life cycle the issue of mine closure is very crucial and important because the post closure impacts of unplanned closing of a mine are severe for the natural environment and the community [1]. Past abandoned mining sites continue to pose potential threat to human safety, health and environment [10]. The main causes of all the above impacts are loss of employment, labor migration, discontinued service and facilities, loss of com-munity cohesiveness and environmental degradation [9], which have close relation with Quality of Life (QOL) of the communities. Current evidences have suggested that the demographic variables, environmental characte-ristics, health, leisure, etc. are the potential factors influencing quality of life of the people. There are also other factors such as age, gender, socio-economic status that influence the QOL [11] [12].
2.2. Quality of Life Approach
[image:3.595.96.512.499.708.2]Over the past two decades, Quality of Life (QOL) study created a great interest among many developed and de
Figure 2.Network of impacts of mine closure. Shifting of employees
Migration
Loss of employment
Discontinuity of services
Decrease in supply and demand
Decrease in local area income
Increased price level Economy
Decrease in personal income
Loss of neighborhood Increased taxes
Disturbance
Change in population characteristics
Standard of living
Decreasing in consumption
Increased crime
Anxiety Accessibility
Health problems
Decrease in literacy
Sexual discrimination
Social security
Mine Closure
F E E D
veloping nations [13]. Initially, the concept was applied in the field of sociology, but today it is commonly ap-plied to other disciplines such as, health [14] [15], rehabilitation [16] [17], disability studies [18] (Jones et al., 1996) and social services [19], but also in medicine [20], education [21], environment [22] and others. QOL has emerged with as unique concept of setting the goals for services and assessing their impacts on people’s day- to-day lives [23]. Most people accept that QOL is an aim for both individual and group of individuals [24]. Al-though, it is defined in many ways, its objective is to bring together the developmental change in the individual and their identities, nature of circumstances, life style and finally make the people to live quality lives.
In its efforts towards sustainability, the mining industry has used several environmental and economic indica-tors to assess its performance [25] [26]. In recent years, QOL assessment has proved to be one of the most at-tractive approaches for this task. Mining activities improve the QOL of the communities living in the nearby areas, since it contributes more in terms of direct and indirect employment, services, local and national econom-ic development [27]-[30]. Such dependency is not same for all the families in the neighborhood so the impacts of mine closure. The basic questions involved in the present investigation are how does mining influences the quality of life of people living nearby, what is going to happen if mining is ceased and how mine closure deci-sions influence the wellbeing of the neighboring communities.
2.3. Measuring Quality of Life
Prior to the 1970s, traditional objective indicators were used to predict human welfare [31]. However, in the early 1970’s, social scientists concluded that quality of life was more than a city’s financial position or a coun-try’s Gross Domestic Product [32] [33]). Factors such as personal income, housing, education, health and recre-ational facilities, and green space were recognized as contributing to quality of life [33] [34]. By late 1970s and into the 1980s, there was a marked shift in how quality of life was defined and measured. Subjective measures were used to mediate the weakness associated with using objective indicators to measure quality of life [35]. Recent reviews suggested both objective and subjective indicators are necessary to measure quality of life [13] [23] [36] [37].
The subjective nature of quality of life is commonly cited in the health related literature [38] [39]. In contrast, objective factors play an important role in evaluating QOL of city and country level. Objective factors such as income, housing and education impinge on QOL. Lee [40] and Singh & Chand [41] investigated QOL based on wages and housing expenditure, infrastructure, housing.
Both subjective and objective approaches find predominance in QOL measurement. Some researchers used both objective and subjective measures in assessing QOL of mining communities using the economic, social, political, biophysical, biomedical, and spiritual dimensions [33] [36] [37]. Linga and Subramanya [42], Poston
et al.[43], made a qualitative inquiry into individual family quality of life using both subjective and objective dimensions.
The main purpose of the QOL evaluation is to provide a tool for the community development to monitor the living and working conditions of the people and focus on the community actions to improve their health [44]. Whether we measure the quality of life in terms of subjective variables or objective variables, to improve quality life one has to ameliorate objective variables of the Quality of life. For example one person’s subjective re-sponse of health is poor; to improve his health one has to search for objective variables which are responsible for his poor health. However, objective measures alone cannot give true picture of QOL [36] [37]. Thus, in order to improve Quality of life of a community or group of people, it is necessary to establish a relationship between subjective and objective QOL dimensions. These dimensions near a mining site vary significantly with the per-formance of the industry as well as with the phase of the mining operations. In the closing phase the situations may worsen if adequate technical measures are not taken at the planning stage.
3. Methodology
3.1. Framework
having direct, indirect or both type of dependencies on the mining activities. However, these domains or factors cannot be easily quantified. The most appropriate method would be to take a site specific methodology. In this study a valid structured questionnaire was used to collect the information from the families and individuals. Both qualitative and quantitative information was obtained through the sampling in selected study areas. De-pendencies of the QOL factors and their interrelationships were evaluated using Structural Equation Modeling (SEM). Latent variables scores obtained from SEM model were used for further testing of changed scenario.
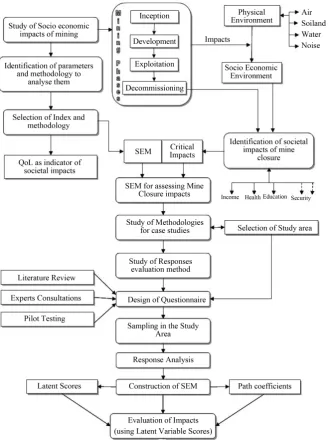
To validate the developed methodology a surface mining site engaged in iron ore was selected and necessary information was collected through responses to a valid questionnaire. The datasets so obtained were subse-quently analyzed using the SEM software (LISREL) and possible impacts of mine closure in these two areas were estimated. The overall methodology used for the study is illustrated in Figure 3.
[image:5.595.132.462.262.709.2]Latent Variable Scores (LVS) are individual scores on the latent variables in an estimated structural equation model. These can be obtained for any estimated single group LISREL model. Use of LV scores is to investigate various structural models after establishing the measurement models for the observed variables. One can obtain scores for the latent variables in any estimated LISREL model. However, this needs information about both the
raw scores and the estimated model. Joreskog [45] proposed a factor analysis (latent variable score) approach for latent variable interaction modeling. Joreskog’s approach is subsequently developed by Schumacker [46]. As the factor scores are influenced by measurement error latent variable score approach holds the promise of being easier to implement and can be applied to more complex latent variable interaction models. Latent scores are unbiased estimates for the latent variables; they have the same means and covariance matrix as the latent va-riables of the model [46] [47].
3.2. Conceptual Structural Equation Model
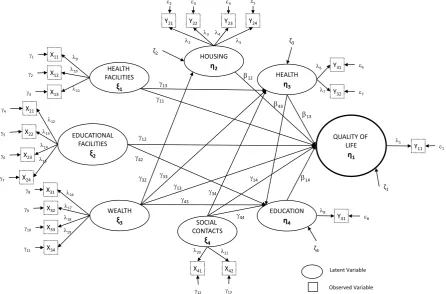
In the last few decades, scientists offered several alternative approaches to measure quality of life using social indicators such as health and levels of crime, subjective well-being and economic indices. Quality of life is a multidimensional concept [19] and associated with many factors, accounting and identifying all the parameters is rather difficult. Considering the objectives of the study, socio-economic influences of mining, QOL model for a community in the neighborhood of mines was conceptualized as shown in Figure 4.
4. Results
4.1. Study Area and Data Sampling
One iron open cast mining area is selected for validating the developed methodology for assessing societal im-pacts of mining. The study area contained two large opencast iron mines currently producing around 7.8 million tonnes per year. Entire mining operations have around 692 full-time employees, of which 50% of the employees mainly live in the nearby town and remaining live in villages that are accessible by road from the mine.
The sampling frame for the study included the villages in the core zone of the mining area (5 km distance
NOTE: Y11 = Subjective QOL, Y21 = Spaciousness, Y22 = Room/Head, Y23 = Type, Y24 = Repair Status, Y31 = Physical Health, Y32 =
Dis-ease Status, Y41 = Education, X11 = No of Physicians, X12 = No of Beds, X13 = Distance, X21 = Teacher-Student Ratio, X22 = Maximum Class
Level, X23 = Teacher Education Level, X24 = Distance, X31 = Income, X32 = Expenditure, X33 = Comforts at home, X34 = Infrastructure, X41 = No
[image:6.595.91.538.368.662.2]of Contacts, X42 = Frequency of Visiting.
Figure 4.The conceptual quality of life (QOL) model.
HEALTH η3 QUALITY OF LIFE η1 HOUSING η2 WEALTH
ξ3 SOCIAL
CONTACTS ξ4 HEALTH FACILITIES ξ1 EDUCATIONAL FACILITIES ξ2 EDUCATION η4 Y11 Y31 Y32 Y41
X41 X42
X31 X32 X33 X34 X21 X22 X23 X24 X11 X12 X13
Y21 Y22 Y23 Y24
β13
β12
β14
γ11
γ12
γ13 γ14
γ13 γ32 γ42 γ33 γ43 β43 γ34 γ44 λ1 λ2
λ3 λ4 λ5 λ6 λ7 λ8 λ9 λ10 λ11 λ12 λ13 λ14 λ15 λ16 λ17 λ18 λ19
λ20 λ21
ζ1
ζ3
ζ2
ζ4
ε1 ε2 ε3 ε4 ε5
ε6
ε7
ε8
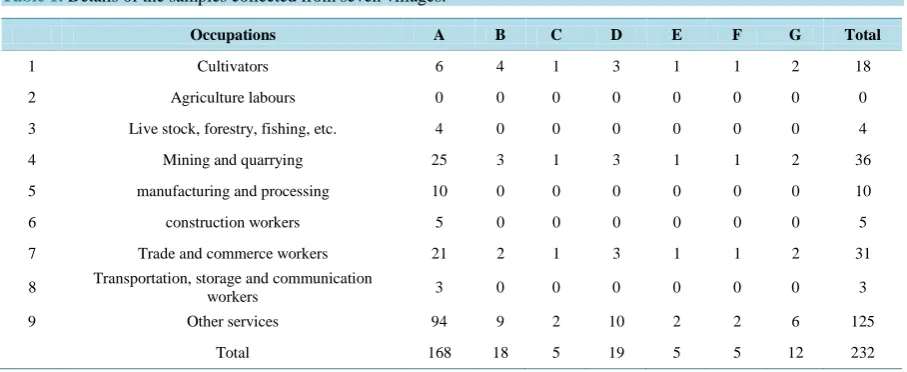
around mining area). First study area was divided into a grid of 2 minutes (in longitude and latitude) interval. One village in each grid randomly selected. Then stratified sampling was employed in each sampling village by categorizing primary occupation of the head of household into seven groups as per Census classification; culti-vators, agriculture labors, mining, manufacturing and processing, construction workers, trade and commerce, transportation and others. This was intended to reflect all social economic classes among the participants. A total of 232 samples were collected from 7 villages. Details of the samples collected from villages are given in Table 1.
4.2. Socioeconomic Profile of the Study Area
Population: The population figure of study area A as per the 2000 census report stands at 9043. The population distribution under the age of 15 was approximately 42%. Sex ratio is 1000 males: 880 Females. 84% families are nuclear type and the concept of joint family system is not prevalent. Religion and caste structure suggesting that the tribal are dominant (68.5%) in most of the villages.
Literacy and Education: The literacy level in the villages surrounding the study area is very low. The literacy level in the surrounding villages is 32.7% the male literacy rate stands at 38.9% while that of female is 28.5%. Out of a total population of 3145, only 649 males and 421 females were literate mostly at the primary level of education. The educational infrastructure available in these villages is merely to the primary levels. School teachers have not been provided at these government owned schools.
Health and Infrastructure:Health and sanitary conditions in the surrounding villages is rather poor. The facil-ities available to them from government and other agencies are also poor. Lack of basic awareness further ag-gravates the problem. Incidences of malaria is the highest amongst all reported diseases including Cold, Diarr-hea, Measles, Anemia, Typhoid etc. Night blindness is a cause of concern not only in the slum but also in vil-lages which are deep into the jungles. Health is a major problem where major mining operations are going on and liquor consumption rather high. In addition to the above health problems some seasonal diseases are also prevalent due lack of proper nutrition and deteriorated sanitary conditions. The existing position of health facili-ties is far from adequate. Block headquarters are far away from the villages. Some of the villages are being sup-ported by Mine management provided mobile van which reaches village on irregular basis. There are some dis-pensaries available which are run by private mine owners. The villages nearby mine town are being taken care of facilities available in the township itself.
Economy: The economy of the area is heavily depended on forest and the mining activities. Casual labor looks to be the mainstay offered by the mines and Forest department. Agriculture is either neglected or contin-ued at low profile. Quite naturally the economy neither has any focus nor any growth. Variations are quite ap-parent from village to village due to location variations.
4.3. LISREL Analysis of the Proposed Model
[image:7.595.86.540.536.722.2]The above conceptual structural equation model (SEM) was executed using LISREL Ver. 7.2 software. The re-
Table 1. Details of the samples collected from seven villages.
Occupations A B C D E F G Total
1 Cultivators 6 4 1 3 1 1 2 18
2 Agriculture labours 0 0 0 0 0 0 0 0
3 Live stock, forestry, fishing, etc. 4 0 0 0 0 0 0 4
4 Mining and quarrying 25 3 1 3 1 1 2 36
5 manufacturing and processing 10 0 0 0 0 0 0 10
6 construction workers 5 0 0 0 0 0 0 5
7 Trade and commerce workers 21 2 1 3 1 1 2 31
8 Transportation, storage and communication
workers 3 0 0 0 0 0 0 3
9 Other services 94 9 2 10 2 2 6 125
sults of the run indicated that the proposed model was good. The χ2 statistic obtained for the model was 254.63 (df = 128, p < 0.001), which seemed to suggest not an adequate fit of the model. However, other indicators in-dicated much more favorable results. For example RMR = 0.051; standardized RMR = 0.042; GFI = 0.928; ad-justed GFI = 0.90; CFI = 0.981. Table 2 shows the statistics obtained through the run.
The reason the χ2 statistic appeared not to support the model was likely caused by the large sample size (N = 231) used in the analysis. Since statistical power is a function of sample size, this means that the larger the sam-ple size, the more likely it is that the χ2 statistic will suggest that the model be rejected. Therefore, in general, the χ2 statistic is not a good model fit indicator when the sample size is greater than 200 [48]. Although the χ2 statis-tic is reported here, the other statisstatis-tical tests are more reliable, considering the large sample size used in this study. Table 3 shows the effects sample size has on the significance of χ2 values. As the sample size is reduced, the χ2 value becomes significant. The Critical N value indicates that the sample size would have to be reduced to 140 before a significant χ2 would be generated by hypothesized model.
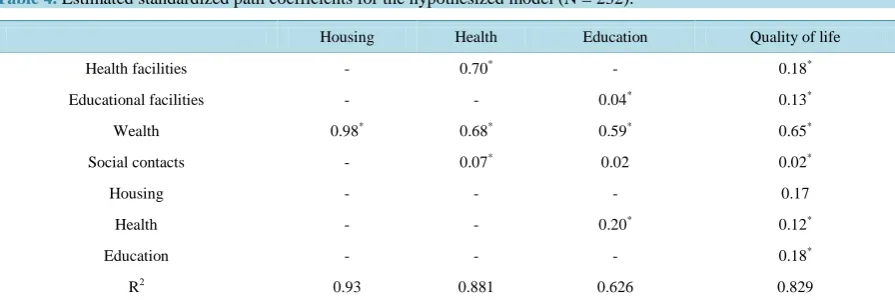
The estimated standardized coefficients for the hypothesized model (shown in Table 4 and Figure 5) indicate that all of the paths in the model are significant at 0.05 level, with the exception of the following two paths:
1) From the social contacts to the personal education. 2) From housing to quality of life.
Nevertheless, the overall model fit is very strong and changes in the paths and removing non-significant path did not bring any model improvement.
4.4. Latent Variable Interaction Modeling
Latent Variable Scores (LVS) are individual scores on the latent variables in an estimated structural equation model. These can be obtained for any estimated single group LISREL model. Latent variables obtained from the structural equation model (Figure 5) were used for the latent variables interaction modeling. Interaction on de-
Table 2. Fit indices of the theoretical model.
2
χ df GFI CFI NFI NNFI RMR* PGFI CNv
254.6 128 0.92 0.981 0.96 0.96 0.04 0.50 142.61
NOTE: * = Standardised. χ2
= Chi-Square, df = Degrees of freedom, GFI = Goodness Fit Index, CFI = Comparative Fit Index, NFI = Normed Fit Index, NNFI = Non-Normed Fit Index, RMR = Room Mean Square Residual, PNFI = Parsimony Normed Fit Index, CNv = Critical N Value.
Table 3. The effect of sample size on χ2 values and associated P values.
N = 230 N = 200 N = 170 N = 140 N = 110
2
χ p χ2
p χ2
p χ2
p χ2
p
[image:8.595.89.537.555.705.2]254.63 0.000 221.27 0.000 187.91 0.0004 154.56 0.055 121.20 0.652
Table 4. Estimated standardized path coefficients for the hypothesized model (N = 232).
Housing Health Education Quality of life
Health facilities - 0.70* - 0.18*
Educational facilities - - 0.04* 0.13*
Wealth 0.98* 0.68* 0.59* 0.65*
Social contacts - 0.07* 0.02 0.02*
Housing - - - 0.17
Health - - 0.20* 0.12*
Education - - - 0.18*
R2 0.93 0.881 0.626 0.829
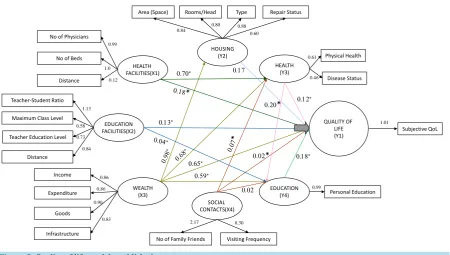
Figure 5. Quality of life model established.
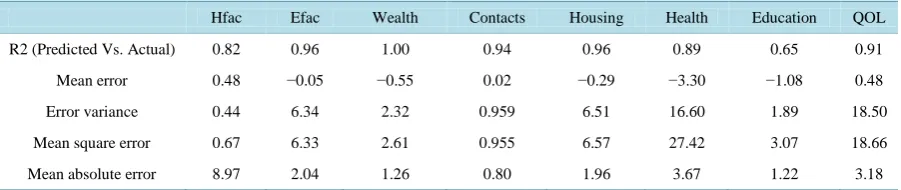
pendent variable was done using all possible combinations of independent variables. For example regression on contacts was done using observed variables such as No of contacts (x41) and Frequency of visiting (x42) and also their interactions (x41 × x42). These interactions improved the model R2 significantly in prediction of contacts, educational facilities and health facility. However, non-significant interactions were removed from the model. It can be observed from the interaction modeling equations that, all models have regression coefficient above 0.80, except modeling equation for education whose regression coefficient was 0.626. This indicates that except edu-cation all other latent variables are well predicted by the respective observed variables. Error statistics for the predicted latent variables through latent variable modeling is show in Table 5.
Interaction between independent observed variables and exogenous latent variables
† † † † 2
31 32 33 34
Wealth=0.318 0.143+ ×x +0.138 ×x +0.91 ×x +0.279 ×x R =0.989 (1)
† † 2
41 42 41 42
Contacts=2.159 +1.045 ×x −0.179 x× +0.017 x× ×x R =0.885 (2)
† † † † † †
21 22 23 24 21 22
† † †
22 23 23 24 23 24 21 21 22 23 24
2
EFAC 85.64 1.2 x 3.45 x 14.68 x 1.219 x 0.121 x x
0.52 x x 1.112 x x 0.004 x x x 0.001 x x x x
R 0.907.
= − × + × + × − × − × ×
− × × − × × − × × × + × × × ×
=
(3)
† † † 2
11 12 13 11 12 13
HFAC=18.688 +0.121 x× +0.451 ×x −0.673 x× +0.001 ×x ×x ×x R =0.928 (4)
where,
EFAC: educational facilities status, HFAC: health facilities status x11: no of physicians, x12: no of beds, x13: distance, x21: teacher-student ratio, x22: maximum class level, x23: teacher’s education level, x24: distance, x31: per capita income, x32: expenditure, x33: conforts at home, x34: infrastructure
†indicates significant at 0.05 or better probability level
Interaction between exogenous latent variable and mediating latent variables
† † † 2
Education=0.13 ×EFAC +0.65 Wealth× +0.02 Contacts× +0.2 Health× +0.374 R =0.626 (5)
† † † 2
Health=0.70 ×HFAC 0.68+ ×Wealth+0.07 ×Contacts 0.281 R− =0.881 (6)
† 2
Housing=0.96 ×Wealth+0.041 R =0.93 (7)
†indicates significant at 0.05 or better probability level
HEALTH (Y3) QUALITY OF LIFE (Y1) HOUSING (Y2) WEALTH (X3) SOCIAL CONTACTS(X4) HEALTH FACILITIES(X1) EDUCATION FACILITIES(X2) EDUCATION (Y4) Subjective QoL Physical Health Disease Status Personal Education
No of Family Friends Visiting Frequency Income
Expenditure
Goods
Infrastructure Teacher-Student Ratio
Maximum Class Level
Teacher Education Level
Distance
No of Physicians
No of Beds
Distance
Area (Space) Rooms/Head Type Repair Status
0.12∗
0.17
0.18∗
0.13∗
0.65∗ 0.02*
Table 5. Error statistics of the predicted latent variables using regression equation.
Hfac Efac Wealth Contacts Housing Health Education QOL R2 (Predicted Vs. Actual) 0.82 0.96 1.00 0.94 0.96 0.89 0.65 0.91 Mean error 0.48 −0.05 −0.55 0.02 −0.29 −3.30 −1.08 0.48 Error variance 0.44 6.34 2.32 0.959 6.51 16.60 1.89 18.50 Mean square error 0.67 6.33 2.61 0.955 6.57 27.42 3.07 18.66 Mean absolute error 8.97 2.04 1.26 0.80 1.96 3.67 1.22 3.18
Interaction between exogenous latent variable, mediating latent variables and ultimate endogenous latent va-riable
† † † †
† † † 2
Quality of Life 0.18 HFAC 0.04 EFAC 0.59 Wealth 0.02 Contacts
0.17 Housing 0.12 Health 0.18 Education 0.171 R 0.829.
= × + × + × + ×
+ × + × + × + = (8)
†indicates significant at 0.05 or better probability level
4.5. Impact Analysis
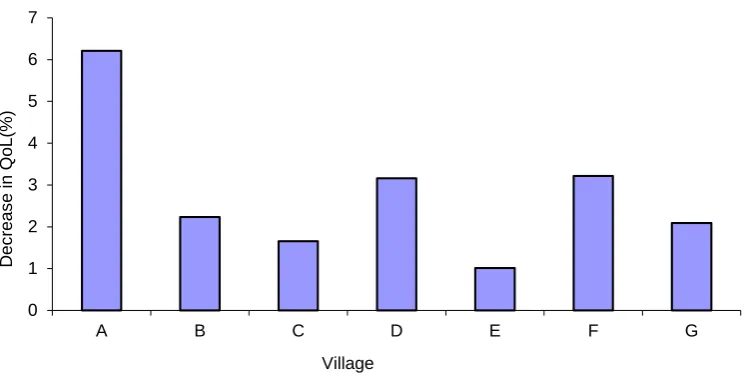
Impact on the quality of life due to direct income was evaluated by recalculating the monthly income (Indepen-dent manifest variable for the wealth construct) of the families after subtracting the income derived from mining. Modified monthly income had taken as an input to the latent variable model (LVM) derived in the previous sec-tion to calculate the quality of life. The percentage of change in the quality of life (village wise) has been shown in Figure 6. This shows the impact on the people who directly draw income from mining company in the form of their monthly salaries. However, the benefits that may be received from the mining company after mine clo-sure is not considered in the evaluation the impact.
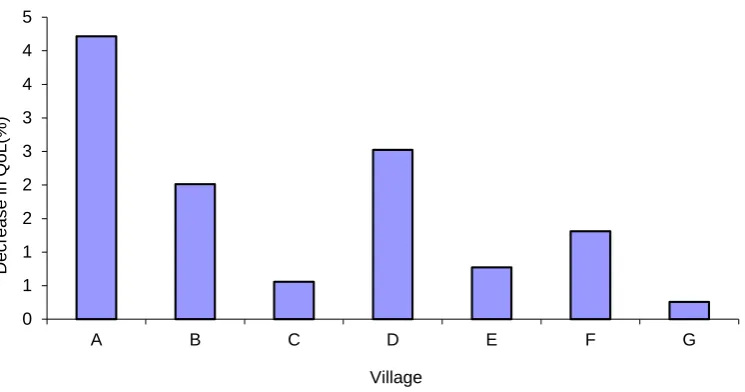
To derive the impact of loss of indirect income from mining, it was assumed that 50% of the income will be lost due to mine closure. Impact was evaluated by recalculating the monthly income of the families by subtract-ing the 50% of the indirect minsubtract-ing depended income. Similarly, modified monthly income was taken as an input to the latent variable model (LVM) derived in the previous section to calculate the quality of life. Figure 7 shows the impact on the people who indirectly depend on mining for their monthly income. For example: busi-nessmen, daily labors and temporary workers in the mines, domestic workers etc. The percentage of change in the quality of life (village wise) has been shown in Figure 7.
Impact of health facilities on QOL is derived by replacing health facilities variable values (No. of physicians, No. of beds and distance) by the health facilities that will remain after closure (assumed that government pro-vided health facilities and other private health facilities will remain after closure). Figure 8 suggests that closing of health facilities have significant impact similar to impact due to loss of income.
Impact of education facilities on QOL is derived by replacing the values of variables affecting educational fa-cilities (student-teacher ratio, maximum class level, teacher’s education level, distance) by the educational facil-ities that will remain after closure (assumed that government provided educational facilfacil-ities and other private educational facilities will remain after closure also). From Figure 9 it can be observed that the impact of educa-tional facilities on the quality of life is not as significant as heath facilities and income.
Impact on QOL due to emigration was derived by subtracting the number of migrated family friends from present family friends. Impact due loss of contact is not as much as impact due to other parameters. Figure 10 shows the impact on QOL of the communities due to emigration.
5. Discussion
Figure 6.Impact due to loss of direct income on the QOL of the communities.
Figure 7.Impact due to loss of indirect income on the QOL of the communities.
Figure 8.Impact due to closing of health facilities on the QOL of the communities.
0 1 2 3 4 5 6 7 8
A B C D E F G
D
ec
reas
e i
n
Q
oL(
%
)
Village
0 1 2 3 4 5 6
A B C D E F G
D
ec
reas
e i
n
Q
oL(
%
)
Village
0 1 2 3 4 5 6 7
A B C D E F G
D
ec
reas
e i
n Q
oL(
%
)
[image:11.595.113.486.519.708.2]Figure 9.Impact due to closing of educational facilities on the QOL of the communities.
Figure 10.Impact due to loss of contacts (emigration) on the QOL of the communities.
education facilities, inter-family relations on housing, health, education and finally on quality of life of com-munities living nearby mining area.
The findings from the present study establish that QOL is significantly affected by certain mining dependent parameters such as income, health and educational facilities, social contacts, etc. It was found that personal wealth is a very important element in the maintenance of subjective quality of life. Wealth resources has signifi-cant contribution in predicting QOL
(
γ =0.65, 0.06p<)
by both direct and indirect ways. The structural model also reveal that wealth has indirect positive causal effect on the QOL though housing(
γ =0.98, 0.05p<)
, health(
γ =0.68, 0.05p<)
, education(
γ =0.59, 0.05p<)
. This is in conformity to the general statement that people with more wealth have higher sense of wellbeing.Conforming to the findings of Smith [49] and Ettner [50], the developed model shows positive correlation between health and economic resources
(
γ =0.68, 0.05p<)
. The present model establishes that income, ex-penditure, comforts at home and facilities are proxies for wealth and have positive contribution to health. Health facilities have positive significant role(
γ =0.7, 0.05p<)
in improving health of the communities and family health has significant contribution in improving quality of life, hence health facilities directly as well as indi-rectly brings a significant change in quality of life. Number of physicians and number beds are appear to be good predictors of health facilities than distance from the community, possibly because people prefer better health facilities even at a greater distance.0 1 1 2 2 3 3 4 4 5
A B C D E F G
D
ec
reas
e i
n Q
oL(
%
)
Village
0 0.5 1 1.5 2 2.5
A B C D E F G
D
ec
reas
e i
n Q
oL(
%
)
The “γ” and “p” values obtained to assess the impacts of educational facilities on personal education reveal that education facilities have little influence on quality of life. Most of the villages in the study area have ele-mentary schools and high schools which are maintained by the government. However, most of the people are il-literates due to lack of educational awareness. This may be the reason for little influence of education facilities on education. Teacher-student ratio, education level of teacher and class size are emerged as good predictors of educational facilities than the distance of the educational facilities from the residence.
The developed model suggests that interfamily relations have significant contribution to the quality of life (γ = 0.02, p < 0.05). These effects are significant both direct and indirect paths through health. However, it is well documented that more interaction with other families and helping each other improves the QOL. Interfamily re-lations does not have significant influence on the education. This is attributed to lack of educational awareness amongst families.
6. Conclusions
It is evident from the study that exploring alternate economic arrangements should be the primary concern dur-ing mine closure planndur-ing in the study areas. From the model it was noticed that satisfaction with life in general was confirmed to be significantly predicted (at 0.05 significance level) by objective factors such as personal in-come, health, education, service and facilities, etc. A linear relationship was revealed between objective quality of life status and subjective quality of life satisfaction. The results of this study suggest that identification of proactive factors that influence the QOL of the communities nearby mining area provide useful information for mine closure planners to minimize the post closure social impacts.
As noticed earlier that quality of life associated with many factors. In the present study the major factors which were directly influenced by mine closure in previous case studies were considered. According to the lite-rature, the subjective response of the QOL/Wellbeing depends on the nature of neighborhood environment, so the present model will be used only to predict the social impacts of two mines from which data has been col-lected. In measuring health status, long term illness or diseases and physical disabilities were considered. Short term illness and psychological health which change with time were not considered in the present study. Al-though some factors were addressed in the literature as potential factors of QOL, they were not considered be-cause they were beyond the scope of the study. This study has assumed that no significant physical or chemical environmental problem would exist after mine closure.
References
[1] Sarkar, S.K. and Sarkar, S. (1996) State of Environmental and Development in Indian Coal Fields: Coal Fields in West Bengal. Oxford & IBH Publishing, New Delhi.
[2] Andrews-Speed, P., Guo, M., Bingjia, S. and Chenglin, L. (2005) Economic Responses to the Closure of Small-Scale Coal Mines in Chongqing, China. Resources Policy, 30, 39-54. http://dx.doi.org/10.1016/j.resourpol.2004.12.002
[3] Kahn, J.R., Franceschi, D., Curi, A. and Vale, E. (2001) Economic and Financial Aspects of Mine Closure. Natural
Resources Forum, 25, 265-274.http://dx.doi.org/10.1111/j.1477-8947.2001.tb00768.x
[4] Redgwell, C. (1992) Abandonment and Reclamation Obligations in the United Kingdom. Journal of Energy and
Nat-ural Resources Law, 10, 59-86.
[5] Kuhne, G. (1992) Abandonment and Reclamation of Energy Sites and Facilities: Germany. Journal of Energy and
Natural Resources Law, 10, 4-20.
[6] Brook, D. (1994) Reclamation of Abandoned Underground Mines in the United States. Mineral Planning, 61, 21-26.
[7] Meyer, P.B., Williams, R.H. and Young, K.R. (1995) Contaminated Land—Reclamation, Redevelopment and Reuse in the United States and the European Union. Edward Elgar, Cheltenham.
[8] Finsterbusch, K. (1980) Understanding Social Impacts. Saga Publication, California.
[9] Michael, H. and Maria, S. (2003) Mine Closure and Its Impact on the Community: Five Years after Mine Closure in Romania, Russia and Ukraine. World Bank Policy Research Working Paper Series, 3083.
[10] Chattopadhyay, S.S. (2001) Theratholes of Raniganj. Frontline Magazine, Vol. 18.
http://www.frontline.in/static/html/fl1824/18240500.htm
[12] Raphael, D., Renwick, R., Brown, I. and Rootman, I. (1996) Quality of Life Indicators and Health: Current Status and Emerging Conceptions. Social Indicators Research, 39, 65-88. http://dx.doi.org/10.1007/BF00300833
[13] Smith, A.E. (2000) Quality of Life: A Review. Education and Aging, 15, 419-435.
[14] Derrett, S., Paul, C. and Morris, J. (1999) Waiting for Elective Surgery: Effects on Health-Related Quality of Life.
In-ternational Journal for Quality in Health Care, 11, 47-57. http://dx.doi.org/10.1093/intqhc/11.1.47
[15] Gill, T. and Feinstein, A.A. (1994) Critical Appraisal of the Quality-of-Life Measurements. Journal of American
Med-ical Association, 272, 619-626. http://dx.doi.org/10.1001/jama.1994.03520080061045
[16] Fabian, E.S. (1990) Quality of Life: A Review of Theory and Practice Implications for Individuals with Long-Term Mental Illness. Rehabilitation Psychology, 35, 161-169. http://dx.doi.org/10.1037/h0079059
[17] Packer, T., Race, K.E.H. and Hotch, D.F. (1994) Focus Groups: A Tool for Consumer-Based Program Evaluation in Rehabilitation Agency Settings. Journal of Rehabilitation, 60, 30-33.
[18] Jones, J., Dagnan, D., Trower, P. and Ruddick, L. (1996) People with Learning Disabilities Living in Communi-ty-Based Homes: The Relationship of Quality of Life with Age and Disability. International Journal of Rehabilitation
Research, 19, 219-227. http://dx.doi.org/10.1097/00004356-199609000-00003
[19] Linda, S. and Robert, G. (2005) Sustainable Transportation and Quality of Life. Journal of Transport Geography, 13, 59-69. http://dx.doi.org/10.1016/j.jtrangeo.2004.11.003
[20] Michael, K., Monika, K.S. and Wilfried, L. (2005) Outcome and Quality of Life in Medicine: A Conceptual Frame-work to Put Quality of Life Research into Practice. Urologic Oncology Seminars and Original Investigations, 23, 186- 192. http://dx.doi.org/10.1016/j.urolonc.2005.03.002
[21] Tankova, T., Galina, D. and Dragomir, K. (2005) Education and Quality of Life in Diabetic Patients. Patient Education
and Counseling, 53, 285-290. http://dx.doi.org/10.1016/j.pec.2003.09.013
[22] Robert, W.M. (2003) Understanding Environmental Quality through Quality of Life Studies: The 2001 DAS and Its Use of Subjective and Objective Indicators. Landscape and Urban Planning, 65, 73-83.
http://dx.doi.org/10.1016/S0169-2046(02)00239-6
[23] Felce, D. (1997) Defining and Applying the Concept of Quality of Life. Journal of Intellectual Disability Research, 41, 126-135. http://dx.doi.org/10.1111/j.1365-2788.1997.tb00689.x
[24] Hanestad, B. (1990) Errors of Measurement Affecting the Reliability and Validity of Data Acquired from Self-Assessed Quality of Life. Scandinavian Journal of Caring Sciences, 30, 1349-1359.
[25] John, M. and Catherine, E.R. (2005) Education, Learned Effectiveness and Health. London Review of Education, 3, 205-220. http://dx.doi.org/10.1080/14748460500372366
[26] Azapagic, A. (2004) Developing a Framework for Sustainable Development Indicators for the Mining and Minerals Industry. Journal of Cleaner Production, 12, 639-662. http://dx.doi.org/10.1016/S0959-6526(03)00075-1
[27] Scott, P. (2005) Mining and Poverty Reduction: Transforming Rhetoric into Reality. Journal of Cleaner Production, 14, 376-387.
[28] Figueroa, B.E. and Calfucura, T.E. (2003) Growth and Green Income: Evidence from Mining in Chile. Resources Pol-icy, 29, 165-173. http://dx.doi.org/10.1016/j.resourpol.2004.08.003
[29] Patricio, A. (2001) Impacts and Development in Local Economies Based on Mining: The Case of the Chilean II Region.
Resources Policy, 27, 119-134. http://dx.doi.org/10.1016/S0301-4207(01)00013-7
[30] Benjamin, N.A. (2001) Ghana’s Mining Sector: Its Contribution to the National Economy. Resources Policy, 27, 61-75.
http://dx.doi.org/10.1016/S0301-4207(00)00042-8
[31] George, S.D. and Weitz, B.A. (1997) Comparative Urban Social Indicators: Problem and Prospects. Policy Sciences, 8, 423-435.
[32] Mirinigoff, M.L. (1996) The Growing Gap between Standard Economic Indicators and the Nation’s Social Health.
Challenge, 39, 17-22.
[33] Pacione, M. (1982) The Use of Objective and Subjective Measures of Quality of Life in Human Geography. Progress
in Human Geography, 6, 495-514.
[34] Rogerson, R.J., Findlay, A.M., Morris, A.S. and Coombes, M.G. (1989) Indicators of Quality of Life: Some Methodo-logical Issues. Environment and Planning, 21, 1655-1666. http://dx.doi.org/10.1068/a211655
[35] Abrams, M. (1977) Social Indicators and Social Equity. New Society, 22, 454-455.
[36] Felce, D. and Perry, J. (1995) Quality of Life: Its Definition and Measurement. Research in Developmental Disabilities, 16, 51-74. http://dx.doi.org/10.1016/0891-4222(94)00028-8
[38] Beckie, T.M. and Hayduk, L.A. (1977) Measuring Quality of Life. Social Indicators Research, 42, 21-39.
http://dx.doi.org/10.1023/A:1006881931793
[39] Fakhoury, W.K.H. and Priebe, S. (2002) Subjective Quality of Life: It’s Association with Other Constructs.
Interna-tional Review of Psychiatry, 14, 219-224. http://dx.doi.org/10.1080/09540260220144957
[40] Lee, E. (2002) Estimation of Quality of Life Korean Cities. Proceedings of the 6th Russian-Korean International
Symposium on Science and Technology (KORUS), Novosibirsk, 24-30 June 2002, 93-95.
[41] Singh, P. and Chand, R. (2000) Quality of Life Approach for Identification of Poor. Journal of Rural Development, 19, 27-68.
[42] Linga, N. and Subramanya, N. (2005) Assessing Quality of Life in a Mining Region. Economic Political Weekly, 72- 78.
[43] Poston, D., Turnbull, A., Park, J., Hasheem, M., Jane, M. and Wang, M. (2003) Family Quality of Life: A Qualitative Inquiry. Mental Retardation, 41, 313-328. http://dx.doi.org/10.1352/0047-6765(2003)41<313:FQOLAQ>2.0.CO;2
[44] Ontario Social Development Council (1997) Quality of Life in Ontario. Ontario Social Development Council, Ontario.
[45] Joreskog, K.G. (2000) Latent Variable Scores and Their Uses. Scientific Software International, Inc., Lincolnwood.
[46] Schumacker, R.E. (2002) Latent Variable Interaction Modeling. Structural Equation Modeling, 9, 40-54.
http://dx.doi.org/10.1207/S15328007SEM0901_3
[47] Bollen, K.A. and Long, J.S., Eds. (1993) Testing Structural Equation Models. SAGE Publications, London.
[48] Bagozzi, R.P. and Youjae, Y. (1988) On the Evaluation of Structural Equation Models. Journal of the Academy of
Marketing Science, 16, 74-94. http://dx.doi.org/10.1007/BF02723327
[49] Smith, J.P. (1999) Health Bodies and Thick Wallets: The Dual Relation between Health and Economic Status. Journal
of Economic Perspectives, 13, 145-166. http://dx.doi.org/10.1257/jep.13.2.145
[50] Ettner, S. (1996) New Evidence on the Relationship between SES and Health. Journal of Health Economics, 15, 67-85.