© 2017, IRJET
|
Impact Factor value: 5.181
|
ISO 9001:2008 Certified Journal
|
Page 634
Outlier Detection Approaches in Data Mining
Bharati Kamble , Kanchan Doke
Computer Engineering,Mumbai University,Navi Mumbai-400614,Maharashtra, India.
--- Abstract — Outlier is defined as an event that deviates too much from other events. The identification of outlier can lead to the discovery of useful and meaningful knowledge. Outlier means it’s happen at some time it’s not regular activity. Research about Detection of Outlier has been extensively studies in the past decade. However, most existing research focused on the algorithm based on specific knowledge, compared with outlier detection approach is still rare. In this paper mainly focused on different kind of outlier detection approaches and compares it’s prone and cones. In this paper we mainly distribute of outlier detection approach in two parts classic outlier approach and spatial outlier approach. The classical outlier approach identifies outlier in real transaction dataset, which can be grouped into statist ical approach, distance approach, deviation approach, and density approach. The spatial outlier approach detect outlier based on spatial dataset are different from transaction data, which can be categorized into spaced approach and graph approach. Finally, the comparison of outlier detection approaches.
Keywords— outlier detection; spatial data, transaction data.
I. INTRODUCTION
Data mining is a process of extracting valid, previously unknown, and ultimately comprehensible information from large datasets and using it for organizational decision making [10]. However, there a lot of problems exist in mining data in
large datasets such as data redundancy, the value of attributes is not specific, data is not complete and outlier [13].Outlier is
defined as an observation that deviates too much from other observations that it arouses suspicions that it was generated by a different mechanism from other observations [21]. The identification of outliers can provide useful, sufficient and
meaningful knowledge and number of applications in areas such as climatology, ecology public health, transportation, and location based services. Recently, a few studies have been conducted on outlier detection for large dataset [4]. However,
most existing study concentrate on the algorithm based on special background, compared with outlier identification approach is comparatively less. This paper mainly discusses about outlier detection approaches from data mining perspective. The inherent idea is to research and compare achieving mechanism of those approaches to determine which approach is better based on special dataset and different background.
The rest of this paper is organized as follows. Section 2 reviews related work in outlier detection. We would like to discuss different method of outlier detection which can be differentiating based on: classic outlier technique based on real time dataset and spatial outlier technique based on spatial dataset which is discuss in section 3. The classic outlier approach can be grouped into statistical-based approach, distance-based approach, deviation -based approach, density based approach. The spatial outlier approach can be grouped into space-based approach and graph-based approach. Comparison of outlier detection is provided in Section 4. Finally, Section 5 concludes with a summary of those outlier detection algorithms.
II. PREVIOUS WORK
The classic definition of an outlier is due to Hawkins [21] who defines “an outlier is an observation which deviates so
much from other observations as to arouse suspicions that it was generated by a different mechanism”.
Most approaches on outlier mining in the early work are based on statistics which use a standard distribution to fit the dataset. Outliers are describing based on the probability distribution. For example, Yamanishi et a1. Used a Gaussian mixture model to describe the normal behaviors and each object is given a score on the basis of changes in the model[22].
Knorr et al. proposed a new definition based on the concept of distance, which regard a point p in data set as an outlier with respect to the parameters K and λ, if no more than k points in the data set are at a distance λ or less than p [6].
Arning et a1. Proposed a deviation-based method, which identify outliers by inspecting the main characteristics of objects in a dataset and objects that “deviate” from these features arc considered outliers [1].
Breunig et al. introduced the concept of local outlier, a kind of density-based outlier, which assigns each data a local outlier factor LOF of being an outlier depending on their neighborhood [13]. The outlier factors can be computed very
efficiently only if some multi-dimensional index structures such as R-tree and X-tree [17] are employed. A top-n based local
Lazarevic and Kumar proposed a local outlier detection algorithm with a technique called “feature bagging” [4]. Shekhar
et al. [6] proposed the definition of spatial outlier: “A spatial outlier is spatially associating objects whose non spatial rank
values are much distinct to those of other spatially assign objects in its spatial neighborhood”.
Kou et al. developed spatial weighted outlier detection algorithms which use properties such as center distance and common border length as weight when comparing non-spatial attributes [2]. Adamet al. proposed an algorithm which
considers both spatial relationship and semantic relationship among neighbors [5]. Liu and Jezek proposed a method for
detecting outliers in an irregularly distributed spatial data set [11].
III. OUTLIER DETECTION APPROACHES
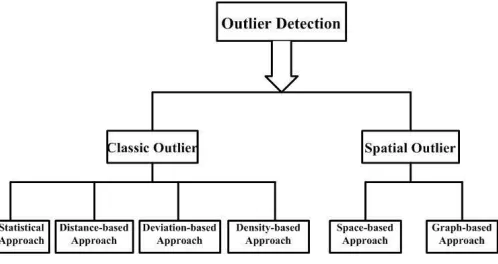
Outlier detection has been extensively studied in the past decennium and numerous methods hav e been created. Outlier detection approach is differentiating in two categories: classic outlier approach and spatial outlier approach. The classic outlier approach analyzes outlier based on transaction dataset, which can be grouped into statistical -based approach, distance-based approach, deviation-based approach, density based approach. The spatial outlier approaches analyze outlier based on spatial dataset, which can be grouped into space based approach and graph -based approach, as illustrated in Figure 2.
3.1. CLASSIC OUTLIER
Classic outlier approach analyzes outlier based on transaction dataset, which consists of collections of items. A typical example is market basket data, where each transactions is the group of products purchased by a customer in a one transaction. Such data can also be augmented by additional “items” describing the customer or the context of the transaction. Commonly, transaction data is relative to other data to be simple for the outlier detection. Thus, most outlier approaches are researched on transaction data.
(1) Statistical Approach
Statistical approaches were the oldest algorithms used for outlier identification, which cause a distribution model for the given data set and using a discordance test they
detect outliers. In fact, many of the techniques described in both Barnett and Lewis [20] and Rousseeuw and Leroy [18] are
[image:2.595.180.429.444.576.2]single dimensional. However, with the dimensions increasing, it becomes more difficult and inaccurate to make a model for dataset.
Fig. 2 Classification of Outlier Approach
(2)Distance-based Approach
The concept of distance-based outlier relies on the notion of the neighborhood of a point, typically, the knearest neighbors, and has been first introduced by Knorr and Ng [16,14]. Distance-based outliers are those points for which there
are less than k points within the distance in the input data set. Distance-based approach is not providing required knowledge about a ranking of outlier detection but it’s used to define a preferable rank of the parameter.
Ramaswamy et al. [15] modified the definition of outlier introduced by Knorr and Ng and consider as outliers the top n point’s p whose distance to their k-th nearest neighbor is greatest. Partition based technique are works as follow: Firstly they divide the input points using clustering technique and then prune that division that cannot contain outlier which is used to detect outliers.
© 2017, IRJET
|
Impact Factor value: 5.181
|
ISO 9001:2008 Certified Journal
|
Page 636
(3) Deviation-based ApproachArning et a1. proposed a deviation-based method, which identify outliers by inspecting the main characteristics of objects in a dataset and objects that “deviate” from these features arc considered outliers [19].
(4) Density-based Approach
The density-based approach estimates the density
distribution of the data and identifies outliers as those lying in low-density regions. Breunig et al. [13] assign a local outlier
factor (LOF) to each point based on the local density of its neighborhood, which is determined by a user-given minimum number of points (MinPts). Papadimitriou et al. [7] present LOCI (Local Correlation Integral) which uses statistical values
based on the data itself to tackle the issue of choosing values for MinPts. Density-based techniques have the advantage that they can detect outliers that would be missed by techniques with a single, global criterion. However, data is usually sparse in high-dimensional spaces rendering density-based methods problematic.
3.2. SPATIAL OUTLIER
For spatial data, classic approaches have to be modified because of the qualitative difference between spatial and non- spatial attributes. Spatial dataset could be defined as a collection of spatially referenced objects. Attributes of spatial objects fall into two categories: spatial attributes and non s patial attributes. The spatial attributes include location, shape and other geometric or topological properties. Non spatial attributes include length, height, owner, building age and name. Comparisons between spatially referenced objects are based on non-spatial attributes [8].
Informally, a spatial outlier is a local instability, or an extreme observation with respect to its neighboring values, even though it may not be significantly different from the entire population. Detecting spatial outliers is useful in many applications of geographic information systems and spatial
dataset [6, 8, 12].
The identification of spatial outliers can reveal hidden but valuable information in many applications, For example, it can help locate severe meteorological events, discover highway congestion segments, pinpoint military targets in satellite images, determine potential locations of oil reservoirs, and detect water pollution incidents.
(1) Space-based Approach
Space-based outliers use Euclidean distances to define spatial neighborhoods. Kou et al. developed spatial weighted outlier detection algorithms which use properties such as center distance and common border length as weight when comparing non -spatial attributes [2]. Adamet al. proposed an algorithm which considers both spatial relationship
and semantic relationship among neighbors [5]. Liu et al. proposed a method for detecting outliers in an irregularly- distributed spatial data set [11].
(2) Graph-based Approach
Graph-based Approach uses graph connectivity to define spatial neighborhoods. Yufeng Kou et al. proposed a set of graph-based algorithms to identify spatial outliers, which first constructs a graph based on k -nearest neighbor relationship in spatial domain, assigns the non-spatial attribute differences as edge weights, and continuously cuts high- weight edges to identify isolated points or regions that are much dissimilar to their neighboring objects. The algorithms have two major advantages compared with the existing spatial outlier detection methods: accurate in detecting point outliers and capable of identifying region outliers [23].
IV. RECENT ADVANCEMENTS IN OUTLIER DETECTION
4.1 SLOF
4.2 Non-Parametric Composite Outlier Detection
Detection of the existence of data streams drawn from outlying distributions among data streams drawn from a typical distribution is investigated. It is assumed that the typical distribution is known and the outlying distribution is unknown. The generalized likelihood ratio test (GLRT) for this problem is constructed. With knowledge of the Kullback - Liebler divergence between the outlier and typical distributions, the GLRT is shown to be exponentially consistent (i.e, the error risk function decays exponentially fast). It is also shown that with knowledge of the Chernoff distance between the outlying and typical distributions, the same risk decay exponent as the parametric model can be achieved by using the GLRT. It is further shown that, without knowledge of the distance between the distributions, there does not exist an exponentially consistent test, although the GLRT with a diminishing threshold can still be consistent[25].
V. CONCLUSION
This paper mainly discusses about outlier detection approaches from data mining perspective. Firstly, we reviews related work in outlier detection. Then, we compare and discuss different algorithms of outlier identification which can be classified based on two categories: classic outlier approach and spatial outlier approach. The classic outlier approach analyzes outlier based on transaction dataset, which can be grouped into statistical-based approach, distance-based approach, deviation-based approach, density-based approach.
The spatial outlier approach analyzes outlier based on spatial dataset, which can be grouped into space based approach, graph-based approach. Thirdly, we conclude some advances in outlier detection recently.
[1] Agarwal, D., Phillips, J.M., Venkatasubramanian, “The hunting of the bump: on maximizing statistical discrepancy”. In: Proc. 17th Ann. ACM-SIAM Symp. On Disc. Alg. pp. 1137–1146 (2006).
[2] Y. Kou, C.-T. Lu, and D. Chen. “Spatial weighted outlier detection”. In Proceedings of the Sixth SIAM International Conference on Data Mining,pp. 614–618, Bethesda, Maryland, USA, 2006.
[3] Aggarwal, C. C., Yu, S. P., “An effective and efficient algorithm for high-dimensional outlier detection, The VLDB Journal, 2005, vol. 14, pp. 211-221.
[4] Lazarevic, A., Kumar” Feature Bagging for Outlier Detection”. In: KDD (2005).
[5] N. R. Adam, V. P. Janeja, and V. Atluri., “Neighborhoodbased detection of anomalies in high -dimensional spatiotemporal sensor datasets”. In Proceedings of the 2004 ACM symposium on Applied computing, Nicosia, Cyprus, 2004. pp. 576–583
[6] S. C. Shashi Shekhar, “Spatial Databases: A Tour. Prentice Hall”, 2003.
[7] Papadimitriou, S., Kitawaga, H., Gibbons, P., Faloutsos, C., “LOCI: Fast outlier detection using the local correlation integral”, Proc. of the Int’l Conf. on Data Engineering, 2003.
[8] Chang-Tien Lu, Dechang Chen,Yufeng Kou, “Detecting spatial outliers with multiple attributes”, Tools with Artificial Intelligence, 2003. Proceedings. 2003, pp.122–128.
[9] Yu, D., Sheikholeslami, G. and Zang, “A find out: finding outliers in very large datasets”. In Knowledge and Information Systems, 2002, pp.387-412.
[10]Jin, W., Tung, A.K.H., Han, J.W. “Mining Top-n Local Outliers in Large Databases”. In: KDD (2001).
[11]H. Liu, K. C. Jezek, and M. E. O’Kelly, “Detecting outliers in irregularly distributed spatial data sets by locally adaptive and robust statistical analysis and gis”. International Journal of Geographical Information Science,15(8), 2001. pp.721–741.
[12]Aggarwal, C.C, Yu, P. "Outlier detection for high dimensional data", Proceedings of the ACM SIGMOD International Conference on Management of Data. Santa Barbara, CA, 2001, pp. 37-47.
[13]Breunig, M.M., Kriegel, H.P., and Ng, R.T., “LOF: Identifying density-based local outliers.” ACM Conference Proceedings, 2000, pp. 93-104.
[14]E. Knorr, R. Ng, and V. Tucakov, “Distance-Based Outlier: Algorithms and Applications,” VLDB J., vol. 8, nos. 3-4 2000, pp. 237-253.
© 2017, IRJET
|
Impact Factor value: 5.181
|
ISO 9001:2008 Certified Journal
|
Page 638
[16]Knorr, E.M., Ng, R.T., "Finding Intentional Knowledge of Distance-Based Outliers", Proceedings of the 25thInternational Conference on Very Large Data Bases, Edinburgh, Scotland, pp.211-222, September 1999.
[17] Berchtold, S., Keim, D., Kriegel, H.-P, “The X-tree: An efficient and robust access method for points and rectangles”. In: VLDB (1996).
[18] Rousseeuw, P. & Leroy, A. (1996).,”Robust Regression and Outlier Detection”, 3rd edn. John Wiley & Sons.
[19] A. Arning, R. Agrawal, and P. Raghavan, “A Linear Method for Deviation Detection in Large Databases,” Proc. Int'l Conf. Knowledge Discovery and Data Mining, 1996, pp. 164-169.
[20] Barnett, V. & Lewis, T. (1994).,”Outliers in Statistical Data”, 3rd edn. John Wiley & Sons. [21] D. M. Hawkins, “Identification of Outliers”. Chapman and Hall, London, 1980.
[22] Yamanishi. K, Takeuchi. J ,and Williams. G On-line, “unsupervised outlier detection using finite mixtures with discounting learning algorithms”. In Proceedings of the Sixth ACM SIGKDDOO, Boston, MA, USA, pp.320-324. [23] Yufeng Kou, Chang-Tien Lu, Dos Santos, R.F.” Spatial Outlier Detection: A Graph-Based Approach”, ICTAI 2007, Volume
1, 2007,pp.281 – 288.
[24] Haowen Guan, Qingzhong Li, Zhongmin Yan, Wei Wei.” SLOF: Identify Density-based Local Outliers in Big Data ”, 2015 12th Web Information System and Application Conference.