Epigenomic plasticity enables human
pancreatic
aa
to
bb
cell reprogramming
Nuria C. Bramswig, … , Markus Grompe, Klaus H. Kaestner
J Clin Invest. 2013;
123(3)
:1275-1284.
https://doi.org/10.1172/JCI66514
.
Insulin-secreting
b
cells and glucagon-secreting
a
cells maintain physiological blood
glucose levels, and their malfunction drives diabetes development. Using ChIP sequencing
and RNA sequencing analysis, we determined the epigenetic and transcriptional landscape
of human pancreatic
a
,
b
, and exocrine cells. We found that, compared with exocrine and
b
cells, differentiated
a
cells exhibited many more genes bivalently marked by the activating
H3K4me3 and repressing H3K27me3 histone modifications. This was particularly true for
b
cell signature genes involved in transcriptional regulation. Remarkably, thousands of these
genes were in a monovalent state in
b
cells, carrying only the activating or repressing mark.
Our epigenomic findings suggested that
a
to
b
cell reprogramming could be promoted by
manipulating the histone methylation signature of human pancreatic islets. Indeed, we show
that treatment of cultured pancreatic islets with a histone methyltransferase inhibitor leads to
colocalization of both glucagon and insulin and glucagon and insulin promoter factor 1
(PDX1) in human islets and colocalization of both glucagon and insulin in mouse islets.
Thus, mammalian pancreatic islet cells display cell-type–specific epigenomic plasticity,
suggesting that epigenomic manipulation could provide a path to cell reprogramming and
novel cell replacement-based therapies for diabetes.
Research Article
Find the latest version:
Research article
Epigenomic plasticity enables human
pancreatic
α
to
β
cell reprogramming
Nuria C. Bramswig,1 Logan J. Everett,1 Jonathan Schug,1 Craig Dorrell,2 Chengyang Liu,3
Yanping Luo,3 Philip R. Streeter,2 Ali Naji,3 Markus Grompe,2 and Klaus H. Kaestner1
1Department of Genetics and Institute for Diabetes, Obesity and Metabolism, Perelman School of Medicine,
University of Pennsylvania, Philadelphia, Pennsylvania, USA. 2Oregon Health and Science University, Portland, Oregon, USA. 3Department of Surgery, University of Pennsylvania, Philadelphia, Pennsylvania, USA.
Insulin-secreting
β
cells and glucagon-secreting
α
cells maintain physiological blood glucose levels, and their
malfunction drives diabetes development. Using ChIP sequencing and RNA sequencing analysis, we determined
the epigenetic and transcriptional landscape of human pancreatic
α
,
β
, and exocrine cells. We found that,
com-pared with exocrine and
β
cells, differentiated
α
cells exhibited many more genes bivalently marked by the
activating H3K4me3 and repressing H3K27me3 histone modifications. This was particularly true for
β
cell
sig-nature genes involved in transcriptional regulation. Remarkably, thousands of these genes were in a monovalent
state in
β
cells, carrying only the activating or repressing mark. Our epigenomic findings suggested that
α
to
β
cell reprogramming could be promoted by manipulating the histone methylation signature of human
pancre-atic islets. Indeed, we show that treatment of cultured pancrepancre-atic islets with a histone methyltransferase
inhibi-tor leads to colocalization of both glucagon and insulin and glucagon and insulin promoter facinhibi-tor 1 (PDX1) in
human islets and colocalization of both glucagon and insulin in mouse islets. Thus, mammalian pancreatic islet
cells display cell-type–specific epigenomic plasticity, suggesting that epigenomic manipulation could provide a
path to cell reprogramming and novel cell replacement-based therapies for diabetes.
Introduction
The islets of Langerhans, miniature endocrine organs within the pan-creas, are essential regulators of blood glucose homeostasis and play a key role in the pathogenesis of diabetes, a group of diseases current-ly affecting more than 336 million people worldwide, with healthcare costs by diabetes and its complications of up to $612 million per day in the US alone (1). While for decades, insulin deficiency was consid-ered the sole issue, recent studies emphasize excess glucagon as an important part of diabetes etiology, making diabetes a “bihormonal disease” (2). Increasing the number of insulin-producing β cells while decreasing the number of glucagon-producing α cells, either in vitro in donor pancreatic islets before transplantation into type 1 diabet-ics or in vivo in type 2 diabetdiabet-ics, is a promising therapeutic avenue.
Epigenetic studies have shown that manipulation of rodent histone acetylation signatures can alter embryonic pancreatic differentia-tion and composidifferentia-tion (3, 4). Recently, studies in rodent models have suggested that under extreme conditions, such as enforced paired box gene 4 (Pax4) or pancreatic and duodenal homeobox gene 1 (Pdx1) overexpression or near complete β cell ablation, cells can be reprogrammed toward the β cell fate (5–7). However, the molecular basis of this reprogramming potential is unknown. We wondered whether epigenetic mechanisms play a role in this process and whether α cells exist in a metastable epigenetic state that facilitates their reprogramming. While previous studies have characterized histone methylation signatures, open chromatin sites, and CTCF-binding (CCCTC-CTCF-binding factor) sites of whole human islets (8–10), cell-type–specific epigenetic signatures and RNA sequencing (RNA-Seq) analysis of human pancreatic cells have not been determined.
We employed a previously published sorting strategy of human islets to obtain cell populations highly enriched for α, β, and
exo-crine (duct and acinar) cells (11) to assess their cell-type–specific histone methylation profiles. We chose to investigate the trimeth-ylation of the fourth amino acid (lysine) on histone H3 (H3K4me3) and the H3K27me3 mark because of their known association with cell-fate determination and important roles in the regulation of transcription (12–14). While the H3K4me3 modification is associ-ated with gene activation, the H3K27me3 mark is linked to repres-sion of transcription (14). The presence of both marks at the same gene is referred to as a bivalent mark and is more common in plu-ripotent, undifferentiated cells than in terminally differentiated cells (12). The bivalent mark keeps genes poised in an activatable state and is usually resolved during differentiation.
Our human pancreatic cell-type–specific analysis of the activating and repressive histone methylation landscape and the parallel deter-mination of the complete transcriptome using RNA-Seq provide an important resource for the diabetes research community. Impor-tantly, detailed analysis of these histone marks, their integration with gene expression data, and in vitro manipulation of their epig-enomic signature suggests a new pathway to reprogram α to β cells.
Results
Human pancreatic islets from deceased organ donors (n = 6, Sup-plemental Table 1; supSup-plemental material available online with this article; doi:10.1172/JCI66514DS1) were sorted into highly enriched α, β, and exocrine (duct and acinar) cell fractions using a recently developed cell-surface antibody panel (11) and the additional anti-body 2D12 (Figure 1A). Sample purity of the sorted α and β cell populations was validated by quantitative RT-PCR (qRT-PCR) for relevant marker genes. We calculated the sample purity as percent-age of contamination by the opposite cell type and found our α and β cell fractions to be on average 94% and 92% pure (Figure 1B, formula in Supplemental Methods). Next, we determined the tran-scriptomes and histone methylation profiles of the sorted cell frac-Conflict of interest: The authors have declared that no conflict of interest exists.
Citation for this article:J Clin Invest. 2013;123(3):1275–1284. doi:10.1172/JCI66514.
research article
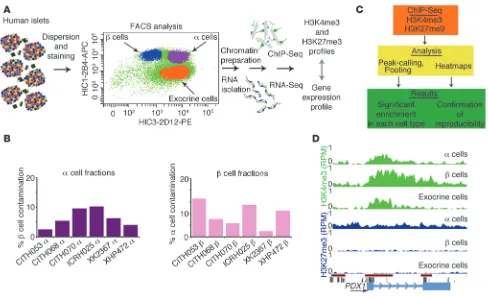
tions by RNA-Seq and ChIP/ultra high-throughput sequencing (ChIP-Seq) (Figure 1A). We analyzed the histone methylation pro-files of each donor and cell type individually, pooled the H3K4me3 and H3K27me3 calls of each cell type to obtain cell-type–specific histone methylation profiles, and validated this approach by con-firming the enrichment calls and their low interindividual variabili-ty in a heat map analysis (Figure 1C). As an example, the enrichment profiles for H3K4me3 and H3K27me3 for the diabetes gene PDX1
in α, β, and exocrine cells are shown in Figure 1D. PDX1 is expressed in mature β cells and at lower levels in exocrine cells, but not in α cells (15, 16), which is clearly reflected by the histone modifications, with H3K4me3 enrichment in all cell fractions, but an additional, repressive H3K27me3 mark present only in α cells. Thus, the PDX1
locus is marked monovalently by H3K4me3 in β and exocrine cells, but carries a bivalent mark (H3K4me3 and H3K27me3) in α cells.
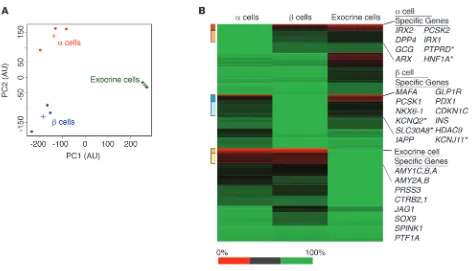
We performed RNA-Seq analysis to assess the genome-wide tran-scriptional landscape in our sorted cell populations and to analyze the purity of our cell populations on a genome-wide scale. Principal component analysis showed that our sorted cell populations were distinct and that the replicates (n = 3 α, n =3 β, n = 2 exocrine)
[image:3.585.50.538.79.376.2]clus-tered together tightly (Figure 2A). Next, we performed cluster anal-ysis to identify groups of genes with distinct expression patterns across cell types, to focus on the cell-type–specific transcriptional differences, and to classify α, β, and exocrine cell–specific signature genes. We present our results in a heat map, in which the 3 cell populations are displayed in their respective columns, and we iden-tify clusters of α, β, or exocrine cell–specific signature genes, which are marked as colored boxes next to the heat map (Figure 2B). Among the α cell–specific genes are, as expected, the α cell–specific transcription factor aristaless related homeobox (ARX) and the α cell hormone glucagon (GCG). In addition, the enzymes prohor-mone convertase 2 (PCSK2) and dipeptidyl peptidase-4 (DPP4) are expressed specifically in α cells, the latter an important target of the commonly used group of oral drugs for type 2 diabetes, the DPP4 inhibitors or gliptins. Not surprisingly, the exocrine cell–specific genes include many digestive enzymes, their inactive precursors, and their inhibitors, such as various amylase isoforms (AMY1A, AMY1B, AMY1C, AMY2A, and AMY2B), pancreatic trypsinogen III (PRSS3), chymotrypsinogen I and II (CTRB1 and CTRB2), and the trypsin inhibitor serine peptidase inhibitor, kazal type 1 (SPINK1).
Figure 1
Study design for determination of the transcriptome and differential histone marks in sorted human islet cells. (A) Human islets were dispersed
and subjected to FACS to obtain cell populations highly enriched for α, β, and exocrine (duct and acinar) cells. Chromatin was prepared and precipitated with antibodies for H3K4me3 and H3K27me3 followed by high-throughput sequencing (ChIP-Seq) (H3K4me3: n = 4 α, n = 4 β, n = 2 exocrine, H3K27me3: n = 3 α, n = 3 β, n = 2 exocrine). RNA-Seq analysis was performed to determine mRNA and lncRNA levels (n = 3 α, n = 3 β,
n = 2 exocrine). (B) Sample purity assessment. Normalized insulin and glucagon expression levels of the individual α and β cell populations were obtained by qRT-PCR to calculate the contamination by the opposite cell population, revealing high sample purity (2.5%–10.3% contamination in the α and 2-13.1% contamination in the β cell populations; details in Supplemental Methods). (C) Analysis pipeline for H3K4me3 and H3K27me3
ChIP-Seq data. Peak calling (H3K4me3: GLITR; H3K27me3: STAR) on individual replicates, followed by signal pooling, was employed to assess histone modification profiles of α, β, and exocrine cells. Heat map analysis confirmed reproducibility of replicates. (D) Genome browser image
research article
In addition, jagged 1 (JAG1), the transcription factor SOX9, and pancreas-specific transcription factor 1a (PTF1A) are also among the exocrine-specific genes. Our RNA-Seq based list of β cell– enriched genes includes the β cell–specific transcription factors MAFA, NKX6-1, and PDX1 as well as the β cell hormone insulin (INS) and one of the key enzymes for its synthesis, prohormone convertase 1 (PCSK1). The β cell–specific cluster also included histone deacetylase 9 (HDAC9), which has previously been shown to be enriched in murine β cells (4). Remarkably, we found many genes identified in genome-wide association studies for nonauto-immune forms of diabetes (17) among the α cell and β cell–spe-cific genes, such as the hepatocyte nuclear transcription factor 1-α (HNF1A) and the protein-tyrosine phosphatase δ (PTPRD) in α cells, the potassium channels KCNQ2 and KCNJ11, and the zinc transporter SLC30A8 in β cells. The complete gene lists of α, β, and exocrine cell–specific clusters are provided in Supplemental Table 2. In addition, we provide the transcriptomes of our α, β, and exocrine cell populations, including normalized expression values of every gene (Supplemental Table 3).
To extend the analysis of our human α and β cell–specific tran-scription atlas, we searched for novel, cell-type–specific long non-coding transcripts. Long nonnon-coding RNA molecules (lncRNAs) have been implicated as important developmental regulators, cell lineage allocators, and contributors to disease development (18). Recently described human islet lncRNAs were regulated during development and dysregulated in type 2 diabetic islets (19).
There-fore, discovery of novel lncRNAs and evaluation of their function can potentially provide insight into diabetes pathogenesis. We dis-covered 12 β cell–specific, and 5 α cell–specific noncoding tran-scripts, indicative of the valuable research resource represented by our transcriptome data (Supplemental Table 4).
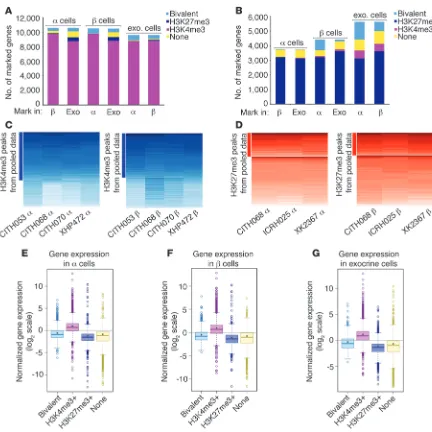
Next, we focused on the genome-wide, monovalent histone mod-ification landscapes of our sorted pancreatic cell populations. We identified monovalent H3K4me3-enriched regions in α, β, and exo-crine cells and compared them among the 3 cell types (Figure 3A). Strikingly, the vast majority of monovalently H3K4me3-marked genes were shared among the 3 pancreatic cell lineages (83%–95%), reflecting both their related function in protein secretion and common embryonic descent (Figure 3A).
[image:4.585.59.531.78.349.2]To investigate the landscape of repressive histone modifications, we performed H3K27me3 ChIP-Seq analysis and detected monova-lent H3K27me3 enrichment at 3,755 gene regions in α, 4,420 gene regions in β, and 5,628 gene regions in exocrine cells (Figure 3B). Sim-ilar to the H3K4me3 modification, we found a high degree of overlap of monovalently H3K27me3-marked genes among the 3 cell popula-tions (73%–83%, Figure 3B). Our H3K4me3 and H3K27me3 enrich-ment calls were validated by heat map analysis of the biological α and β cell replicates showing low interindividual variability (Figure 3, C and D). The box-and-whisker plots display the gene expression lev-els of bivalently marked, H3K4me3 marked, H3K27me3 marked and “unmarked” genes in each cell population (Figure 3, E–G). We show that bivalent, monovalent H3K4me3, and monovalent H3K27me3
Figure 2
Genome-wide transcriptome analysis using RNA-Seq confirms high purity of sorted cell populations and reveals cell-type–specific gene expression. (A) Principal component analysis displays distinct cell populations and clustering of replicates (n = 3 α, n = 3 β, n = 2 exocrine), which confirms the high purity of our sorted cell populations (dots, replicates; crosses, averages). (B) Heat map analysis shows groups of genes with distinct
research article
enrichment calls were correlated genome wide with their respective mRNA levels at high statistical significance.
Bernstein and colleagues observed bivalent marks to be common in undifferentiated cells, such as ES cells and pluripotent progeni-tor cells, and in most cases, one of the histone modification marks was lost during differentiation, accompanying lineage specifica-tion (12–14). Consequently, most genes in differentiated cells are marked by either H3K4me3 or H3K27me3, corresponding to an
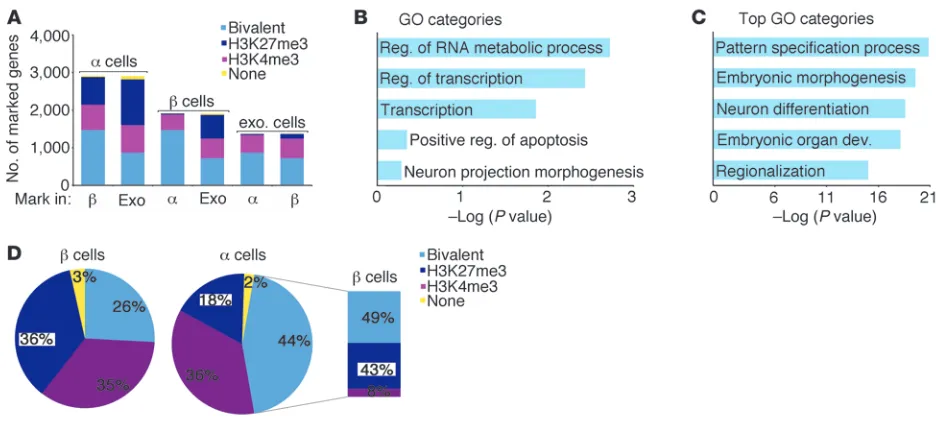
[image:5.585.75.507.78.510.2]expressed or repressed state, respectively. Preserving the bivalent state in a subset of genes was suggested to maintain higher plastic-ity (12–14). Interestingly, α cells showed the highest incidence of bivalent marks (2915 gene regions), followed by β cells (1914) and exocrine cells (1368) (Figure 4). As an internally controlled data set, we determined the bivalent domains for all 3 cell types in 1 individual donor (CITH068) and confirmed the higher number of bivalent marks in α cells (Supplemental Figure 1).
Figure 3
Human α, β, and exocrine cells exhibit convergent monovalent H3K4me3 and H3K27me3 profiles, which correlate highly with genome-wide expression data. (A) The majority of H3K4me3-marked genes are shared between α, β, and exocrine cells (their overlap is indicated in the purple portion of the bars, 83%–95%). (B) H3K27me3 modification patterns are similar among pancreatic cell types (73%–83%, dark blue portion of the
bars). (C and D) Heat map analysis (columns, individual samples; rows, genes) confirms low interindividual variability for all H3K4me3 (C) and
H3K27me3 (D) peaks identified from the pooled data (peaks called by algorithms are indicated by the solid bars on the left of the heat maps).
All pairs of columns in every heat map are significantly correlated based on correlation t test assessed by R statistics software (P < 2.2 × 10⁻¹⁶).
(E–G) Normalized expression values obtained by RNA-Seq for genes grouped by their histone modification status in each cell type are shifted
sig-nificantly above or below baseline expression (Wilcoxon signed rank test, P < 2.2 × 10⁻¹⁶). A shift above 0 on this scale indicates highly expressed
genes and was observed for gene groups marked solely by H3K4me3 in all cell types (pink boxes in E–G). A shift below 0 on this scale indicates
research article
Analysis of genes carrying a bivalent mark in β cells showed that the majority of these genes were also marked bivalently in α cells (1,474 genes, 77%), while 26 genes carried a monovalent H3K27me3 mark and 406 genes carried a monovalent H3K4me3 mark in α cells. Gene ontology analysis (20, 21) of the 406 genes marked biva-lently in β cells, but monovalently by H3K4me3 in α cells, revealed 3 significantly enriched categories (Figure 4B). However, no signifi-cantly enriched categories were identified in the 523 genes marked bivalently in exocrine, but monovalently by H3K4me3 in β cells, or the 467 genes marked bivalently in exocrine, but monovalently by H3K4me3 in α cells (data not shown). The histone methylation status (H3K4me3, H3K27me3, bivalent, none of the above) of every gene in α, β, and exocrine cells is provided in Supplemental Table 5. Interestingly, nearly half of the genes that displayed a bivalent mark in α cells were marked only by H3K4me3 or H3K27me3 in β cells (48%, 1,406 genes) (Figure 4A) in contrast to 434 genes (22%) marked bivalently in β cells, but monovalently in α cells. Strikingly, gene ontology analysis of genes that were marked biva-lently in α cells, but only by the repressive H3K27me3 mark in β cells, displayed highly significant enrichment for genes involved in developmental processes (Figure 4C and Supplemental Table 6), suggesting a more plastic epigenetic state of developmental genes in α cells and a more fixed epigenetic condition in β cells. To fur-ther strengthen these observations, we compared transcriptional regulators marked bivalently in human ES cells (hESCs) (22) to their histone profile in α and β cells. We found that only 26% of all transcriptional regulators marked bivalently in hESCs also showed a bivalent mark in β cells, while nearly half of them were marked bivalently in α cells (44%) (Figure 4D). Further analysis of genes marked bivalently in both hESCs and α cells showed that 43% of
these genes were H3K27me3 modified in β cells (Figure 4D). These findings provide additional support for the enhanced epigenetic plasticity of human α cells.
Next, we integrated our histone modification ChIP-seq data sets with the specific transcriptional signatures of α, β, and exocrine cells identified from our RNA-seq analysis (Figure 2B). Quanti-tative analysis of H3K4me3 and H3K27me3 enrichment at α, β, and exocrine cell–specific signature genes in each of these cell types showed increased H3K4me3 levels in their respective signa-ture gene group, as expected (Supplemental Figure 2A). Interest-ingly, H3K27me3 levels of α cell–specific genes were comparable between α and β cells, whereas H3K27me3 levels of β cell–specific genes were increased in α cells and decreased in β cells, supporting higher prevalence of the H3K27me3 mark repressing β-signature genes in α cells rather than vice versa.
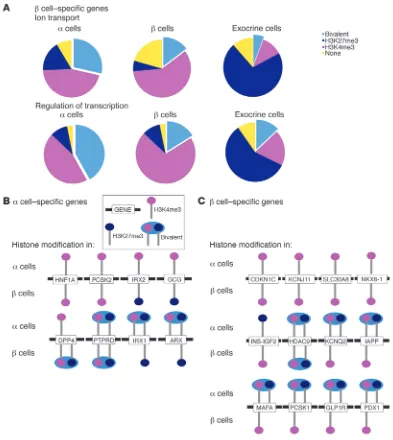
[image:6.585.58.526.80.292.2]Next, we wanted to assess whether the increased H3K27me3 mark in α cells was indicative of higher bivalency in functionally relevant β cell–specific genes, such as the transcriptional regula-tors that control cell-type–specific gene expression. We analyzed functional gene categories within the strongly α and β cell–spe-cific genes (Figure 2B). Analysis of β cell–specific genes implicated in “ion transport” (34 genes) showed that 29% of the genes were marked bivalently in α, 15% in β, and 6% in exocrine cells. Interest-ingly, analysis of β cell–specific genes implicated in “regulation of transcription” (31 genes) displayed a much higher percentage of bivalently marked genes in α cells (42%) than in β or exocrine cells in reverse (16% and 13%), which was not observed in any of these functional categories in α cell–specific signature genes (Supple-mental Figure 2B). In summary, a large fraction of β cell–specific transcriptional regulatory genes are in a bivalent state in α cells.
Figure 4
Human α cells demonstrate a higher number of bivalently marked genes than β and exocrine cells. (A) Here, α cells display more bivalently marked loci than β and exocrine cells. Nearly half of the genes bivalently marked in α cells carry a monovalent mark in β cells (purple and dark blue portion of the far left bar corresponding to H3K4me3 and H3K27me3 marks in β cells, respectively). (B) 406 genes are marked bivalently
in β cells, but monovalently by H3K4me3 in α cells, and gene ontology analysis for these genes shows 3 modestly enriched categories: regula-tion (reg.) of RNA metabolic process, regularegula-tion of transcripregula-tion, and transcripregula-tion. (C) Genes marked bivalently in α cells, but monovalently by H3K27me3 in β cells, are significantly enriched for developmental processes. For detailed GO analysis see Supplemental Table 6. (D)
research article
Finally, we focused our cell-type–specific analysis of the histone modification landscape on α and β cell–specific genes known to be important for pancreatic development and endocrine cell func-tion. Analysis of the histone marks of α cell–specific genes in β cells identified many as being marked monovalently by H3K4me3 (HNF1A, PCSK2) or by H3K27me3 (Iroquois related homeobox 2 [IRX2], GCG, IRX1, ARX), whereas only 2 genes showed a bivalent
[image:7.585.96.489.81.521.2]histone modification profile (DPP4, PTPRD) (Figure 5B). As expect-ed, most α cell–specific genes were marked only by H3K4me3 in α cells. However, the genes PTPRD, IRX1, and the locus encoding the α cell–specific transcription factor ARX were marked biva-lently (Figure 5B). Strikingly, most β cell–specific genes important for β cell function displayed monovalent H3K4me3 enrichment (with the exception of HDAC9) in β cells (Figure 5C), while 7 of
Figure 5
Human α cells display higher bivalency in genes encoding β cell transcriptional regulatory proteins. (A) The epigenetic status of β cell signature genes (Figure 2B) functioning in ion transport or regulation of transcription was analyzed separately for α, β, and exocrine cells. Of the β cell– enriched ion transport genes, only 6% and 15% were marked bivalently in exocrine and β cells, respectively, while 29% carried this mark in α
cells. For β cell signature genes involved in transcriptional regulation, 42% were marked as bivalent in α cells, but only 16% and 13% in β cells and exocrine cells, respectively. Thus α cells display a higher degree of bivalency for genes important in transcriptional regulation than for genes implicated in ion transport. (B and C) Schematic representation of the histone modification status of a relevant subset of human α and β cell sig-nature genes (Figure 2B). The histone modification status of β cells is shown below each gene of interest. (B) As expected, most α cell signature genes are marked monovalently by H3K4me3 in α cells, and many of them carry a monovalent H3K27me3 mark in β cells. Interestingly, IRX1 and
research article
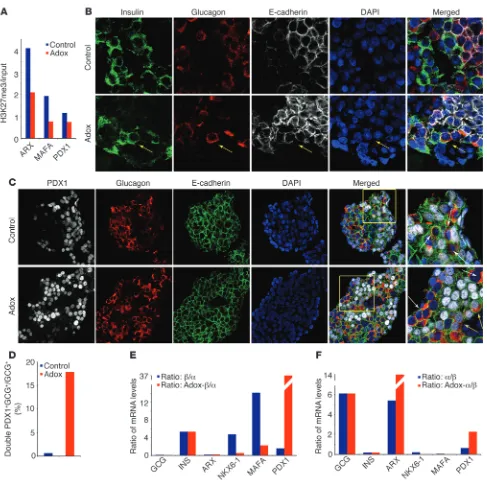
Figure 6
Inhibition of histone methyltransferases leads to partial endocrine cell-fate conversion. (A) H3K27me3 ChIP-Seq analysis of human islets shows
decreased H3K27me3 levels at the ARX, MAFA, and PDX1 loci following treatment of human islets with the histone methyltransferase inhibitor Adox. (B) Adox-treatment of human islets results in colocalization of glucagon (red) and insulin (green) granules within the same cell (yellow
arrows), suggesting partial endocrine cell fate conversion, which was not seen in vehicle-treated islets (control). Original magnification, ×63. For Z-stack confocal images see Supplemental Videos 1 and 2. (C) Treatment of human islets with Adox results in colocalization of the β cell–specific transcription factor Pdx1 (white) and glucagon (red), further indicating endocrine reprogramming (white arrows: glucagon-positive, Pdx1-negative cells; yellow arrows: glucagon-positive, Pdx1-positive cells). The images on the right correspond to the area within yellow box. Original magnifica-tion, ×63. (D) Quantification of glucagon-positive, Pdx1-positive cells in untreated and Adox-treated human islets reveals many double-positive
cells after Adox treatment, indicating initiation of reprogramming events in α cells. (E) Adox treatment of human islets leads to a decrease in
research article
12 β cell–specific loci were marked bivalently in α cells, including the functionally relevant genes PCSK1 and GLP1R and the genes encoding the crucial β cell–specific transcription factors MAFA and PDX1. We extended our findings by utilizing previously pub-lished H3K4me3 and H3K27me3 data of CD4-positive T cells (23) and compared our pancreatic histone modification profiles to the histone modification landscape of this extrapancreatic cell type. The histone modification profiles of all strongly α, β, and exocrine cell–specific genes in α, β, exocrine, and CD4+ T cells can be found
in Supplemental Table 7. As expected, we found significant mon-ovalent enrichment for the activating H3K4me3 mark in only 4 of the 34 selected α, β, and exocrine cell–specific genes (Supplemen-tal Table 8), as these pancreatic genes are not active in lymphoid cells. In summary, α cells preserve high bivalency in many genes known to be crucial for endocrine cell development and function.
The high incidence of bivalent marks in α cells, the interesting bivalent pattern of β and α cell–specific transcription factors in α cells, and the large overlap with bivalently marked transcrip-tional regulators in hESCs raised the possibility that epigenomic manipulations could be exploited to reprogram human α cells toward the β cell phenotype. Several drugs, such as adenosine dialdehyde (Adox) and 3-deazaneplanocin A (DZNep), interfere with histone methylation (24). We employed the general histone methyltransferase inhibitor Adox, which among others decreases H3K27me3 levels (24), to test whether modulation of the histone methylation status of human pancreatic islets could promote reprogramming. To validate the effectiveness of the histone meth-yltransferase inhibitor Adox in human islet tissue, we investigated the H3K27me3 modification landscape after Adox treatment. The small numbers of cells recovered after Adox-treatment and FACS analysis did not allow us to perform cell-type–specific analysis of the H3K27me3 profiles, so we compared the H3K27me3 profiles of whole human islets cultured in the absence or presence of Adox. This experiment allowed us to assess whether H3K27me3 levels of repressed genes are decreased after Adox treatment. Indeed, analysis of genes that carry a bivalent mark or a monovalent H3K27me3 mark in all pancreatic cell populations displayed a strong decrease in H3K27me3 enrichment after Adox treatment (Supplemental Figure 3A). In addition, this experiment approxi-mated a cell-type–specific analysis of the H3K27me3 profiles of a subset of β cell–specific pancreatic transcription factors, namely those which are marked bivalently in α cells, but monovalently by H3K4me3 in β cells (MAFA and PDX1). Since α and β cells com-pose the vast majority (approximately 90%) of the human islet (25) and exocrine cells do not survive in culture (26), any change in H3K27me3 enrichment levels at these loci is thus likely indicative of changes in α cells at the MAFA and PDX1 loci, as there is no H3K27me3 present at these genes in β cells to begin with. In addi-tion, we investigated the H3K27me3 profile of the α cell–specific transcription factor ARX, which is marked bivalently in α cells, but monovalently by H3K27me3 in β cells. Our H3K27me3 ChIP-Seq analysis confirmed the expected decrease of H3K27me3 enrich-ment at these 3 gene loci after Adox treatenrich-ment (Figure 6A).
Strikingly, we found that treatment of human islets with Adox resulted in the occasional cooccurrence of glucagon and insu-lin granules within the same islet cell, which was not observed in untreated islets (Figure 6B, Supplemental Videos 1 and 2, and Supplemental Figure 3B). A priori, the colocalization of glucagon with insulin could be due to α to β cell fate or β to α cell fate conver-sion. As lineage tracing is not possible in human samples, we next
employed a murine genetic lineage tracing model to assess the origin of the dual hormone–positive cells. For this purpose, we treated islets from GlucagonCre;Rosa26EYFP mice, in which α cells are permanently marked by yellow fluorescence protein (YFP) expression (27, 28) with Adox in vitro. Adox-treated islets showed insulin granules in YFP+
cells, which were not observed in untreated control islets (Supple-mental Figure 3, C and D), supporting partial conversion of α cells to the β cell fate. Unfortunately, at the present time, no inducible Glucagon-Cre ER line exists, and the possibility that Adox-treated β cells activated the Glucagon-Cre promoter cannot be excluded. Since the colocalization of glucagon and insulin granules was observed in a small number of cells, we wanted to investigate whether the impor-tant β cell marker PDX1 was present in glucagon-positive cells, indi-cating the initiation of partial reprogramming events. Strikingly, we found that Adox treatment caused nuclear PDX1 expression in many glucagon-positive cells (Figure 6, C and D).
To investigate the transcriptional changes in Adox-treated human islets and confirm increased PDX1 expression, we per-formed FACS analysis after Adox treatment using the same anti-body panel as described above, followed by RNA-Seq analysis (n = 2 treated α, n = 2 treated β, technical replicates) and focused on cell-type–specific hormones and transcription factors. To assess whether Adox-treated β cells become more α cell like or vice versa, we first compared the ratio of expression levels in untreated β cells and untreated α cells (β/α) to the ratio in Adox-treated β cells and untreated α cells (Adox-β/α) (Figure 6E). We found a decrease in NKX6-1 and MAFA levels, an increase in PDX1 levels, and no change in insulin expression, but observed no change in the expression levels of the α cell–specific genes glucagon or ARX, giv-ing no indication for a gain of α cell identity. Second, we compared the ratio of expression values in untreated α cells and untreated β cells (α/β) to the ratio in Adox-treated α cells and untreated β cells (Adox-α/β) to elucidate whether Adox-treated α cells become more “β cell like” (Figure 6F). Our analysis revealed no change in insulin and glucagon and an increase in ARX levels. Interestingly, we detected a slight decrease in NKX6-1 and MAFA levels, but an increase in PDX1 expression. Taken together, these results confirm our observations of PDX1 expression in glucagon-positive cells in the immunofluorescent staining and favor partial α to β cell fate conversion over the alternative.
Discussion
Epigenetic modifications play important roles in the differentia-tion and funcdifferentia-tional maintenance of cell types and contribute to the development of complex diseases (29). Therefore, it is crucial to determine the specific epigenomic and transcriptional landscape of disease-relevant cell types and understand the epigenetic mech-anisms involved in maintaining or converting their cell-type–spe-cific identity. Previous studies have shown that reprogramming of α cells toward the β cell fate can occur under extreme conditions in mice (5–7). Using ChIP-Seq and RNA-Seq analysis, we investigate the cell-type–specific, genome-wide H3K4me3 and H3K27me3 profiles and transcriptional landscapes of human α and β cells, determined cell-type–specific differences, and showed that there is an epigenomic basis for this reprogramming potential.
research article
cells. This is likely due to the unspecific nature of the histone meth-yltransferase inhibitors currently available (24). In addition, MAFA, a bivalently marked gene in α cells, is not induced and maintains extremely low mRNA levels after Adox treatment. The persistently low expression of NKX6-1 and MAFA, and possibly the increased expression of ARX in Adox-treated α cells, likely contributes to the incomplete reprogramming of α to β cells. In fact, Zhou and col-leagues showed that enforced expression of Neurog3, Pdx1, and Mafa is necessary to achieve reprogramming of adult exocrine cells to β-like cells in mice (31), which stresses the requirement of Mafa expression for the accrual of partial β cell identity. Impor-tantly, the consistently low ARX expression in Adox-treated β cells and the increased PDX1 expression in treated α cells strongly sup-ports the switch from α to β cell fate, and not vice versa. Given the limited specificity of currently available “epigenomic drugs,” and the absence of cell division in cultured islets, the fate conversion achieved was only partial. Nevertheless, our findings suggest that a more targeted manipulation of the histone methylation signature in a histone modification and gene-specific manner might be exploit-ed to promote a more complete human α to β cell fate conversion.
In summary, our cell-type–specific study of histone modification signatures and corresponding RNA-Seq–based transcriptomes provides a valuable resource for the diabetes research community. Our results establish human cell-type–specific epigenomic plastic-ity and suggest that epigenomic manipulation of fully differentiat-ed human islet cells provides a path to cell reprogramming, which could be exploited for in vitro differentiation protocols toward the β cell fate and cell replacement–based therapy for diabetes.
Methods
FACS sorting of human islet cells and experimental setup. We performed FACS sorting on dispersed human islets using cell surface antibodies (1:20) and secondary antibodies (1:200; 115-116-075, 115-135-164, Jackson Immu-noResearch) as described before (11) to obtain cell populations highly enriched for α, β, and exocrine (duct and acinar) cells. Total RNA was iso-lated from whole islets, and sorted α, β, and exocrine cells using the Ambi-on mirVana miRNA Isolation Kit (AM1560) reverse transcribed to cDNA using SuperScript II reverse transcriptase (Invitrogen) and mRNA levels (normalized to β-actin, GAPDH) were measured by qPCR analysis. Sample purity of the sorted α and β cell populations was calculated as percentage of contamination by the opposite cell type. The formula can be found in the Supplemental Methods. In addition, chromatin was prepared from all sorted cell populations (see below).
ChIP-Seq analysis. ChIP and preparation of ChIP-Seq libraries was per-formed on individual cell sorts for each cell type and donor (H3K4me3: 8580, Abcam; H3K27me3: 07-449. Upstate). A detailed protocol includ-ing chromatin preparation, ChIP, and sequencinclud-ing library preparation (option 1: nonmulitplexed or option 2: multiplexed) is provided in Sup-plemental Methods.
Computational analysis. We utilized the GLITR algorithm (32) for detec-tion of H3K4me3 enrichment and the STAR algorithm (33) for detecdetec-tion of H3K27me3 enrichment, as the broad architecture of the repressive H3K27me3 mark requires more sensitive peak-calling algorithms for pre-cise analysis (34). All computational methods used for the ChIP-Seq and RNA-Seq analyses are described in detail in Supplemental Methods.
Adox treatment and immunostaining of human and mouse islets. Human islets and islets from GlucagonCre;Rosa26EYFP bigenic mice (27, 28) were cultured, treated with 50 μM adenosine dialdehyde (Adox, A7154; Sigma-Aldrich) for 72 hours, FACS sorted as described before, or prepared for immunostaining.
development. HDAC9 is also among our human β cell–specific genes (Figure 2B). Lenoir and colleagues observed β cell–spe-cific expression of the histone deacetylase 9 (Hdac9) in mice and detected an increase in β cell mass in Hdac9–/– mice (4). It would be
interesting to investigate whether HDAC9 inhibitors might show a similar effect in human islets and whether HDAC9 could be a target for diabetes treatment.
We show that human α, β, and exocrine cells share very simi-lar monovalent H3K4me3 and H3K27me3 histone modifica-tion maps. This does not support previously published murine H3K4me3 modification profiles, in which β cells clustered with neural tissues, but not acinar cells (30). This discrepancy might be due to the different experimental setup. While van Arensbergen and colleagues investigated the H3K4me3 profiles using promot-er arrays with limited covpromot-erage and sensitivity (30), we ppromot-erformed genome-wide H3K4me3 ChIP-Seq analysis and therefore analyzed a larger number of genes.
We discovered that pancreatic α cells carry hundreds of bivalent marks on developmental regulatory genes and display a bivalent modification profile remarkably similar to that of hESC, sug-gesting a more plastic epigenomic state for α cells than for β and exocrine cells. Importantly, many β cell–specific signature genes involved in gene regulation are bivalently marked in α cells. There-fore, we propose that this plastic epigenomic state of the α cell explains in part the relative ease in which α cells have been repro-grammed toward the β cell fate in various mouse models (5–7). In contrast, exocrine cells display the smallest number of bivalent marks (Figure 4A), which could explain the necessity of enforced expression of multiple key transcription factors to achieve limited conversion of exocrine cells toward the β cell fate in vivo (31).
Remarkably, we found that simple treatment of islets with the unspecific histone methyltransferase inhibitor Adox results in par-tial reprogramming of endocrine cell fates. After Adox treatment, we showed colocalization of insulin and glucagon in a small number of cells, but coexpression of the β cell marker PDX1 and glucagon at a much higher frequency. The discrepancy between the low number of GCG+INS+ and the much higher number of GCG+PDX1+ cells
sug-gests that reprogramming was initiated in a substantial subpopula-tion of α cells, but was nearly completed in only a few. As discussed below, the explanation for this incomplete reprogramming might be provided in our RNA-Seq analysis of Adox-treated α and β cells.
Although the colocalization of INS or PDX1 and GCG could a priori be due to β to α cell or α to β cell fate conversion, there are multiple lines of evidence indicating that it is caused by partial repro-gramming of α to β cell fate: (a) the higher genome-wide bivalency of α cells, especially at developmental regulatory genes and transcrip-tional regulatory genes expressed specifically in β cells, (b) the high overlap of bivalently marked transcriptional regulators of cells with hESC, (c) the fact that 2 of the 3 β cell–specific transcription factors are marked bivalently (PDX1 and MAFA) in α cells, (d) the colocaliza-tion of insulin in lineage-labeled α cells of GlucagonCre;Rosa26EYFP
mice, and (e) the expression patterns in Adox-treated α and β cells, which we will discuss in more detail below.
research article
Acknowledgments
We thank Catherine Lee May and Ben Stanger for providing
GlucagonCre;Rosa26EYFP mice; Kyoung Jae Won for helpful com-ments; and Alan Fox, Olga Smirnova, Erik Walp, and Jasmine Zhou for technical assistance. The program for provision of human pancreatic islets is supported by NIH/National Institute of Diabetes and Digestive and Kidney Diseases (NIDDK) grant U01 DK070430 and by Beckman Research Center/NIDDK/Integrated Islet Distribution Program grant 10028044. Human islets were also provided by the National Disease Research Interchange, with support from NIH grant U42 RR006042. We thank Paul Hallberg and Charles Pletcher for FACS analysis. This work was supported by NIH grants U01DK089529 and R01DK088383 to K.H. Kaest-ner and U01DK089569 to M. Grompe.
Received for publication August 23, 2012, and accepted in revised form December 13, 2012.
Address correspondence to: Klaus H. Kaestner, Department of Genetics and Institute for Diabetes, Obesity and Metabolism, Perelman School of Medicine, University of Pennsylvania, 12-126 Translational Research Center, 3400 Civic Center Boulevard, Phil-adelphia, Pennsylvania 19104, USA. Phone: 215.898.8759; Fax: 215.573.5892; E-mail: [email protected].
Immunofluorescent confocal analysis was performed as before (35). Sec-tions were blocked with CAS-Block (00-8120; Invitrogen) and stained using guinea pig anti-insulin (1:500; ab7842, Abcam), rabbit anti-glucagon (1:250; sc13091, Santa Cruz Biotechnology Inc.), guinea-pig anti-Pdx1 (1:1000; gift from C. Wright, Department of Cell and Developmental Biology, Vanderbilt University Medical Center, Nashville, Tennessee, USA), mouse anti–E-cad-herin (1:500; 610181, BD Transduction Laboratories), goat anti-GFP (ab6673; Abcam), guinea pig Cy2, guinea pig Cy5, rabbit Cy3, mouse Cy2, mouse Cy5, and goat Cy3 (1:500; Jackson Immunoresearch) antibodies. For quantifica-tion of double PDX1+GCG+ cells, Pdx1, glucagon, E-cadherin, and DAPI
staining were performed on untreated (control) and Adox-treated islets. All glucagon-positive cells and all PDX1+GCG+ double-positive cells were
count-ed manually (8 slides) for each condition, and the percentage of PDX1+GCG+
double-positive cells of all glucagon-positive cells was calculated.
Statistics. All statistical analyses were performed with the R software pack-age using standard functions. Correlations between genomic samples were assessed using the 2-tailed t test for correlation, implemented in the stan-dard R function cor.test. Wilcoxon signed rank test (stanstan-dard R function, wilcox.test) was used to assess the significance of gene expression distribu-tions shifted above or below baseline expression. In both cases, significance was defined by the stringent threshold P < 2.2 × 10⁻¹⁶. Additional details of
data processing are provided in Supplemental Methods.
Study approval. All animal studies were approved by the Institutional Ani-mal Care and Use Committee of the University of Pennsylvania.
1. Ashcroft FM, Rorsman P. Diabetes mellitus and the beta cell: the last ten years. Cell. 2012; 148(6):1160–1171.
2. Unger RH, Orci L. The essential role of glucagon in the pathogenesis of diabetes mellitus. Lancet. 1975; 1(7897):14–16.
3. Haumaitre C, Lenoir O, Scharfmann R. Histone deacetylase inhibitors modify pancreatic cell fate determination and amplify endocrine progenitors. Mol Cell Biol. 2008;28(20):6373–6383.
4. Lenoir O, et al. Specific control of pancreatic endo-crine β- and -δ cell mass by class IIa histone deacet-ylases HDAC4, HDAC5, and HDAC9. Diabetes. 2011;60(11):2861–2871.
5. Collombat P, et al. The ectopic expression of Pax4 in the mouse pancreas converts progenitor cells into alpha and subsequently beta cells. Cell. 2009; 138(3):449–462.
6. Thorel F, et al. Conversion of adult pancreatic alpha-cells to beta-cells after extreme beta-cell loss. Nature. 2010;464(7292):1149–1154.
7. Yang YP, Thorel F, Boyer DF, Herrera PL, Wright CV. Context-specific alpha- to-beta-cell reprogram-ming by forced Pdx1 expression. Genes Dev. 2011; 25(16):1680–1685.
8. Bhandare R, et al. Genome-wide analysis of histone modifications in human pancreatic islets. Genome Res. 2010;20(4):428–433.
9. Gaulton KJ, et al. A map of open chromatin in human pancreatic islets. Nat Genet. 2010; 42(3):255–259.
10. Stitzel ML, et al. Global epigenomic analysis of pri-mary human pancreatic islets provides insights into type 2 diabetes susceptibility loci. Cell Metab. 2010; 12(5):443–455.
11. Dorrell C, Abraham SL, Lanxon-Cookson KM, Canaday PS, Streeter PR, Grompe M. Isolation of major pancreatic cell types and long-term culture-initiating cells using novel human surface markers. Stem Cell Res. 2008;1(3):183–194.
12. Bernstein BE, et al. A bivalent chromatin structure marks key developmental genes in embryonic stem
cells. Cell. 2006;125(2):315–326.
13. Mikkelsen TS, et al. Genome-wide maps of chro-matin state in pluripotent and lineage-committed cells. Nature. 2007;448(7153):553–560.
14. Lien WH, et al. Genome-wide maps of histone modifications unwind in vivo chromatin states of the hair follicle lineage. Cell Stem Cell. 2011; 9(3):219–232.
15. Guz Y, et al. Expression of murine STF-1, a putative insulin gene transcription factor, in beta cells of pancreas, duodenal epithelium and pancreatic exo-crine and endoexo-crine progenitors during ontogeny. Development. 1995;121(1):11–18.
16. Wu KL, et al. Hepatocyte nuclear factor 3beta is involved in pancreatic beta-cell-specific tran-scription of the pdx-1 gene. Mol Cell Biol. 1997; 17(10):6002–6013.
17. McCarthy MI. Genomics, type 2 diabetes, and obesity. N Engl J Med. 2010;363(24):2339–2350.
18. Ponting CP, Oliver PL, Reik W. Evolution and functions of long noncoding RNAs. Cell. 2009; 136(4):629–641.
19. Moran I, et al. Human beta cell transcriptome analysis uncovers lncRNAs that are tissue-spe-cific, dynamically regulated, and abnormally expressed in type 2 diabetes. Cell Metab. 2012; 16(4):435–448.
20. Huang da W, Sherman BT, Lempicki RA. System-atic and integrative analysis of large gene lists using DAVID bioinformatics resources. Nat Protoc. 2009;4(1):44–57.
21. Huang da W, Sherman BT, Lempicki RA. Bioinfor-matics enrichment tools: paths toward the com-prehensive functional analysis of large gene lists. Nucleic Acids Res. 2009;37(1):1–13.
22. Pan G, et al. Whole-genome analysis of histone H3 lysine 4 and lysine 27 methylation in human embry-onic stem cells. Cell Stem Cell. 2007;1(3):299–312. 23. Barski A, et al. High-resolution profiling of histone
methylations in the human genome. Cell. 2007; 129(4):823–837.
24. Miranda TB, et al. DZNep is a global histone
meth-ylation inhibitor that reactivates developmental genes not silenced by DNA methylation. Mol Cancer Ther. 2009;8(6):1579–1588.
25. Brissova M, et al. Assessment of human pancreatic islet architecture and composition by laser scanning confocal microscopy. J Histochem Cytochem. 2005; 53(9):1087–1097.
26. Campbell IL, Colman PG, Harrison LC. Adult human pancreatic islet cells in tissue culture: func-tion and immunoreactivity. J Clin Endocrinol Metab. 1985;61(4):681–685.
27. Herrera PL. Adult insulin- and glucagon-producing cells differentiate from two independent cell lin-eages. Development. 2000;127(11):2317–2322. 28. Srinivas S, et al. Cre reporter strains produced
by targeted insertion of EYFP and ECFP into the ROSA26 locus. BMC Dev Biol. 2001;1:4.
29. Petronis A. Epigenetics as a unifying principle in the aetiology of complex traits and diseases. Nature. 2010;465(7299):721–727.
30. van Arensbergen J, et al. Derepression of Polycomb targets during pancreatic organogenesis allows insulin-producing beta-cells to adopt a neural gene activity program. Genome Res. 2010;20(6):722–732. 31. Zhou Q, Brown J, Kanarek A, Rajagopal J, Melton
DA. In vivo reprogramming of adult pancre-atic exocrine cells to beta-cells. Nature. 2008; 455(7213):627–632.
32. Tuteja G, White P, Schug J, Kaestner KH. Extract-ing transcription factor targets from ChIP-Seq data. Nucleic Acids Res. 2009;37(17):e113. 33. Lefterova MI, et al. Cell-specific determinants of
peroxisome proliferator-activated receptor gamma function in adipocytes and macrophages. Mol Cell Biol. 2010;30(9):2078–2089.
34. Malone BM, Tan F, Bridges SM, Peng Z. Compari-son of four ChIP-Seq analytical algorithms using rice endosperm H3K27 trimethylation profiling data. PLoS One. 2011;6(9):e25260.